It could be worse for Gold and Bitcoin, right? Apple alone has shed nearly $640 billion in market capitalisation over just three days. The S&P 500 has fallen more than 10% during the same stretch—its worst performance since the onset of the COVID-19 pandemic. In Asia, the selloff is even more severe, with Japan's Nikkei 225 down nearly 8%, South Korea’s Kospi 200 off almost 6%, and Taiwan equities falling close to 10%, triggering circuit breakers.
In comparison, Bitcoin and Gold, while under pressure, appear to be weathering the downturn with relatively less panic.
Bitcoin has declined around 10%—a notable drop, but not unusual by crypto standards. Trading near $76,000, it has returned to pre-election levels, breaching both short- and long-term support zones.
Gold is tracking its worst three-day performance in over four years. Although some positive forecasts are emerging. Deutsche Bank has revised its year-end gold price forecast upward to $3,350, citing rising recession risks and renewed safe-haven demand.
Goldtrading

XAUUSD Analysis todayHello traders, this is a complete multiple timeframe analysis of this pair. We see could find significant trading opportunities as per analysis upon price action confirmation we may take this trade. Smash the like button if you find value in this analysis and drop a comment if you have any questions or let me know which pair to cover in my next analysis.

GOLD ROUTE MAP UPDATEHey Everyone,
Great start to the week with our 1h chart route map playing out, as analysed.
We started the session with our Bearish targets 3034 and 3034 and then the retracement range targets at 2999 and 2975, followed with our Bullish target at 3055, perfectly inline with our plans to buy dips.
The range is currently big and we will continue to see play and test between the weighted levels. A re-test and break below the retracement range will open the swing rang. However, continuous support above the retracement range will see a further test at 3055 weighted Goldturn level and lock above 3055 will see the range above open.
We will keep the above in mind when taking buys from dips. Our updated levels and weighted levels will allow us to track the movement down and then catch bounces up.
We will continue to buy dips using our support levels taking 30 to 40 pips. As stated before each of our level structures give 20 to 40 pip bounces, which is enough for a nice entry and exit. If you back test the levels we shared every week for the past 24 months, you can see how effectively they were used to trade with or against short/mid term swings and trends.
BULLISH TARGET
3055 - DONE
EMA5 CROSS AND LOCK ABOVE 3055 WILL OPEN THE FOLLOWING BULLISH TARGET
3078
EMA5 CROSS AND LOCK ABOVE 3078 WILL OPEN THE FOLLOWING BULLISH TARGET
3094
EMA5 CROSS AND LOCK ABOVE 3094 WILL OPEN THE FOLLOWING BULLISH TARGET
3119
EMA5 CROSS AND LOCK ABOVE 3119 WILL OPEN THE FOLLOWING BULLISH TARGET
3148
BEARISH TARGETS
3034 - DONE
EMA5 CROSS AND LOCK BELOW 3034 WILL OPEN THE FOLLOWING BEARISH TARGET
3015 - DONE
EMA5 CROSS AND LOCK BELOW 3015 WILL OPEN THE FOLLOWING BEARISH TARGET
2999 - DONE
EMA5 CROSS AND LOCK BELOW 2999 WILL OPEN THE FOLLOWING BEARISH TARGET
2975 - DONE
EMA5 CROSS AND LOCK BELOW 2975 WILL OPEN THE SWING RANGE
SWING RANGE
2950 - 2922
As always, we will keep you all updated with regular updates throughout the week and how we manage the active ideas and setups. Thank you all for your likes, comments and follows, we really appreciate it!
Mr Gold
GoldViewFX

GOLD (XAUUSD): Updated Support & Resistance Analysis
Here is my latest structure analysis for Gold for next week.
Support 1: 2997 - 3015 area
Support 2: 2952 - 2955 area
Support 3: 2916 - 2933 area
Support 4: 2880 - 2890 area
Support 5: 2832 - 2858 area
Resistance 1: 3136 - 3167 area
Consider these structures for pullback/breakout trading next week.
❤️Please, support my work with like, thank you!❤️
I am part of Trade Nation's Influencer program and receive a monthly fee for using their TradingView charts in my analysis.

GOLD 1H CHART ROUTE MAP & TRADING PLAN FOR THE WEEKHey Everyone,
Please see our updated 1h chart levels and targets for the coming week.
We are seeing price play between two weighted levels with a gap above at 3055 and a gap below at 3034. We will need to see ema5 cross and lock on either weighted level to determine the next range.
We will see levels tested side by side until one of the weighted levels break and lock to confirm direction for the next range.
We will keep the above in mind when taking buys from dips. Our updated levels and weighted levels will allow us to track the movement down and then catch bounces up.
We will continue to buy dips using our support levels taking 30 to 40 pips. As stated before each of our level structures give 20 to 40 pip bounces, which is enough for a nice entry and exit. If you back test the levels we shared every week for the past 24 months, you can see how effectively they were used to trade with or against short/mid term swings and trends.
BULLISH TARGET
3055
EMA5 CROSS AND LOCK ABOVE 3055 WILL OPEN THE FOLLOWING BULLISH TARGET
3078
EMA5 CROSS AND LOCK ABOVE 3078 WILL OPEN THE FOLLOWING BULLISH TARGET
3094
EMA5 CROSS AND LOCK ABOVE 3094 WILL OPEN THE FOLLOWING BULLISH TARGET
3119
EMA5 CROSS AND LOCK ABOVE 3119 WILL OPEN THE FOLLOWING BULLISH TARGET
3148
BEARISH TARGETS
3034
EMA5 CROSS AND LOCK BELOW 3034 WILL OPEN THE FOLLOWING BEARISH TARGET
3015
EMA5 CROSS AND LOCK BELOW 3015 WILL OPEN THE FOLLOWING BEARISH TARGET
2999
EMA5 CROSS AND LOCK BELOW 2999 WILL OPEN THE FOLLOWING BEARISH TARGET
2975
EMA5 CROSS AND LOCK BELOW 2975 WILL OPEN THE SWING RANGE
SWING RANGE
2950 - 2922
As always, we will keep you all updated with regular updates throughout the week and how we manage the active ideas and setups. Thank you all for your likes, comments and follows, we really appreciate it!
Mr Gold
GoldViewFX

GOLD 4H CHART ROUTE MAP UPDATE & TRADING PLAN FOR THE WEEKHey Everyone,
Please see our updated 4h chart levels and targets for the coming week.
We are seeing price play between two weighted levels with a gap above at 3045 and 3078 due to ema5 lagging behind and a gap below at 3016. We will need to see ema5 cross and lock on either weighted level to determine the next range. We have a bigger range in play then usual.
We will see levels tested side by side until one of the weighted levels break and lock to confirm direction for the next range.
We will keep the above in mind when taking buys from dips. Our updated levels and weighted levels will allow us to track the movement down and then catch bounces up.
We will continue to buy dips using our support levels taking 30 to 40 pips. As stated before each of our level structures give 20 to 40 pip bounces, which is enough for a nice entry and exit. If you back test the levels we shared every week for the past 24 months, you can see how effectively they were used to trade with or against short/mid term swings and trends.
BULLISH TARGET
3045
3078
EMA5 CROSS AND LOCK ABOVE 3078 WILL OPEN THE FOLLOWING BULLISH TARGET
3109
EMA5 CROSS AND LOCK ABOVE 3109 WILL OPEN THE FOLLOWING BULLISH TARGET
3137
EMA5 CROSS AND LOCK ABOVE 3137 WILL OPEN THE FOLLOWING BULLISH TARGET
3170
BEARISH TARGETS
3016
EMA5 CROSS AND LOCK BELOW 3016 WILL OPEN THE FOLLOWING BEARISH TARGET
2987
EMA5 CROSS AND LOCK BELOW 2987 WILL OPEN THE FOLLOWING BEARISH TARGET
2965
EMA5 CROSS AND LOCK BELOW 2965 WILL OPEN THE FOLLOWING BEARISH TARGET
2928
EMA5 CROSS AND LOCK BELOW 2928 WILL OPEN THE SWING RANGE
SWING RANGE
2857 - 2894
As always, we will keep you all updated with regular updates throughout the week and how we manage the active ideas and setups. Thank you all for your likes, comments and follows, we really appreciate it!
Mr Gold
GoldViewFX

GOLD DAILY CHART MID/LONG TERM UPDATEHey Everyone,
This is an update on our daily chart idea that we have been tracking for a while now and finally completed last week. However, I wanted to continue to share an update on this, as its still playing out by falling back into the range on Fridays drop in price.
Historically, whenever we see a breakout outside of our unique Goldturn channels; I always state that, when price does a correction, we look for support outside of the channel top. This is playing out to perfection with Fridays drop finding support on the channel top, as highlighted by us on the chart with a circle. This was done with precision!!
We will now look for a test above at 3052 and a body close above this will follow with continuation to 3103 or a break below inside the channel top wall with ema5 will re-activate the levels below inside the channel, which we can then continue to track back up level to level, like we did before. I have also updated the levels above the channel to cover the new range.
This is the beauty of our Goldturn channels, which we draw in our unique way, using averages rather than price. This enables us to identify fake-outs and breakouts clearly, as minimal noise in the way our channels are drawn.
We will use our smaller timeframe analysis on the 1H and 4H chart to buy dips from the weighted Goldturns for 30 to 40 pips clean. Ranging markets are perfectly suited for this type of trading, instead of trying to hold longer positions and getting chopped up in the swings up and down in the range.
We will keep the above in mind when taking buys from dips. Our updated levels and weighted levels will allow us to track the movement down and then catch bounces up using our smaller timeframe ideas.
Our long term bias is Bullish and therefore we look forward to drops from rejections, which allows us to continue to use our smaller timeframes to buy dips using our levels and setups.
Buying dips allows us to safely manage any swings rather then chasing the bull from the top.
Thank you all for your likes, comments and follows, we really appreciate it!
Mr Gold
GoldViewFX

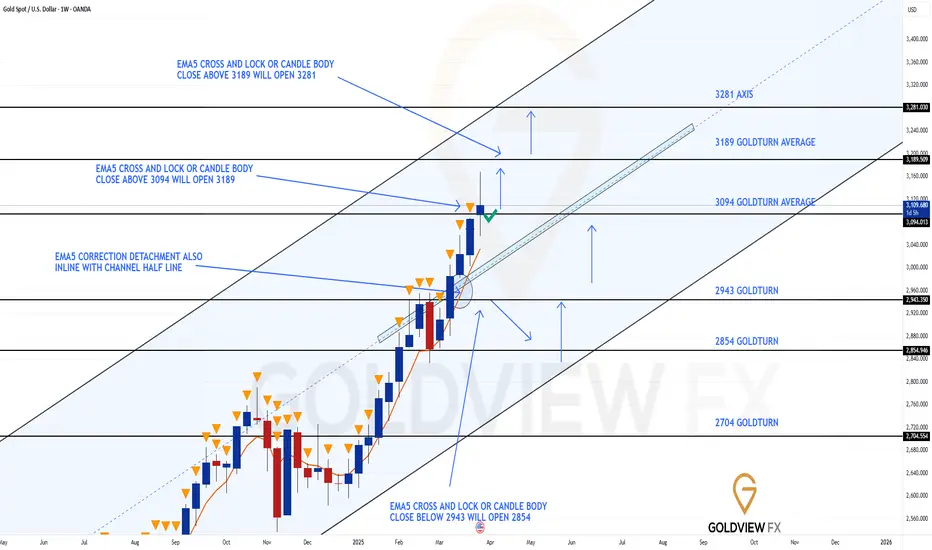
GOLD WEEKLY CHART MID/LONG TERM ROUTE MAPHey Everyone,
This is an update on our weekly chart ideas, which we have been tracking, as our long term route map.
After completing 3094 target no further body close or ema5 lock above this level. Therefore no further gaps left above and followed with a rejection. We are now looking for support and bounce on the channel half line or a cross and lock below the half line will open the lower range for the channel low Goldturns.
We expect the range play between the channel half-line and 3094 and will need a break on either of these levels to determine the next range.
This is the beauty of our channels, which we draw in our unique way, using averages rather than price. This enables us to identify fake-outs and breakouts clearly, as minimal noise in the way our channels are drawn.
Thank you all for your likes, comments and follows, we really appreciate it!
Mr Gold
GoldViewFX

Assignment for GOLD next weekBase on what happened this week. My idea for GOLD is simple and straight forward next week. After that strong expansion to the downside, i am expecting to see a retracement towards .5 or .62 of fib level before price will continue to go down and mitigate that big weekly imbalance below. Base on the structure of next weeks high impact news, my idea would be a simple consolidation for Monday till Wednesday since we got no high impact news on those given days. Then Thursday and Friday would be the expansion since we got FOMC,CPI and PPI for those 2 remaining days of the week... My entry would still be the same. Top down analysis using my multi timeframe strategy and wait for all timeframes to align and enter in 5m timeframe once it aligns with the overall higher timeframe. Good luck to us all and Happy trading...

GOLD WEEKLY CHART MID/LONG TERM ROUTE MAPHey Everyone,
Following on from yesterdays update on our mid/long term route map after completing the 1h, 4h and daily chart route maps. We completed 3094 target and stated that we will now need this weeks candle to finish and close and/or ema5 lock above 3094 to open the gap above.
- Looking like no close above 3094 on the weekly candle, if price stays below this level on market close. Amazing to see the weighted levels levels being respected like this to allow us to identify new range gaps or rejections.
We will be looking for support and bounce on the channel half line or a cross and lock below the half line will open the lower range for the channel low Goldturns.
This is the beauty of our channels, which we draw in our unique way, using averages rather than price. This enables us to identify fake-outs and breakouts clearly, as minimal noise in the way our channels are drawn.
We will now come back Sunday with our updated Multi time-frame analysis, Gold route map and trading plans for the week ahead and also a new Daily chart long term chart idea, now that this one is complete.
Have a smashing weekend!! And once again, thank you all for your likes, comments and follows, we really appreciate it!
Mr Gold
GoldViewFX

XAUUSD SELLXAUUSD short again. Caught another opportunity to sell !!Setting my position at 3135 // TP 3000 SL 3235. Let's see how this trade rolls :)
Day 17of100
L:5
W:3

XAUUSD ShortXAUUSD short again. With the previous drop and increase, I guess it's still safe to hold on to sell positions. Setting my position at 3138 // TP 3000 SL 3238. Let's see how this trade rolls :)
Day 16of100
L:5
W:2

XAU/USD Analysis – Wedge Breakdown & Bearish Trade Setup1. Chart Overview
The 15-minute XAU/USD chart shows a descending wedge pattern forming after a price rally. The wedge is characterized by a series of lower highs and lower lows, signaling a gradual weakening of bullish momentum. After consolidating within this wedge, the price has broken down, suggesting a bearish continuation.
This setup provides a high-probability short trade with clear entry, stop-loss, and multiple take-profit levels.
2. Key Technical Elements
A) Chart Pattern – Descending Wedge Breakdown
A descending wedge is typically a bullish reversal pattern when forming at the bottom of a downtrend. However, in this case, it appears at the end of a corrective move, making it a bearish continuation setup.
The upper trendline (black dashed line) acts as resistance, preventing price from breaking higher.
The lower trendline (solid blue line) represents temporary support.
The wedge narrows as price action contracts, leading to an eventual breakdown.
👉 Breakout Confirmation:
The price has broken below the wedge’s support trendline.
A minor pullback to retest the broken trendline suggests validation of the breakdown.
B) Resistance & Support Levels
1️⃣ Resistance Level (Sell Zone) – $3,100 to $3,135
This area previously acted as a supply zone, rejecting bullish attempts.
Price was unable to sustain above this level, leading to further downside pressure.
Stop-loss should be placed above this level ($3,135.57) to protect against invalidation.
2️⃣ Support Level (Buy Zone) – $3,050 to $3,056
This was a previous reaction zone where price briefly bounced before continuing lower.
Now acting as Take Profit 1 (TP1) at $3,056.58.
3️⃣ Breakout & Retest
After breaking the wedge, price retested the trendline but failed to reclaim it, confirming the bearish trend.
3. Trade Setup & Execution
🔵 Entry Point:
Short trade activation upon the breakdown and retest of the wedge structure.
Price rejection at the trendline confirms seller strength.
🔴 Stop-Loss:
Placed at $3,135.57, slightly above recent swing highs.
This protects against false breakouts or sudden reversals.
🎯 Take Profit Levels:
TP1 ($3,056.58): First target where buyers might step in.
TP2 ($3,022.39): Midway target, acting as another strong support.
TP3 ($2,985.44): Final target where price may stabilize or reverse.
4. Market Context & Confirmation Indicators
📉 Bearish Confirmation:
Strong downward momentum suggests continued selling pressure.
Price action is failing to make new highs, confirming lower highs and lower lows.
📊 Risk-to-Reward Ratio (RRR):
The trade offers a favorable RRR, as the downside potential is significantly larger than the stop-loss range.
⚡ Additional Confirmation:
A strong bearish candle confirmed the breakout, rejecting higher levels.
Potential support breakouts suggest that price could reach TP3 if bearish momentum continues.
5. Conclusion – Trading Strategy Summary
✅ Pattern Identified: Descending Wedge Breakdown (Bearish)
✅ Trade Direction: Short (Sell)
✅ Entry Trigger: Breakout & Retest of the Trendline
✅ Stop-Loss: Above $3,135.57 (Wedge Resistance Zone)
✅ Take Profit Targets:
TP1: $3,056.58
TP2: $3,022.39
TP3: $2,985.44
📌 Final Thoughts:
This setup provides a high-probability trade with a clear breakdown structure and downside potential. If the price continues to respect the bearish trend, reaching all TP levels is likely. However, traders should monitor for reversal signals and manage risk accordingly.
🔔 Risk Warning: Always use proper risk management and adjust positions according to market conditions! 🚀

GOLD WEEKLY CHART MID/LONG TERM ROUTE MAPHey Everyone,
After completing our 1H, 4H and daily chart idea, we now only have our long term weekly chart idea remaining . We will update new Multi timeframe route maps in preparation for next week on Sunday
Last week we stated that we still had the gap left open at 3094, after candle break above the channel half-line and ema5 lock.
-This gap is now complete!
We will now need this weeks candle to finish and close and/or ema5 lock above 3094 to open the gap above.
We also still have a detachment to ema5 lagging potentially due for further correction. We will look for ema5 lock or body close above or below the levels to confirm the next mid to long term range.
This is the beauty of our channels, which we draw in our unique way, using averages rather than price. This enables us to identify fake-outs and breakouts clearly, as minimal noise in the way our channels are drawn.
Thank you all for your likes, comments and follows, we really appreciate it!
Mr Gold
GoldViewFX
Gold price will look new price.XAU longOn the basis of the critical international situation, carrying on Ukraine War and extreme western nations debt. I strongly say that Gold price will look new price this year. next price is between 2500-2600. XAU is on its fifth wave Elliot on the technical logic too.

XAUUSD SHORTXAUUSD short again, 9yr high for Gold and still holding on to my shorts. another day, another entry. Setting my position at 3138 // TP 3000 SL 3238
A lil discouraged with the current rallies, however, this is what trading is like, you take your L's, gather your emotion, recalculate and execute again(when you're less emotional). Sticking to my Short positions because I believe that this will reverse, it may take a while but im willing to wait. Setting my TP to my previous target to cover previous losses and SL a lil bit further to secure my positions. This isnt a trading or financial advice but my personal trading plan. Let's see how this trade rolls.
Day 14of100
L:5
W:1

Another great trade for XAUUSD (GOLD) todayAfter seeing the price action of monday to wednesday, it gave a hint as to what to expect for today. Since i was expecting a consolidation reversal week i knew then that thursday will sweep monday to wednesday and do a reversal for today. Combining it with my multi timeframe analysis from daily to 1H with my entry in the 5m timeframe, i was able to capture this 1:7R trade for today...
For tomorrow my expectation would be an expansion friday candle going down targeting the daily +FVG to complete the ERL to IRL scenario...

Gold trading zones: 03-APRIL-2025Today's Gold trading zones: For educational purposes only. Use at your own risk.

Liberation Day: Fear or greed in the air? We are less than hour out from the Liberation Day tariff announcements. The U.S. is preparing to roll out reciprocal tariffs on all countries, with rates set at 10%, 15%, and 20%, according to Sky News.
Investors hoping for certainty may be disappointed—this could mark the start of a longer phase of trade battles.
Mexico, once again, is reading the room. President Sheinbaum has confirmed Mexico won’t respond with tit-for-tat tariffs. They understand that the way to deal with Trump is to treat him with kid gloves.
Meanwhile, gold hit another record high, reaching $3,149.04 on Tuesday before pulling back a little. Buyers might have a better setup around the parallel pivot line to position for further upside.

GOLD DAILY CHART MID/LONG TERM UPDATEHey Everyone,
This is an update on our daily chart idea that we are now tracking for a while now. If you have only started following us, please read the updates below at the bottom from previous weeks to see how effectively we have been tracking this.
Once again another great day on the markets with our daily chart idea playing out to completion. Yesterday we updated the completion of our 1H chart route map and today we have finally completed this daily chart idea. Our last update we stated that we had the candle body close above 3052 opening 3103 axis target. This was hit perfectly this week completing this chart idea.
We will continue to update our new multi time frame route maps, as usual, with renewed chart ideas on our usual weekly updates.
Thank you all for your likes, comments and follows, we really appreciate it!
Mr Gold
GoldViewFX
OLD UPDATES ON THIS CHART IDEA
MARCH 23RD WEEK UPDAT E
The half line of our unique channel gave the perfect bounce into the next axis target at 2904, inline with our plans to buy dips just like we stated. We now have a body close once again with ema5 cross and lock above 2904 leaving the range above open. We will continue to look for support at the ascending half-line of the channel, as we climb into the range.
PREVIOUS WEEKS UPDATE
After completing our Bullish targets we stated that the channel top will act as resistance confirmed with ema5 rejection. A break of the channel top with ema5 would confirm a continuation and failure would confirm rejection. This allowed us to identify true breakouts against fake outs.
We also stated that we need to keep in mind the channel half line below to establish floor to provide support for the range, should we continue to track further up. A break below the half line will open the lower part of the channel to establish floor on the channel bottom. The safest way to track this movement is by buying dips.
- Once again this played out perfectly as we got the rejection on the channel top followed with the channel half line test, which gave the perfect bounce like we stated. We will now either look for a continuation from this bounce or a cross and lock below the half line for a break into the lower channel floor.

GOLD - on resistance- Could Bitcoin resume its Gains Over GoldAs you can see, GOLD has come to a point where it has been rejected twice previously.
And on each of the previous occasions, PA ended up back on the lower trend line., taking around 2 years to do so on each occasions
GOLD MOVES SO SLOW - mostly due to its HUGE market cap..... But thats another story
Has the recent rise of Gold come to a line of defeat ?
The Daily chart here shows how PA is stalling at this moment in time
Each push is getting Shorter. PA is tired.
PA is Getting OVERBOUGHT on many time frames. It needs a break
The thing is, Mr Trump will later today introduce the "liberation Tariffs"
The expectation is of FEAR as reprisals and reduced markets could cause issues in the USA , including reversing the Drop in inflation.
If the Tariffs backfire, the $ will Drop..and people will look to safe haves
Traditionally GOLD. Maybe Gold can break through its old nemesis of rejection.
But PA Is TIRED
BITCOIN has been under pressure recently, following posting a new ATH and this has taken a toll on the BTC XAUT trading pair while Gold has risen.
We can see how PA dropped and has in fact, fallen below the lower line of support.
But it needs to be understood is that RSI and MACD are now in very positive positions to make a push higher.
Gold is tired
In the Near Future, we may well see the tables turn in Bitcoins Favour again
But Me Trumps, today, May actually upset that idea.
We just have to wait and see how sentiment is towards Risk assets later today , after the announcement of these Tariffs.
But, in the Longer term, once the dust settles, I do see Bitcoin taking over again and continuing its rise to greatness.....
ENJOY
Time Will tell

GOLD (XAUUSD): Detailed Support Resistance Analysis
Here is my latest structure analysis for Gold.
Vertical Structures
Vertical Support 1: Rising trend line
Horizontal Structures:
Resistance 1: 3149 - 3151 area
Support 1: 3099 - 3104 area
Support 2: 3048 - 3057 area
Support 3: 3024 - 3036 area
Support 4: 2997 - 3001 area
Consider these structures for pullback/breakout trading.
❤️Please, support my work with like, thank you!❤️
I am part of Trade Nation's Influencer program and receive a monthly fee for using their TradingView charts in my analysis.

Gold trading zones: 02-APRIL-2025Discover today's Gold trading zones and refine your market analysis skills.
