Gold shows signs of slowing down, are the bears ready?This wave of bullish pull-up is a complete rebound. With the help of the timeliness of fundamentals, the highest rebound only reached around 3330 and then began to fall. At this time, many people probably think that the short-term trend has begun to change. I still stick to my bearish thinking. The important target pressure is definitely around 3330. As long as this position is under pressure and falls back to 3280 again, it will be shaky. At present, the stop loss is based on the break of 3335. If it really breaks, it will be similar to the break of 3280. Even if 3340-3345 is short, it is also a short-term bull correction. If the falling channel is broken, I can't convince myself to continue to be short and stick to it. Once 3335 breaks, I can really confirm the reversal of the short-term trend. Then 3280 will also be the bottom of the medium term. In short, since I am shorting near 3320-3330 in the direction of the band and the short-term negative, I think that the stop loss will be given to 3335. The stop profit target is uncertain. The channel has not been broken. Now the short-term long and short conversions are frequent. It is definitely the best choice in my own trading system. No one will win all the time. It is too fake to win all the time. Make your moves according to your own ideas without regrets. If this wave of strategy verification fails, everyone is welcome to supervise. We dare to take responsibility and review every judgment.
Goldtrading

XAUUSD Analysis todayHello traders, this is a complete multiple timeframe analysis of this pair. We see could find significant trading opportunities as per analysis upon price action confirmation we may take this trade. Smash the like button if you find value in this analysis and drop a comment if you have any questions or let me know which pair to cover in my next analysis.

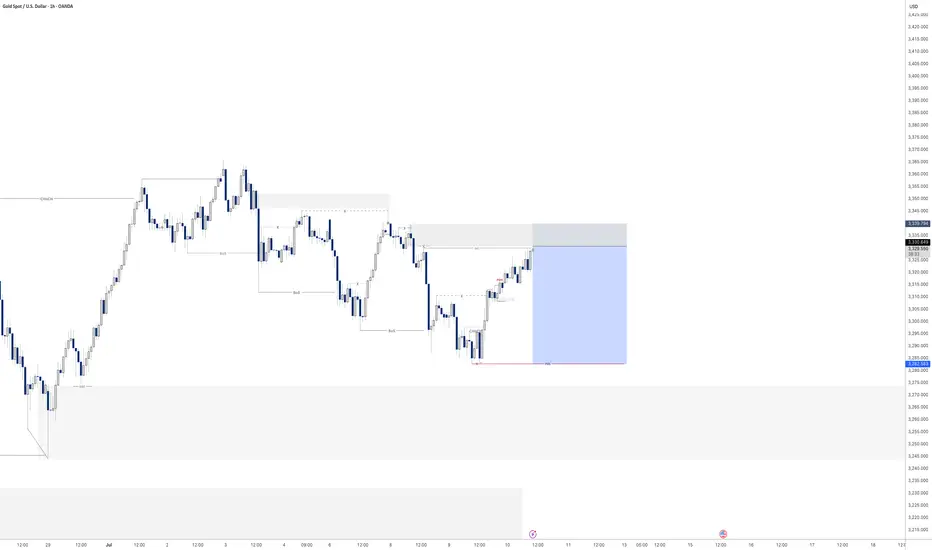
Gold - Sell before longer term buyLooking at gold we are a matter of a few pips away from entry. looking to play gold down till our larger 4H area of demand seeing as we have had a CHoCH to the upside.
There for i will be looking to take my sell position down to 3283.5 at a bare minimum as it was the previous structure level in which we turned around.
Lets see if we get tagged in. If not i will jump down to the lower TF and see if we can get a confirmation that price is going to turn from here.
GOLD (XAUUSD): Important Decision Ahead
As I predicted, Gold went up from a trend line yesterday.
The price is now testing another trend line - a falling resistance
of a bullish flag pattern.
The next reliable bullish signal that you can look for is its
bullish breakout and a daily candle close above that.
A bullish move is going to follow then.
❤️Please, support my work with like, thank you!❤️
I am part of Trade Nation's Influencer program and receive a monthly fee for using their TradingView charts in my analysis.

Gold Bounces Strongly from the Bottom XAUUSD: Gold Bounces Strongly from the Bottom – Is This the Start of a Breakout?
🌍 Macro Overview – Gold’s Movement and Market Sentiment
Gold recently experienced a strong bounce from the 3.282 USD/oz low, reaching 3.317 USD/oz. This movement has sparked some optimism, but let’s take a look at the key macroeconomic factors that might be influencing gold:
📉 US bond yields have decreased, signaling that market risk aversion is returning
💵 The USD remains strong, but buying interest in gold in Asia is increasing as confidence in fiat currencies begins to wane
🇪🇺 The EU is accelerating negotiations with the US on tariffs ahead of the August 1st deadline. If these talks fail, gold could benefit
🏦 The Fed continues to maintain interest rates, but the market is betting on a potential rate cut in September if inflation remains controlled
📊 US unemployment data and the Fed's speech tonight will be key, as the market is anxiously waiting for clues on the Fed’s next move
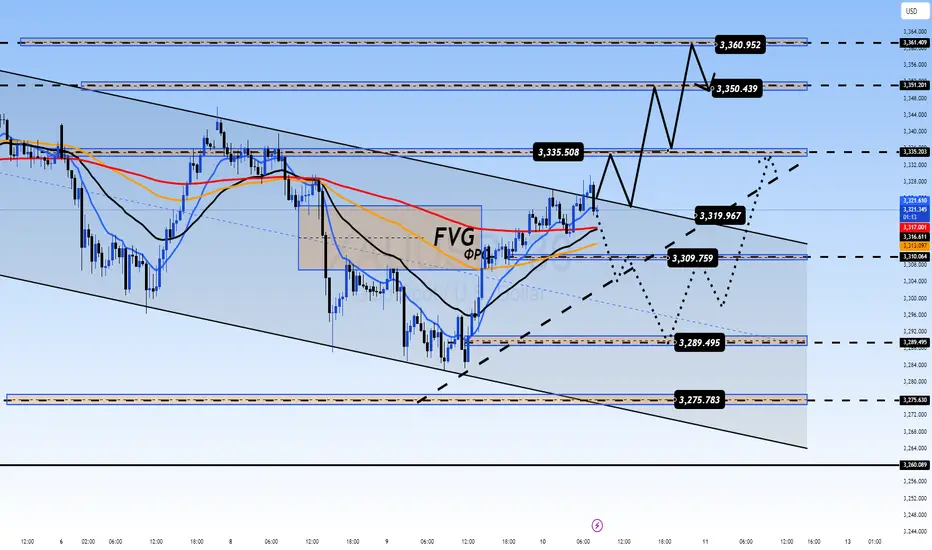
📊 Technical Analysis – Gold Approaching Key Resistance Levels
Gold is trading within a descending channel, but there are clear signs of a potential breakout after testing the lows.
Key resistance levels are found around 3330 – 3340, which will be crucial for determining if gold can continue its upward movement.
The Fair Value Gap (FVG) has appeared between 3310 – 3320, suggesting that if buying pressure continues, a breakout above these levels is likely.
🎯 Trading Strategy for Today – Focused on Clear Entry Points
🟢 BUY SCALP:
Entry: 3310 – 3308
SL: 3304
TP: 3314 → 3318 → 3322 → 3326 → 3330
🔵 BUY ZONE (safer entry points):
Entry: 3290 – 3288
SL: 3284
TP: 3294 → 3298 → 3302 → 3306 → 3310 → 3320 → 3330
🔴 SELL SCALP (if price hits resistance levels):
Entry: 3335 – 3337
SL: 3342
TP: 3330 → 3325 → 3320 → 3315 → 3310 → 3300
⚫ SELL ZONE (strong resistance at 3360-3362):
Entry: 3360 – 3362
SL: 3366
TP: 3356 → 3352 → 3348 → 3344 → 3340 → 3336 → 3330
📌 Note:
Always set SL and TP appropriately to protect your account, especially in a market that might experience significant volatility today.
Watch volume during London and New York sessions to gain clearer insights into market direction. If gold breaks above resistance, a strong breakout could follow.
💬 Gold has bounced back strongly, but is this the start of a larger rally, or just a temporary correction? What’s your take on today’s trend? Share your thoughts in the comments below!
The risks of shorting at low levels have been informed!Today, I have reminded you many times not to chase short positions at low levels. Now you can see that gold has bottomed out and rebounded. We also bought gold in batches at 3285-3295, and the long positions also made perfect profits. I believe that friends who follow my articles can see that I have always emphasized not to short at low levels. It is also obvious to everyone that we bought long positions near 3295-3285. In the future, we will continue to pay attention to the suppression of the upper 3318-3325 line. If the rebound does not break, we will look for opportunities to short. I hope everyone can grasp the entry position and hold the profit. The rebound will first look at the previous break point of the 3325 line, and then short when the rebound is suppressed! If your current gold operation is not ideal, I hope I can help you avoid detours in your investment. Welcome to communicate with me!
From the current analysis of gold trend, today's upper short-term resistance focuses on the hourly top and bottom conversion position of 3318-3325. The intraday rebound relies on this position to go short once and look down. The lower short-term support focuses on 3280. The overall support relies on the 3280-3325 area to maintain the main tone of high-altitude low-multiple cycles. In the mid-line position, keep watching and do less, be cautious in chasing orders, and wait for the opportunity to enter the market after the key points are in place.
Gold operation strategy: short gold rebounds near 3318-3325, target 3305-3295.

GOLD ROUTE MAP UPDATEHey Everyone,
Absolutely beautiful to see our 1h chart idea playing out perfectly. After completing the bearish targets earlier this week, we had the ema5 cross and lock below 3306 opening the swing range.
- This played out perfectly hitting the first swing range level and doing exactly what it say son the tin giving the full swing into 3306 just like we highlighted.
We will now look for ema5 lock above 3306 for a continuation into the bullish targets above or failure to lock will see rejections into the lower Goldturns for suport and bounce.
If it continues to fail breakout above, into the first Bullish target, then we are likely to see the full swing range tested on the rejections.
We will keep the above in mind when taking buys from dips. Our updated levels and weighted levels will allow us to track the movement down and then catch bounces up.
We will continue to buy dips using our support levels taking 20 to 40 pips. As stated before each of our level structures give 20 to 40 pip bounces, which is enough for a nice entry and exit. If you back test the levels we shared every week for the past 24 months, you can see how effectively they were used to trade with or against short/mid term swings and trends.
The swing range give bigger bounces then our weighted levels that's the difference between weighted levels and swing ranges.
BULLISH TARGET
3358
EMA5 CROSS AND LOCK ABOVE 3358 WILL OPEN THE FOLLOWING BULLISH TARGETS
3389
EMA5 CROSS AND LOCK ABOVE 3389 WILL OPEN THE FOLLOWING BULLISH TARGET
3416
EMA5 CROSS AND LOCK ABOVE 3416 WILL OPEN THE FOLLOWING BULLISH TARGET
3439
BEARISH TARGETS
3330 - DONE
EMA5 CROSS AND LOCK BELOW 3330 WILL OPEN THE FOLLOWING BEARISH TARGET
3306 - DONE
EMA5 CROSS AND LOCK BELOW 3306 WILL OPEN THE SWING RANGE
3283 - DONE
3254
As always, we will keep you all updated with regular updates throughout the week and how we manage the active ideas and setups. Thank you all for your likes, comments and follows, we really appreciate it!
Mr Gold
GoldViewFX

Technical analysis guide for gold in the US market!Technical aspects:
The gold daily chart shows an obvious shock consolidation structure, and is currently running between the middle and lower tracks of the Bollinger Bands, with an overall weak trend. Since hitting a high of $3499.83, the market has fallen into a sideways consolidation range, with top resistance concentrated in the $3400-3450 range and bottom support at $3250. The recent price retracement to around 3250 failed to effectively break below, forming an important support level.
The MACD indicator crossover continues, the green column is enlarged, the double lines are downward, and the momentum is weak. The RSI indicator runs around 44, and does not show oversold or rebound signals. The price is still in a weak consolidation stage. Analysts believe that if it falls below the 3250 line, it may open up further correction space, and pay attention to the 3170 area support; on the upside, if it can effectively stand above 3400, it is expected to retest the 3450 line high.

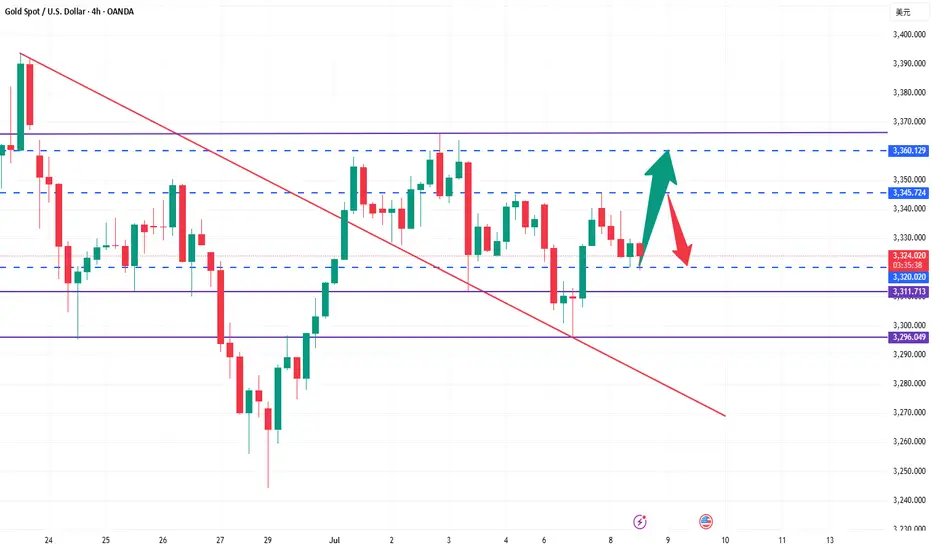
GOLD (XAUUSD): Time to Recover?!
Gold reached an important rising trend line on a daily.
I see 2 nice intraday bullish reactions to that on a 4H time frame
and a double bottom pattern formation.
Its neckline breakout and a 4H candle close above 3309
will confirm a start of a bullish correctional movement.
Goal will be 3327.
Alternatively, a bearish breakout of the trend line will push
the prices lower.
❤️Please, support my work with like, thank you!❤️
I am part of Trade Nation's Influencer program and receive a monthly fee for using their TradingView charts in my analysis.

Gold lures shorts, mainly depending on the rebound.On Monday, the gold market rebounded. The root cause was that Trump sent tariff letters to 14 countries at one time. Even allies such as Japan and South Korea were not spared and were subject to high tariffs of 25% to 40%. This "extreme pressure" trade method instantly ignited the market's risk aversion sentiment. Funds poured into gold, pushing up gold prices. The market quickly saw through the "routine". On Tuesday, Trump extended the tariff deadline from July 9 to August 1. This delay was seen as a signal of "surrendering" under trade pressure, and trade tensions were eased. The safe-haven demand dissipated like a receding tide, and gold was sold off violently, plummeting by $35 in a single day, a drop of more than 1%, and the lowest fell to $3,287.2 per ounce.
On Tuesday, the price of gold showed a trend of rising and falling. It reached a high of 3245 in the morning and then gradually fell. It fell to 3287 and then stopped falling and rebounded. As it failed to break through the key resistance level of 3345 and the price continued to be unable to stand firm on the middle track, the bulls' rebound momentum was insufficient. Yesterday's daily line closed with a large Yin line in the engulfing pattern. This K-line combination indicates that the gold price may continue to fall today. The focus below is on the support strength near the lower track 3280. The upper resistance level needs to pay attention to the 3320-3330 range. Today's daily closing is crucial. If the real big Yin line continues to close, it may drive the Bollinger Band to open downward and further open up the downward space; if the closing can stand above 3330, the short-term downward trend may end and the market is expected to restart the rise. From the weekly perspective, the gold price showed an obvious oscillation pattern this week. After rising on Monday, it fell back on Tuesday. The bulls and bears fought fiercely but failed to gain a decisive advantage. Although the current market is weak, the price is close to the important support area. In terms of operations, it is recommended that under the premise of controlling risks, you can now pay attention to the opportunities to buy on dips in the 3295-3285 area.

Gold price drops to 3250Today's daily line is in the negative, rebounding in the morning, and the high point yesterday morning was 3310, and the bearish point is also at this point. It is higher than the 382 line of yesterday's decline and rebound, 3307. After the morning rebound, the current decline formed a morning downward trend. The watershed is 3308-10, today's short stop loss position. The market fell in the morning, and the strength of the rebound should not be strong. The top and bottom conversion position is 3297-98. The European session broke the bottom, and the US session continued to fall. The next double bottom support is around 3275. If the rebound is in place, it is still bearish, and the decline continues. 3258-60 line.

The Federal Reserve meeting is the highlightAfter the gold price surged in the morning yesterday, it started the shock-washing mode. In the evening, the price broke through the expected range, fell below the key support of 3297, and continued to fall to the 3287 line. This trend directly destroyed the rising structure of the right shoulder in the 4-hour head and shoulders bottom pattern. The daily line finally closed in the negative, suggesting that the short-term market has signs of weakening. At present, gold has gradually left the previous shock range, and the K line is suppressed by the short-term moving average, and the weak trend is obvious. At the daily level, it is necessary to pay attention to whether there will be a second decline after the rebound is confirmed. On the 4-hour chart, although the price fluctuates in a narrow range, the rebound strength and continuity are insufficient, and the short-term decline space may not be fully released. At present, the upper resistance is 3300-3307, and the lower support is 3280-3277. It is recommended to do more on the callback and rebound high as a supplement.

Hold more than 3320 gold orders and wait patiently for the riseWe arranged a long order at 3320. Obviously, the market has given us an opportunity. After entering the long order, we should set a stop loss and wait patiently for the profit to be released. This is what we have to do, so there is no other idea and we are still bullish.
The current market has a clear rhythm, and the support is effective. In the short term, it is still a bullish structure. The structure is not broken and the direction remains unchanged. We will continue to advance the trading rhythm as planned.
🔸 Hold long orders near 3320, and the stop profit is 3335-3345 unchanged.
🔸 Strictly implement the trading plan, keep a stable rhythm, and wait for the market to realize the space.
Trade within the plan, rhythm first, keep an eye on the key points, and leave the rest to the market.
Follow up before the Fed minutesGold, the price fell from the historical high of 3500 to 3120 in the first round this year, and is now in the second round of downward cycle after rising to 3452. The mid-term top idea is maintained, and the operating target is 3120; after bottoming out and rebounding to 3345 on Monday, it did not continue on Tuesday, and fell to 3287 in a weak position; the daily chart recorded a real big Yin, and the K-line combination was short-term, and the bearish trend continued during the day, and attention was paid to the impact of the Federal Reserve's monetary policy minutes on Thursday morning;
Opening at 3301, short-term resistance at 3308-3310 during the Asian session, strong resistance at 3315 and daily chart MA5-3320, the limit rebound is not more than here; short-term support at 3293, strong support at 3287, and the previous parallel low at 3247 is expected to be seen if it breaks;

GOLD 4H CHART ROUTE MAP UPDATEHey Everyone,
Please see update on our 4H Chart route map, also playing out perfectly with our levels being respected, as analysed.
We have our bearish target hit at 3295 and currently testing for support and bounce. Ema5 cross and lock below this level will open the swing range and failure to lock will see price reject and head up for the Bullish target. The 1h chart route map from yesterdays update also has the swing range open, which we need to keep in mind when planning to buy dips.
We will keep the above in mind when taking buys from dips. Our updated levels and weighted levels will allow us to track the movement down and then catch bounces up.
We will continue to buy dips using our support levels taking 20 to 40 pips. As stated before each of our level structures give 20 to 40 pip bounces, which is enough for a nice entry and exit. If you back test the levels we shared every week for the past 24 months, you can see how effectively they were used to trade with or against short/mid term swings and trends.
The swing range give bigger bounces then our weighted levels that's the difference between weighted levels and swing ranges.
BULLISH TARGET
3364
EMA5 CROSS AND LOCK ABOVE 3364 WILL OPEN THE FOLLOWING BULLISH TARGETS
3429
EMA5 CROSS AND LOCK ABOVE 3429 WILL OPEN THE FOLLOWING BULLISH TARGET
3499
EMA5 CROSS AND LOCK ABOVE 3429 WILL OPEN THE FOLLOWING BULLISH TARGET
3499
EMA5 CROSS AND LOCK ABOVE 3499 WILL OPEN THE FOLLOWING BULLISH TARGET
3561
BEARISH TARGETS
3295 - DONE
EMA5 CROSS AND LOCK BELOW 3295 WILL OPEN THE SWING RANGE
3242
3171
EMA5 CROSS AND LOCK BELOW 3171 WILL OPEN THE SECONDARY SWING RANGE
3089
3001
As always, we will keep you all updated with regular updates throughout the week and how we manage the active ideas and setups. Thank you all for your likes, comments and follows, we really appreciate it!
Mr Gold
GoldViewFX

After repeated tug-of-war, where will gold go?At present, the gold market is divided between long and short positions. The Federal Reserve may maintain high interest rates, which weakens the investment appeal of gold; however, trade frictions and geopolitical risks provide safe-haven support for gold. Overall, market sentiment is mixed, with bulls lacking confidence, but bears have not been able to fully control the situation. Last week's strong non-farm data reduced market expectations for a rate cut in July, pushing up U.S. bond yields and the dollar, putting pressure on gold, which does not generate interest. In addition, Trump said on social media that he would impose a 10% tariff on countries that "support anti-U.S. policies." The market is waiting for the release of the minutes of the Fed's June meeting, which will more clearly show policymakers' views on the current economic situation and future policies, and may determine the direction of interest rates. If the minutes show that the Fed is inclined to maintain high interest rates for a longer period of time, gold prices may continue to face downward pressure.
From a technical perspective, gold was under pressure at a high level at the opening, so gold is expected to fall today. Today's key pressure level is 3345. Before the price effectively breaks through and stabilizes at 3345, any rebound is a short-selling opportunity; once it stabilizes at 3345, the bottom pattern is confirmed to be established, and the bulls will start an upward market. At this time, the short-selling idea should be abandoned. From a technical point of view, the 1-hour chart has shown a trend from weak to strong, and the Bollinger Bands are opening and diverging upward, indicating that the market may accelerate upward. Today's operation suggestion is to focus on low-long and high-short as a supplement. In terms of specific points, the lower support is 3327-3320, and the upper resistance is 3355-3360.
Operation strategy:
1. It is recommended to buy gold when it rebounds to around 3327-3320, with the target at 3340-3350.
2. It is recommended to sell gold when it rebounds to around 3345-3355, with the target at 3330-3320.

Gold price falls today and then looks bullish!Today, gold rose and fell back to 3345, which was the high point on Friday. It was suppressed and fell sideways.
From a technical point of view, the US market rose yesterday, and today's decline must continue to be bullish, but the position should not be too high or too low; if it is too high, there may be further decline, and if it is too low, there may be no reach.
The bullish position should be in line with the overall running rhythm of gold. Personally, I suggest that you can buy around 3320-3321, defend 3310, and target 3340-3345.
Focus on the rise of the European market. If the European market breaks through 3345 strongly, then you can continue to be bullish to 3360-3365; if the European market is always suppressed below 3345 and goes sideways, there is no performance, so you should consider selling, or there may be further retracement.
Put your thoughts in the comments section

XAUUSD Analysis todayHello traders, this is a complete multiple timeframe analysis of this pair. We see could find significant trading opportunities as per analysis upon price action confirmation we may take this trade. Smash the like button if you find value in this analysis and drop a comment if you have any questions or let me know which pair to cover in my next analysis.

A Buying Opportunity or Sign of a Bigger Correction?Gold Breaks Below 3300 – A Buying Opportunity or Sign of a Bigger Correction?
🧭 Market Update: Is the Sell-off Truly Dangerous?
Gold saw a surprising reversal at the close of the US session yesterday after a sharp decline targeting the 329x liquidity zone, followed by a strong buying momentum that pushed the price back above this level.
After testing the liquidity zone below 3300, significant buying volumes emerged at this price point, pushing the price back up. However, the market is still undecided about whether the bulls or bears will dominate at this stage. We are currently in an accumulation phase, with liquidity sweeps occurring at both the highs and lows, meaning traders should exercise caution and look for scalping points for appropriate entry and exit.
Short-Term Outlook: Buy Bias Dominates Today
In the short term, the buy bias appears stronger compared to yesterday. Focus on buying early at continuation patterns to capture the market's movement. The D1 candle from yesterday formed a wick rejection, showing that selling pressure has been absorbed and the buying momentum has returned in the short term. Therefore, be proactive and look for early buy opportunities.
In the M30 timeframe, there is a solid continuation pattern forming in the 16-14 zone, which could serve as a good entry point today. If the price continues to drop, we’ll wait for a retest of the previous bottom at 03-00, and monitor for any strong downward momentum to confirm if the bearish trend will continue. On the other hand, if you’re considering sell positions, proceed with caution. As mentioned with the D1 wick rejection, the SELL pressure may have been absorbed, and BUY momentum could take over in the coming days. Avoid rushing into sell positions.
Key Support & Resistance Levels:
Key Resistance: 3342 – 3353 – 3362 – 3381
Key Support: 3330 – 3314 – 3303 – 3295
Scalping Opportunities and Buy Zones:
BUY SCALP:
3316 – 3314
Stop Loss: 3310
Take Profit: 3320 → 3325 → 3330 → 3335 → 3340 → 3350
BUY ZONE:
3303 – 3301
Stop Loss: 3297
Take Profit: 3306 → 3310 → 3315 → 3320 → 3330 → 3340 → ????
Sell Opportunities and Caution on Bears:
SELL SCALP:
3362 – 3364
Stop Loss: 3368
Take Profit: 3358 → 3354 → 3350 → 3345 → 3340 → 3330
SELL ZONE:
3380 – 3382
Stop Loss: 3386
Take Profit: 3376 → 3372 → 3368 → 3364 → 3360 → 3350
Key Takeaway:
We are at a critical stage where both bulls and bears are vying for control. Will gold bounce from the support and continue its bullish trend, or will the sellers regain control and drag prices lower? Be patient and wait for clear price action signals before entering any trades.
The market is currently in an accumulation phase, so avoid rushing into decisions. Focus on buying when clear confirmations appear at support zones and stay alert for sell rejections at key resistance levels.
Good luck with your trades!
💬 What’s Your View on Gold Today?
Do you believe gold is set to break 3390 and continue its bullish momentum?
Or are we looking at a deeper correction towards 3270 in the coming days?
👇 Share your analysis and thoughts in the comments below! We’d love to hear your take on where gold is headed next!

Seize the correction: It’s the right time to short goldThe current rebound is only a technical adjustment rather than a trend reversal. The rebound in the falling market is a good opportunity to arrange short orders. The hourly chart shows that the moving average pressure continues to move down to around 3340-3345. This position also serves as the long-short watershed in the previous intensive trading area, forming a key resistance barrier. If the gold price rebounds and approaches the area below 3345 and a stagflation signal appears or a top structure is formed, it can be regarded as a clear short signal. It is recommended to enter the market to seize the downward space. The current market direction is clear, and the exhaustion of the rebound is the best time to enter the market. Relying on the technical pressure level, the short position can be accurately arranged.

Gold fluctuates repeatedly, how to seize the opportunityIf the direction is right, you are not afraid of the long journey. Use time to witness your strength, use your strength to win the future, let trust become profit, and use profit to resolve doubts. The market is changing rapidly, and going with the trend is the kingly way. When the trend comes, just do it, don't go against the trend to buy at the bottom, so as not to suffer. Remember not to act on impulse when trading. The market is good for all kinds of dissatisfaction, so you must not hold orders. I believe many people have experienced this. The more you resist, the more panic you will feel, and the floating losses will continue to magnify, making you eat and sleep poorly, and you will miss many opportunities in vain. If you also have these troubles, then you might as well follow my pace and try to see if it can make you suddenly enlightened.
Gold is concerned about the short-term pressure of the 3316 line above, and focuses on the pressure of the 3325 line. If the pressure above the 3325 line is not broken, then the possibility of gold further breaking through the lower space to 3295-3300 in the short term will also increase significantly. Therefore, the main line of gold operation is still based on holding shorts and rebounding shorts. Gold can rebound to the 3316 line and 3325 line before considering participating in short shorts. In terms of operation, we first pay attention to the support of the 3295-3300 line. If the lower support is broken today, the market will reverse to the short side. Otherwise, we will continue to rebound from the bottom and look for opportunities to go long.
From the current trend of gold, pay attention to the support of the 3300-3295 line below, the short-term resistance above pays attention to the vicinity of 3316, and focus on the suppression of the line near 3325. The overall main tone of high-altitude low-multiple cycle participation remains unchanged. In the mid-line position, keep watching and do less, follow orders cautiously, keep the main tone of participating in the trend, and patiently wait for key points to participate.
Gold operation strategy:
1. Go long on gold around 3330-3295, target 3315-3320.
2. Go short on gold around 3315-3325, target 3305-3300.

GOLD ROUTE MAP UPDATEHey Everyone,
Great start to the week with our levels being respected inline with our plans to buy dips.
We started the week with our bearish target 3330 being hit followed with ema5 cross and lock opening 3306 inline with the retracement range. This was hit perfectly completing the retracement range, followed with the weighted level bounce now heading towards 3330.
We still have the market opening bullish gap left at 3358 and will need a challenge and ema5 lock above 3330 to re-confirm this again.
We will keep the above in mind when taking buys from dips. Our updated levels and weighted levels will allow us to track the movement down and then catch bounces up.
We will continue to buy dips using our support levels taking 20 to 40 pips. As stated before each of our level structures give 20 to 40 pip bounces, which is enough for a nice entry and exit. If you back test the levels we shared every week for the past 24 months, you can see how effectively they were used to trade with or against short/mid term swings and trends.
The swing range give bigger bounces then our weighted levels that's the difference between weighted levels and swing ranges.
BULLISH TARGET
3358
EMA5 CROSS AND LOCK ABOVE 3358 WILL OPEN THE FOLLOWING BULLISH TARGETS
3389
EMA5 CROSS AND LOCK ABOVE 3389 WILL OPEN THE FOLLOWING BULLISH TARGET
3416
EMA5 CROSS AND LOCK ABOVE 3416 WILL OPEN THE FOLLOWING BULLISH TARGET
3439
BEARISH TARGETS
3330 - DONE
EMA5 CROSS AND LOCK BELOW 3330 WILL OPEN THE FOLLOWING BEARISH TARGET
3306 - DONE
EMA5 CROSS AND LOCK BELOW 3306 WILL OPEN THE SWING RANGE
3283
3254
As always, we will keep you all updated with regular updates throughout the week and how we manage the active ideas and setups. Thank you all for your likes, comments and follows, we really appreciate it!
Mr Gold
GoldViewFX

Firmly bearish below 3350 once again verifies the perfect idea!Gold price rose rapidly at the opening, reaching a high of 3342 before falling back. This kind of rapid pull needs special attention, because from the perspective of short-term trading, this is the trend pattern that needs the most vigilance. Looking back at the trend last Thursday, there was also a situation where the high could not be continued. Historical data shows that this kind of pull-up often lacks sustained momentum, and the subsequent upward space is limited. Combined with the recent trend, although the price rebounded on Monday and Tuesday, it basically maintained a volatile pattern in the following trading days, but the fluctuation range changed. Therefore, the market expects the trend to be repeated in stages, and the information of long and short interweaving makes it difficult for the market trend to continue. Today, the short position digested the second time at the opening and currently stepped back to the lowest 3305 line. In terms of operation, we first pay attention to the situation of 3303-3293. If the support below is broken today, then the market will reverse to the short position. Otherwise, we will continue to rebound from the bottom and look for opportunities to do more.
From the current gold trend analysis, the support line of 3303-3293 is concerned below, the short-term resistance above is concerned about 3325-3330, and the suppression line of 3345-50 is focused on. The overall main tone of high-altitude low-multiple cycle participation remains unchanged. In the mid-line position, keep watching and do less, follow orders cautiously, and wait for the opportunity to enter the market after the key points are in place.
Gold operation strategy:
1. Go long near 3293-3303 for gold, and the target is 3315-3320.
2. Go short near 3320-3330 for gold, and the target is 3310-3300.
