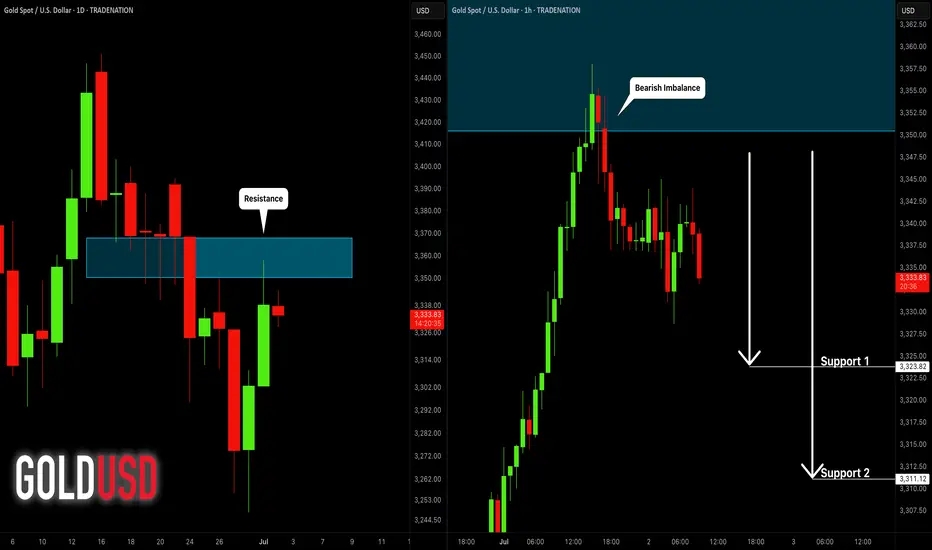
GOLD (XAUUSD): Bearish Move From Resistance
Gold went overbought after a test of a key daily resistance cluster.
A formation of multiple bearish imbalance candles on an hourly time frame
signifies a local dominance of the sellers.
The price will continue retracing at least to 3323 support.
❤️Please, support my work with like, thank you!❤️
I am part of Trade Nation's Influencer program and receive a monthly fee for using their TradingView charts in my analysis.
Goldtrading
XAU bearish and bullish setup for next week
Still XAU making HH and HL
It has to retrace before going for another HH
Seasonal analysis showing same previous 5 year data
XAU Bearish from 23 Feb to 2 Mar then Bullish from 3 Mar - 20 Apr
So, instead of this week retracement and consolidation
I look for trade bullish trade next week.

Short-term opportunities are imminent.Gold prices have continued to rebound recently and have reached around 3358, but there is a lack of effective retracement during the rise, and the risk of short-term chasing has increased significantly. From a technical perspective, the US dollar index has a demand for a corrective rebound after a rapid decline, and it is expected to form a significant suppression on gold in the short term, limiting the rebound space of gold prices. From a capital perspective, the previous high-level long chips have gradually been untied and started to leave the market with profits, and selling pressure has gradually emerged; short positions may be re-arranged after completing concentrated stop losses, and the market structure is quietly changing.
Based on the above factors, it is recommended that traders remain patient and continue to hold short positions, focusing on the support of the 3335-3325 area. Be sure to control your position during the operation, strictly set stop losses, and avoid the high risks brought by chasing the rise. The core of trading is to follow the trend, respect the market rhythm, and wait for the adjustment to be confirmed before intervening.
Steady trading can only make long-term profits. Welcome everyone to share and communicate to improve the operation level together.

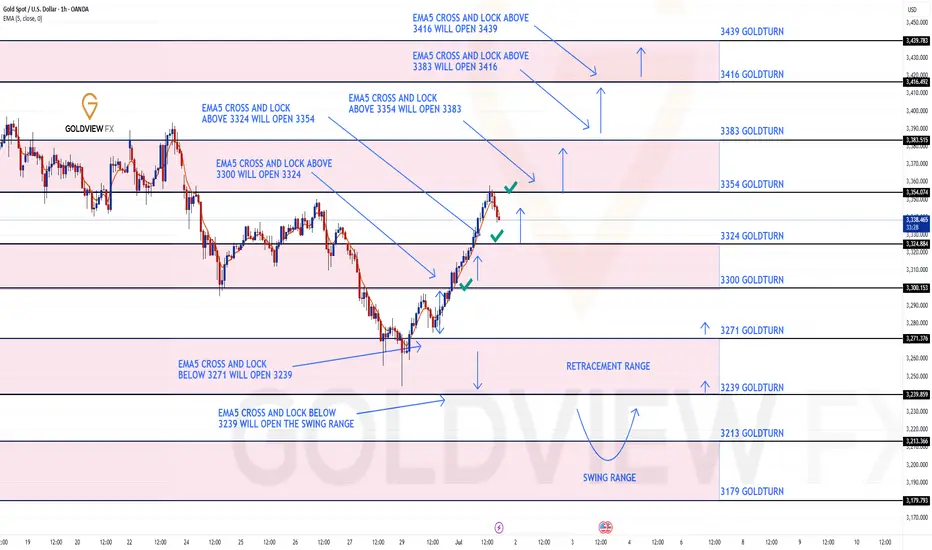
GOLD ROUTE MAP UPDATEHey Everyone,
Another PIPTASTIC day on the charts today with our analysis playing out to perfection!!!
After hitting 3300 target yesterday, we stated that we would now look for ema5 cross and lock above 3300 to open 3324. This was locked and loaded and we got the target hit at 3324. This followed with a further ema5 cross and lock above 3324 opening 3354, which was also hit perfectly completing this range.
We are now seeing a perfect rejection from this level and unless we get a ema5 cross and lock above this level for a continuation, we are likely to see the lower Goldturns tested for support and bounce.
We will keep the above in mind when taking buys from dips. Our updated levels and weighted levels will allow us to track the movement down and then catch bounces up.
We will continue to buy dips using our support levels taking 20 to 40 pips. As stated before each of our level structures give 20 to 40 pip bounces, which is enough for a nice entry and exit. If you back test the levels we shared every week for the past 24 months, you can see how effectively they were used to trade with or against short/mid term swings and trends.
The swing range give bigger bounces then our weighted levels that's the difference between weighted levels and swing ranges.
BULLISH TARGET
3300 - DONE
EMA5 CROSS AND LOCK ABOVE 3300 WILL OPEN THE FOLLOWING BULLISH TARGETS
3324 - DONE
EMA5 CROSS AND LOCK ABOVE 3324 WILL OPEN THE FOLLOWING BULLISH TARGET
3354 - DONE
EMA5 CROSS AND LOCK ABOVE 3354 WILL OPEN THE FOLLOWING BULLISH TARGET
3383
BEARISH TARGETS
3271
EMA5 CROSS AND LOCK BELOW 3354 WILL OPEN THE FOLLOWING BEARISH TARGET
3239
EMA5 CROSS AND LOCK BELOW 3239 WILL OPEN THE SWING RANGE
3213
3179
As always, we will keep you all updated with regular updates throughout the week and how we manage the active ideas and setups. Thank you all for your likes, comments and follows, we really appreciate it!
Mr Gold
GoldViewFX
GoldFxMinds XAUUSD Daily Sniper Plan – July 1🌅 Good morning, gold hunters!
The start of a new month is here, and price action is as wild as ever! Yesterday’s liquidity raids swept both sides, leaving most traders guessing – but structure never lies. Let’s break down exactly where the real money sits for July 1, so you never get caught on the wrong side of gold.
🌎 Macro, News & Geopolitics
Macro: US data is in focus (ISM PMI, JOLTS, Powell speech), keeping volatility high and liquidity pools exposed.
Geopolitics: Tensions persist globally but no fresh headlines – market is pure price-driven.
Sentiment: Bulls got trapped high, sellers are hungry for a deeper sweep. Don’t trust easy breakouts!
🏛️ HTF Bias Recap
Weekly: Bullish structure, but overextended. Pullback zones active, buyers get best deals only at true discount.
Daily: Strong wick rejections at supply, sellers showing teeth. Watch for lower highs and failed breakouts.
H4: Range between 3332 and 3258, liquidity building at both edges. Smart money will hunt stops before any trend is real!
🔑 H4 Key Structural Levels
Premium Supply: 3320–3332 (main unmitigated supply block)
Mid Range Decision: 3296–3306 (watch for PA shift, don’t force entries here)
Discount Demand: 3272–3258 (clean OB/imbalance confluence)
Deep Discount Demand: 3232–3218 (ultimate liquidity pocket)
🎯 Sniper Zones (M30/M15 Refined)
SELL Zones:
3320–3332:
The untouched supply – only sell if PA prints a reversal after a NY liquidity grab. Don’t jump in early!
3345–3360:
Extreme extension zone. If price overreaches, look for signs of exhaustion. This is the bear’s last stand!
BUY Zones:
3272–3258:
True discount! Wait for a stop run below 3275, then catch the bounce ONLY if you see confirmation (engulfing, CHoCH, RSI support).
3232–3218:
No hope trades here. Only for flash crash or panic sell-offs with obvious absorption! Wait for a real PA reversal.
Decision Zone:
3296–3306
If price is stuck here, sit on your hands! Let the market show its hand first.
🚦 Quick Recap
Avoid already-mitigated zones – only hunt where liquidity is fresh!
NY session wicks and fake breakouts are the biggest traps. Be patient, let the stop hunt finish before you engage.
Confirmation over prediction. Discipline is your edge, not drawing boxes.
🎁 Bonus Tip
"Missing a sniper entry? The best traders never chase. Let gold come to you. There’s always a second chance for those with patience!"
📣 Like what you see?
Smash that like🚀🚀🚀 , drop your thoughts in the comments , and don’t forget to follow GoldFxMinds for more high-precision gold plans!
Analysis powered by Trade Nation chart feed – built for the sharpest minds in gold.

The bearish trend is confirmed, it’s time to participate.Gold overnight short orders have been stopped at a loss, because it broke through the key pressure of 3325. However, we must grasp the trend of the market, adhere to the idea of technical analysis as the main and news as the auxiliary, and make a comprehensive judgment. Don't be at a loss about the market analysis because of the stop loss. There is nothing wrong with waiting for the market to step back and do more, but the market does not give opportunities, but forces you to chase the rise. Of course, from the perspective of risk ratio, high altitude is definitely more stable than chasing more.
From the current gold trend analysis, the focus on the upper side is the 3340-3350 line of pressure, the short-term support on the lower side is around 3310-3320, and the key support on the 3295-3301 line is focused. Relying on this range as a whole, the main tone of high-altitude and low-multiple participation remains unchanged. In the middle position, it is recommended to wait and see, chase orders cautiously, and wait patiently for key points to enter the market.
Operation strategy 1: Short gold near 3340-3350, target 3325-3315.
Operation strategy 2: Go long on gold around 3310-3320, target 3330-3340.

Gold prices are gathering momentumThe key position of the four-hour gold chart dominates the short-term rhythm. At present, the 3300 resistance has completed the transformation to support, and the price remains stable above this position to maintain a short-term bullish pattern. The hourly chart shows that after a strong overnight close, the previous high has been broken in the morning session today. The gold price is expected to continue the offensive and test the core resistance area of 3360 at the daily level. The operation strategy is mainly to do more on the callback, focusing on the pressure performance after the price is above 3360. If a reversal K-line pattern appears, a short position can be arranged. Losing the 3300 support indicates the risk of a trend reversal. Focus on the two-way breakthrough signal of the 3300 support band and the 3360 resistance range during the day

7.2 Gold bulls continue to rise, bears come to an end temporarilFrom the 4-hour analysis, the upper focus is on the 3345 line of suppression, the lower short-term support focuses on the 3314-3316 line, and the key support of 3295-3301 line is focused on. The overall support is based on this range to maintain the main tone of low-multiple participation. In the middle position, watch more and do less, be cautious in chasing orders, and wait patiently for key points to enter the market.
Gold operation strategy:
1. Gold 3316-24 line long, retrace to 3295-3303 line to add more positions, stop loss 3293, target 3340-45 line, continue to hold if broken;

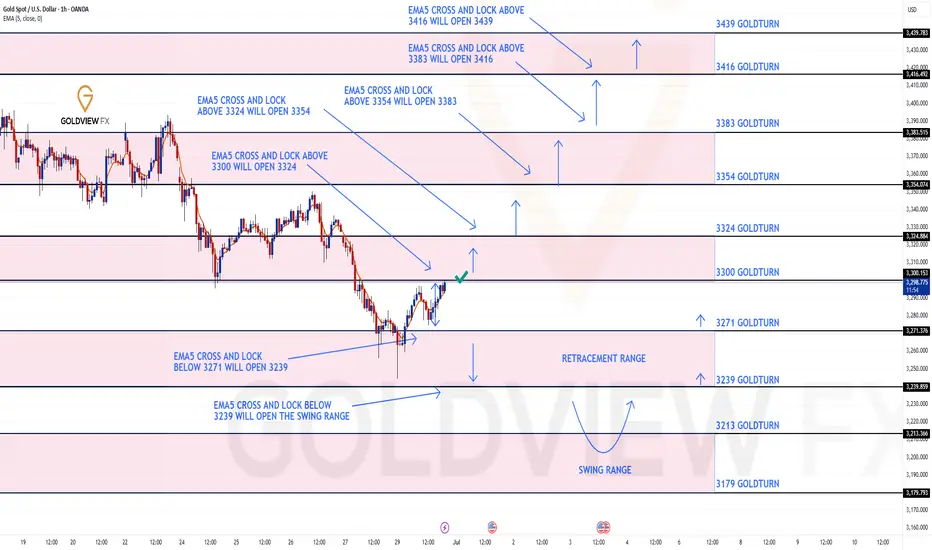
GOLD ROUTE MAP UPDATEHey Everyone,
Great start to the week with our Bullish target at 3300 hit perfectly!!!!
We will now look for ema5 cross and lock to confirm a continuation or failure to lock will follow with a rejection into the lower Goldturns for support and bounce.
We will see levels tested side by side until one of the weighted levels break and lock to confirm direction for the next range.
We will keep the above in mind when taking buys from dips. Our updated levels and weighted levels will allow us to track the movement down and then catch bounces up.
We will continue to buy dips using our support levels taking 20 to 40 pips. As stated before each of our level structures give 20 to 40 pip bounces, which is enough for a nice entry and exit. If you back test the levels we shared every week for the past 24 months, you can see how effectively they were used to trade with or against short/mid term swings and trends.
The swing range give bigger bounces then our weighted levels that's the difference between weighted levels and swing ranges.
BULLISH TARGET
3300 - DONE
EMA5 CROSS AND LOCK ABOVE 3300 WILL OPEN THE FOLLOWING BULLISH TARGETS
3324
EMA5 CROSS AND LOCK ABOVE 3324 WILL OPEN THE FOLLOWING BULLISH TARGET
3354
EMA5 CROSS AND LOCK ABOVE 3354 WILL OPEN THE FOLLOWING BULLISH TARGET
3383
BEARISH TARGETS
3271
EMA5 CROSS AND LOCK BELOW 3354 WILL OPEN THE FOLLOWING BEARISH TARGET
3239
EMA5 CROSS AND LOCK BELOW 3239 WILL OPEN THE SWING RANGE
3213
3179
As always, we will keep you all updated with regular updates throughout the week and how we manage the active ideas and setups. Thank you all for your likes, comments and follows, we really appreciate it!
Mr Gold
GoldViewFX
Seize the opportunity to short gold!Last week, we mentioned that if gold continues to fall, it will go to around 3245-3250. This position is 618 of the retracement from 3120 to 3450, and it is also the previous rising point. After the opening, it tested this position as expected and rebounded. If it continues to break down, it will gradually go to around 3225 and 3204. Last Friday, it opened weak and eventually fell to 3255. Although it rebounded at the end of the session, it was not enough to change the weak pattern. Today, we will focus on the rebound strength. The pressure is at 3291 and 3301. Short according to the rebound strength, and look at the 3245 support below. If it does not break, consider going long.
Gold operation suggestion: short around 3291-3001, target 3370-3360.

The rebound short-selling trend remains unchangedFrom the 4-hour analysis, the upper short-term resistance is around 3297-3301, and the pressure at 3315-3316 is paid attention to. The pressure at 3324 is focused on. In terms of operation, the rebound continues to be the main short and the trend is downward. The short-term support below is around 3250-3255. The overall main tone of high-altitude participation remains unchanged relying on this range.

GOLD Price Analysis: Key Insights for Next Week Trading DecisionIn this video, I break down last week’s gold price action and give you a detailed outlook for the week ahead. With gold closing around $3,260 and major macroeconomic shifts unfolding—including the Israel-Iran ceasefire talks, rising US dollar strength, and concerns over the US Q1 GDP contraction, we are at a turning point.
📉 Will weakening economic data force the Fed to pivot?
📈 Could this create a fresh bullish wave for gold?
Or will stronger job numbers and inflation data drag gold lower?
✅ What you’ll learn in this video:
✅Key fundamental drivers affecting gold (XAU/USD)
✅Important economic events to watch (Fed Chair speech, NFP, ISM)
✅My technical analysis of gold price levels to watch
✅How to read the current market sentiment like a pro
✅Strategic trading zones for bulls and bears
🔔 Don’t forget to like the video in support of this work.
Disclaimer:
Based on experience and what I see on the charts, this is my take. It’s not financial advice—always do your research and consult a licensed advisor before trading.
#xauusd, #goldprice, #goldanalysis, #goldforecast, #goldtrading, #xauusdanalysis, #technicalanalysis, #fundamentalanalysis, #forextrading, #forexmentor, #nfpweek, #goldoutlook, #tradingstrategy, #chartanalysis, #julyforecast, #fedwatch, #priceaction, #traderinsights, #commoditytrading, #marketbreakdown, #xauusdforecast, #tradethefundamentals, #smartmoneytrading

GOLD 4H CHART ROUTE MAP UPDATE & TRADING PLAN FOR THE WEEKHey Everyone,
Please see our updated 4h chart levels and targets for the coming week.
We are seeing price play between two weighted levels with a gap above at 3301 and a gap below at 3242. We will need to see ema5 cross and lock on either weighted level to determine the next range.
We will see levels tested side by side until one of the weighted levels break and lock to confirm direction for the next range.
We will keep the above in mind when taking buys from dips. Our updated levels and weighted levels will allow us to track the movement down and then catch bounces up.
We will continue to buy dips using our support levels taking 20 to 40 pips. As stated before each of our level structures give 20 to 40 pip bounces, which is enough for a nice entry and exit. If you back test the levels we shared every week for the past 24 months, you can see how effectively they were used to trade with or against short/mid term swings and trends.
The swing range give bigger bounces then our weighted levels that's the difference between weighted levels and swing ranges.
BULLISH TARGET
3301
EMA5 CROSS AND LOCK ABOVE 3301 WILL OPEN THE FOLLOWING BULLISH TARGETS
3370
EMA5 CROSS AND LOCK ABOVE 3370 WILL OPEN THE FOLLOWING BULLISH TARGET
3429
EMA5 CROSS AND LOCK ABOVE 3429 WILL OPEN THE FOLLOWING BULLISH TARGET
3499
BEARISH TARGETS
3242
EMA5 CROSS AND LOCK BELOW 3242 WILL OPEN THE FOLLOWING BEARISH TARGET
3171
EMA5 CROSS AND LOCK BELOW 3171 WILL OPEN THE SWING RANGE
3089
3171
EMA5 CROSS AND LOCK BELOW 3171 WILL OPEN THE SECONDARY SWING RANGE
3089
3001
As always, we will keep you all updated with regular updates throughout the week and how we manage the active ideas and setups. Thank you all for your likes, comments and follows, we really appreciate it!
Mr Gold
GoldViewFX

GOLD DAILY CHART ROUTE MAPHey Everyone,
Following up on our previous Goldturn channel post – the recent price action has played out exactly as anticipated. We saw a clean rejection at the channel top around 3433, with price failing to lock above and confirming that resistance is still very much in control at the range ceiling.
This rejection was perfect and it led to a decisive move back down into the 3272 Goldturn support. This level is now acting as a critical pivot. From here, we’re watching closely for one of two outcomes:
1. Bounce Scenario: If price holds and we see a supportive reaction from 3272, particularly with no EMA5 cross and lock confirmation, we will look for long opportunities to slowly ascend the channel again. Expect a grind with testing of in-between levels as structure develops.
2. Breakdown Scenario: If 3272 fails to hold, we expect the next key test to occur at the channel’s midline – a level that has acted as support. A further breakdown would likely target 3106, our next Goldturn support zone, for potential reversal setups.
This price action continues to validate the effectiveness of the Goldturn channel structure keeping us grounded and responsive rather than reactive.
We remain focused on level to level trading, guided by the channel and supported by EMA5 confirmations for directional analysis.
Key Levels to Watch:
Resistance: 3433
Support: 3272 (current test), 3106 (if breakdown continues)
Stay patient and let price confirm. The best trades continue to come from structure respecting reactions, not from chasing.
Mr Gold
GoldViewFX

GOLD WEEKLY CHART MID/LONG TERM ROUTE MAPHey Everyone,
Follow up on our Weekly Goldturn channel outlook.
Last week’s action delivered the rejection at the channel top, right in line with expectations. Importantly, we did not get an EMA5 lock confirmation, reinforcing the rejection. We still have the previous weekly candle body close above 3387, leaving the gap at 3482 active and exposed overhead.
The early rejection saw a swift retrace into the 3281 Goldturn axis support, where price is currently attempting to stabilise. This is a pivotal level. From here, we are watching two potential paths unfold:
1. Bounce Scenario: If 3281 holds and buyers step in, we’ll look for a gradual climb within the channel, testing key in between levels. EMA5 cross and lock confirmation will be key for directional bias. A reclaim and continuation higher keeps the 3482 gap firmly in play as a target.
2. Breakdown Scenario: If 3281 gives way, we have a body close gap to the channel mid-line, which becomes the next key level for potential support and Goldturn reaction. A move into this area could offer another structured long opportunity, aligned with the overall bullish framework.
Despite the rejection at the highs, the broader channel structure remains intact, and the longer term outlook still favours a measured move up level by level, using Goldturn levels and EMA5 as our compass.
Key Focus:
Support: 3281 → Channel Half-line (if broken)
Resistance: 3387 → 3482 (gap target)
We remain patient and continue reacting to clean structure backed opportunities.
Mr Gold
GoldViewFX

XAUUSD Analysis todayHello traders, this is a complete multiple timeframe analysis of this pair. We see could find significant trading opportunities as per analysis upon price action confirmation we may take this trade. Smash the like button if you find value in this analysis and drop a comment if you have any questions or let me know which pair to cover in my next analysis.

GOLD (XAUUSD): Your Trading Plan for Monday
Gold went strongly rejected from a key daily support on Friday.
Your confirmation signal for a pullback trade from that will
be a bullish breakout and an hourly candle close above
3283 intraday resistance.
After that the price will likely reach 3292 level.
❤️Please, support my work with like, thank you!❤️
I am part of Trade Nation's Influencer program and receive a monthly fee for using their TradingView charts in my analysis.

Gold is coiling for a breakout... All eyes on the next move!📉 Gold is currently moving within a minor descending channel.
In yesterday’s analysis, I pointed out the potential for a drop. Now, after a period of range-bound movement, I expect a breakout from this channel and a return to the main trend.
🎯 The first target on a reversal would be the top of the minor channel.
Keep a close eye on price action here — this zone could be key for the next move
OANDA:XAUUSD

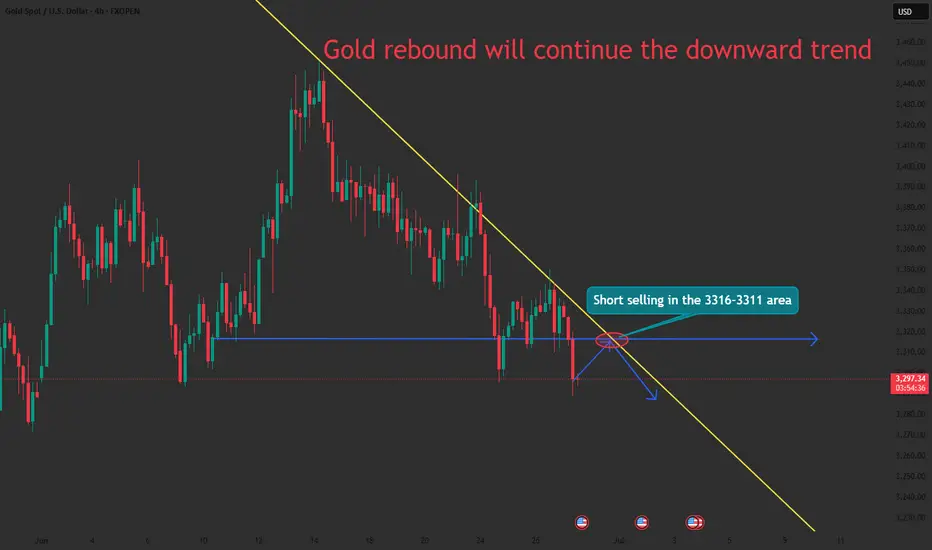
It’s the right time to make a golden layout!Gold opened at 3328 today and started the downward mode. After the European session, it continued to fall and broke the new low. The negative opening data of the US session also continued the downward mode. So far, it has reached the lowest point of 3255 and rebounded, but the strength is not very strong. After all, the upper pressure is still very strong. In the short term, we pay attention to the previous low point of 3295-3300, and focus on the upper 3305-3311. Today, the short-term operation of gold is mainly short-selling on rebounds, and long-selling on callbacks is supplemented.
From the 4-hour analysis, the upper short-term resistance is around 3295-3300, with focus on the important suppression at 3305-3311. The rebound will continue to be mainly short and look to fall back. The lower short-term support is around 3255-3245. Relying on this range as a whole, the main tone of high-altitude and low-multiple participation remains unchanged.
Gold operation strategy:
1. Short-selling in batches near the rebound of gold near 3295-3310, with a target of 3380-3370.
2. When gold falls back to around 3345-3455, go long in batches, with the target at 3370-3380.

GOLD ROUTE MAP UPDATEHey Everyone,
A fantastic close to the week as our analysis once again played out level to level with precision!
As a follow-up from yesterday's post:
- The swing range completed the move into 3348, as expected.
- However, we had no further EMA5 lock above, confirming rejection back into the swing range.
- This was followed by an EMA5 cross and lock below 3306, opening the secondary swing range.
- That range played out perfectly today, hitting both 3288 and 3271 targets.
We’re now seeing a bounce off those levels giving the 20 to 40 pips, and we will now be observing to see if the full secondary swing is completed.
It's Friday, and it's been a PIPTASTIC week across the board. Well done to everyone following the plan and sticking to the levels.
QUICK RECAP
BULLISH TARGET
3376 - DONE
BEARISH TARGETS
3348 - DONE
EMA5 CROSS AND LOCK BELOW 3348 WILL OPEN THE SWING RANGE
3330 - DONE
3306 - DONE
EMA5 CROSS AND LOCK BELOW 3306 WILL OPEN THE SECONDARY SWING RANGE
3288 - DONE
3271 - DONE
We’ll be back now on Sunday with our multi-timeframe analysis and trading plans for the week ahead. Thanks again for all your likes, comments, and follows.
Wishing you all a fantastic weekend!!
Mr Gold
GoldViewFX

Where will gold go?In 4 hours, it has fallen below the previous low of 3295, and will continue to fall. There are two supports below, namely 3280 and 3265. Don't expect a big rebound before going short in a negative market. If the rebound is large, it will not fall. This kind of negative decline is generally judged by the 15- and 30-minute patterns. When resistance appears in the big cycle, the market has actually fallen a lot.
Today, I think the pressure is mainly in the 3300 and 3310 areas. 3310 can be considered as the pressure of the top and bottom conversion. Pay attention to 3280 and 3265 below. If you consider going long, these two positions are the main positions. For the time being, the general direction is mainly short.

There are opportunities for both bulls and bears in gold!Gold fell back and closed lower yesterday. The daily line closed with a negative cross overnight. The overall market has not changed much. The short-term repeated tug-of-war is temporarily consolidating. Today is the closing of the weekly line, and we will continue to maintain the volatile thinking. In the 4H cycle, the Bollinger Bands closed, temporarily exerting pressure on the middle track. After rebounding to 3350 yesterday, it failed to continue and remained in a weak shock pattern. Therefore, today's operation is mainly short and supplemented by long. The upper pressure is at 3328 and 3336. Short according to the rebound strength, pay attention to the rise and fall of 3310 below. A breakthrough may see the previous low of 3295. If the support is not broken, you can consider going long.🔔For more specific operation details and strategy updates, please pay attention to the notification 🌐 at the bottom.
Gold operation suggestion: short gold around 3328-3338, target 3315-3310.

Gold prices are consolidating at a low level!International spot gold continued to fluctuate and fall. Looking back at the market performance on Thursday, gold prices maintained a narrow range of consolidation. Investors focused on the upcoming US inflation data to judge the direction of interest rate policy, while paying close attention to signs of easing geopolitical tensions in the Middle East. The current gold market is facing the influence of multiple factors: in the short term, PCE inflation data will become a key variable in determining the trend of gold prices. If the data is lower than expected, the market will strengthen the Fed's expectations of rate cuts, thereby supporting the upward trend of gold prices; on the contrary, if the inflation data exceeds expectations, it may delay the Fed's pace of rate cuts, resulting in pressure on gold prices. From a medium- and long-term perspective, the low interest rate environment, continued geopolitical risks and the potential weakening trend of the US dollar jointly provide structural support for gold prices. In addition, it is necessary to focus on the capital diversion effect that may be caused by the rising heat of the platinum and palladium markets. It is recommended to closely track the changes in capital flows in the precious metals sector.
From the analysis of the gold 4-hour level chart, today's gold price showed a downward trend at the opening, and the lowest fell to around US$3289.25 and then temporarily stabilized at US$3298. Technical indicators show that the 4-hour moving average system shows a dead cross arrangement, the MACD indicator dead cross continues, the gold price has fallen below the lower track support of the Bollinger Band, and the Bollinger Channel shows a narrowing trend, and the short-term price is in a low-level weak consolidation pattern. In view of the fact that the weekly line is about to close this week and the volatility of the end-of-month market is intensifying, it is necessary to focus on preventing the risk of a second bottoming out of the price. Comprehensively judged, the current gold trend is bearish, and the operation strategy is recommended to focus on rebound shorting.
Operation strategy:
1. It is recommended to short gold in the rebound area of 3311-3316, with a stop loss at 3324 and a target of 3300-3290