XAUUSD Top-down analysis Hello traders, this is a complete multiple timeframe analysis of this pair. We see could find significant trading opportunities as per analysis upon price action confirmation we may take this trade. Smash the like button if you find value in this analysis and drop a comment if you have any questions or let me know which pair to cover in my next analysis.
Goldtradingsetup

GOLD ( XAUUSD ) Long Term Selling Trading IdeaHello Traders
In This Chart GOLD HOURLY Forex Forecast By FOREX PLANET
today Gold analysis 👆
🟢This Chart includes_ (GOLD market update)
🟢What is The Next Opportunity on GOLD Market
🟢how to Enter to the Valid Entry With Assurance Profit
This CHART is For Trader's that Want to Improve Their Technical Analysis Skills and Their Trading By Understanding How To Analyze The Market Using Multiple Timeframes and Understanding The Bigger Picture on the Charts

GOLD: Gold price assessment after FOMC!Despite the recent increase, the price of Gold continues to be influenced by bearish technical indicators. There is a strong downward trend, with the immediate support level being at 1,890 - the lowest in five months. If this level is broken, there is further support at 1,886 which was last seen on March 15th. Should prices decline even further, they will likely test levels below the static support of 1,870.
Gold price is coming up for some air after the relentless three-day decline, fuelled by a broadly firmer US Dollar amid an increased flight to safety and economic resilience showcased by the recent US economic statistics.

Friday's Gold Trading PlanGold layout analysis: The layout of the gold 1927-29 position is empty on Thursday, and the friends who keep up with it will naturally get a profit. Yesterday's bullish CPI data failed to bring the gold bulls back on track, which is indeed a bit of a surprise. There are not a few people who chase after the extreme market, and they are basically swept out by the market in the end. Looking at the opening position of 1911 today, the current quotation is fluctuating around 1914, the high point keeps moving down, and the bottom keeps breaking low. Under this trend, it is only a matter of time before the 1910 low point is broken today. After yesterday's data was released, the market instantly rose to the 1930 line, then fell back and launched an attack again. After falling all the way to the 1910 position, it rebounded to the 1914 position and oscillated. In the state of weak and continuous output, if the gold bulls want to regain the initiative, they must stand above the 1930 position again to stabilize. Therefore, the main operation is bearish, and I will remind everyone if there is a chance to operate long orders. Friends, pay attention.
The market volatility in the Asian market on Friday is not large, and the recent trend is weird, so we need to be more cautious in controlling the entry position. In today's operation, let's first look at the short callback.
Let's first look at the breaking situation at the position of 1921 above. If it does not break, you can participate in short selling.
SELL1919~1921, SL1927, TP1910
If the European and American markets fall below the 1905-1903 position, you can participate in long positions
BUY1905~1903, SL1897, TP1915
Gold: waiting for a rebound
Gold has been falling below the support of 1901. Dukang still maintains a bullish thinking from low to high, and continues to hold more than 1895 orders, waiting for the US market to rise!
At present, the decline in gold is over, and the daily line has fallen to the support position of the 200-day moving average. The support of the large cycle moving average is likely to be the turning point of the market! And the short-term decline fell below the 1900 position in the past two days!
If you don't break, you can't stand, break the position and reverse! Before the price of gold falls below, we maintain the view of bottoming out and rebounding unchanged! Recently, the market is mainly concentrated in the US market, and there are many, relying on support and direct support! Bounce some in 1895
Strategy 1985 into long, 1992 to take profit or enter into decline

XAUUSD: 14/8 Trading Strategy of the DayToday's Asian market opened at $1913.27 in early trading, with a high of $1915.09 and a low of $1910.03. The minutes of the Federal Reserve FOMC meeting will be the focus of this week. The market is expected to be inclined to pause interest rate hikes in September and November. The dovish stance will put pressure on the dollar to break through the 103 mark. Gold fell to $1913.
The lowest point in early trading was at 1910, and gold continued to fall on the weekly trend. Currently, it maintains a trend of weak shocks, and the price is already close to the previous support zone. Whether there will be room for rebound repair at present. On the daily line, the K line is basically suppressed by the short-term moving average, and continues to show a strong downward trend of shocks. Judging from the daily line, it seems that there is not much room for a rebound, and it is more inclined to continue downward. From the four-hour chart of gold, the moving average is still running below the price, and the two moving averages have a clear downward trend of dead cross, while the K line is below the dead cross throughout the whole process, and is under continuous suppression. Although there is a short-term rebound, the big Yinxian can quickly swallow up the strength of the rebound. After opening in early trading, the downward trend of the negative line seems to continue.
In the 4-hour chart, the shape of gold presents a flat line, showing the characteristics of a bearish side. Despite multiple lows, the failure to break out also hints at the bearish influence. From an indicator point of view, the continuous bottom divergence of the stochastic indicator shows a gradual change in market sentiment, which may lead to an important turning point in the future. At the same time, the MACD indicator also shows signs of passivation bottom divergence, and there is no obvious rebound trend at present. The upper initial resistance is around 1920.88 on the 5-day moving average, and the resistance on the 10-day moving average is around 1932.49. For initial support, refer to the position near the lower rail of the Bollinger Line at 1907.02. For strong support, refer to the 1900 mark. The monthly low was 1892.86.
The upper part focuses on the first-line resistance of 1923-1928, and the lower part focuses on the first-line support of 1900-1893. If the 1910 position is broken today, we will continue to look down around 1900, and if we break the 1900 position, we should not continue to be long on gold.
Gold operation strategy:
SELL:1918-1921
TP1:1915
TP2:1910
BUY:1903-1906
TP1:1910
TP2:1916

Gold: The current price of falling points is more!
Gold once again broke new lows, but the decline shows signs of exhaustion, which means that this decline has come to an end for the time being, and the market will start a wave of rebound. The current price of 1911 in early trading is directly higher, and the rebound will rise first!
From the perspective of the trend of gold, the daily line has fallen to the previous low, which is also close to the support position of the 200-day moving average, and the weekly line has fallen back to the lower track of Bollinger! The greater the support position of the large cycle, the greater the possibility of an inflection point!
On the hourly chart, although gold fell again yesterday, the macd deviated and the decline failed. Today's market has a rebound demand, and the pressure above is 1925! Look at the rebound first, and then decide whether to short according to the trend after touching the pressure!
Gold is more than 1914, stop loss is 1907, and stop profit is 1925.


GOLD: A predictable scenario!The underwhelming inflation figures in the United States provided a reason for Federal Reserve policymakers to celebrate their success in tackling price pressures. However, traders were eager for more information to alleviate concerns about the shift in policy direction. These concerns were further compounded by worries surrounding China, the largest consumer of gold globally, which put downward pressure on the price of XAU/USD.

Gold analysis: short-term shock trend, reasonable entry pointToday's gold market opened at the 1943 line. From the perspective of the overall structure of gold, gold has gradually changed from a weak shock to a strong shock. The market has been in a downturn in the short term. This trend can be long or empty. The control needs to be more precise. In addition, this Thursday, the CPI annual rate, monthly rate, and initial claims are all gathered together. Gold should not make much movement in a short period of time, and there is a high probability that it will also fluctuate and pull back in the past few days. Therefore, the operation in the past few days is still mainly selling high and buying low.
At present, the probability of the upward fluctuation of the gold trend is higher, and both long and short positions have the opportunity to participate in the operation. Let's just treat it by selling high and buying low.
Today, let’s look at the 1935-1932 line below, and reach this range to find a low point and enter the market to open long.
BUY1935~1932, SL1928, TP1945.
The European and American market rose to the 1948-1951 line,
SELL1948~1951, SL1956, TP1940.

Gold today's range forecast 1915~1937Gold layout analysis: On Tuesday, more than 1930 gold orders were placed, and after rising to the 1935 line, the positions were reduced and left. In the overall stable profit appreciation position. After opening at 1925 this morning, it continued to rise slowly. Judging from the trend of gold in recent days, it basically maintains a low level and fluctuates within a few days, constantly breaking low. The high position keeps moving down. On Tuesday, it pulled back twice to the 1930 line, although it failed to continue to break down. However, it finally rebounded to the 1935 line and then fell back under pressure. The U.S. market broke through the 1930 line, approaching the 1920 line. Such a weak form of gold makes it more difficult to rise. Coupled with the extreme trend of the U.S. index, gold is also affected by it, resulting in insufficient motivation for bulls. According to this situation, it is not impossible to break the low of 1920 again. Since gold fell below the 30 line yesterday, there is no short-term support, so the operation can only be operated by selling high and buying low. It is more difficult to control the entry position, so please remember to be cautious during the operation.
Back to the topic, the current gold trend is dominated by bears, and the momentum of bulls is weak in the short term, but it cannot be ignored.
SELL1934-1937, SL1940, TP1922
If the European and American markets fall to around 1917,
BUY1917-1915, SL1910, TP1925

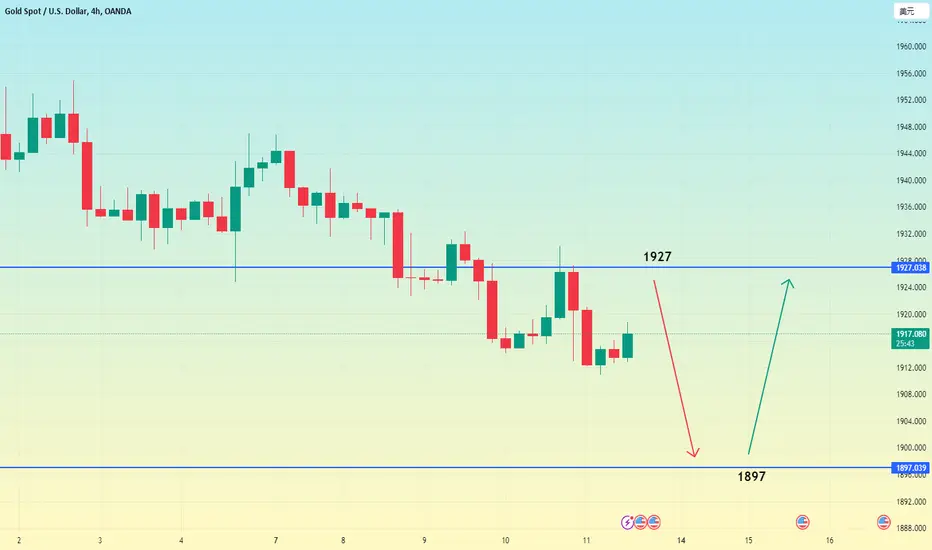
Gold today's forecast interval 1906~1929Gold layout analysis: The gold 1931 empty order shared with you on Wednesday is a complete victory. At present, judging from the recent trend of gold, the bulls are like deflated balloons. It can be said that there is no upward momentum. The high position keeps moving down, and the low position keeps breaking. If this trend continues, it is estimated that tonight's CPI will be difficult to restore the bullish situation, but compared with the bullish upward trend in the previous period, there are some similarities. After rising to the highest line in 1987, it fell all the way, without any signs of a strong rebound. So whether this time the short position will continue the previous long position? This question is also worthy of our careful consideration. Judging from the early trading, it is basically bearish. But we can't say absolutely, we still have to leave a little doubt. Anyway, today we will still implement the original plan, mainly selling high and buying low.
Back to the topic, under the trend of gold, we are mainly bearish, just to prevent the short from going the old way of the previous bull.
Today’s Asian-European market operation first looks at the top 1927-1929, and you can try to short when you reach this range.
SELL1927~1929, SL1934. The target is below 1915.
The European and American market fell to the position of 1908-1906, which can be traded with long orders,
BUY1908~1906, SL1900. Target 1920 above.

XAUUSD: 10/8 Today's Trading StrategyThe international gold price rose slightly and is currently around $1918. Yesterday, spot gold turned around after rising to an intraday high of $1932.39, and accelerated its fall below the $1920 mark in the U.S. market, and finally closed down 0.57% at $1914.35. The dollar fell on Wednesday, trading was quiet and stuck in a range, Investors await Thursday's U.S. consumer price report for signs on the direction of the Federal Reserve's monetary policy.
This trading day will usher in the U.S. CPI data for July, which is the focus of the market this week. At the same time, the changes in the number of U.S. jobless claims processed at the same time need to be paid attention to. These data may provide more information for the Fed's monetary policy stance clue. Judging from the 4-hour chart, the stochastic index is passivated and deviates from the bottom, and the MACD double-line dead fork is downward, temporarily controlling the market; in terms of form, the temporary low point has not yet come out; the form is not the form of the bottom, lacks a big positive line, and lacks continuity; Therefore, there is also a lack of reversal signals in 4 hours for the time being. Secondly, structurally, it is running in a descending channel, and the overall position is still controlled by short positions; the support position for top-to-bottom conversion is at the upper and lower positions of 1923.
Today, relying on yesterday's opening and falling of the U.S. market around 1927-28, we will continue to short at a high level. The target below is still focused on breaking the bottom, and the short-term weak short-term boundary line is focused on the 1932 mark. If the position is broken below, continue to pay attention to the low point support on July 10 near 1912.57. The lower track support of the Bollinger Line is currently around 1908.92, and then the integer mark support of 1900. The 200-day moving average support is also near this position.
Gold operation strategy:
SELL: 1923-1926
TP1:1918
TP2:1910
Buy: 1905-1908
TP1:1912
TP2:1918

XAUUSD: 11/8 Today's Trading StrategyOn Friday (August 11), DXY fluctuated within a narrow range and is currently around 102.50. Affected by the lower-than-expected inflation data overnight, spot gold once rose to an intraday high of $1,930.19, but then turned around and accelerated below the $1,920 mark. The U.S. dollar index turned from falling to rising, and investors digested U.S. July inflation data , data showed that consumer prices rose slightly, but inflation remained well above the Fed's 2% target; U.S. consumer prices rose slightly in July, consolidating expectations that the Fed's interest rate hike cycle is coming to an end
Yesterday, the price of gold fluctuated in a large range. The market opened at 1914.6 in the morning and the market rose first. In the beginning of the US market, it was affected by the fundamentals and quickly rose. The daily line reached the highest position at 1930.2 and then the market fell under pressure. After reaching the position of 1911.9, the market consolidated. After the daily line finally closed at the position of 1912, the daily line closed in the form of a shooting star with a very long upper shadow line.
Although gold rebounded yesterday with the support of the CPI data, the overall bearish trend finally returned in vain, and it still hit a new low since this round in late trading. No change for now. From a technical point of view, yesterday’s daily line of gold received a Yinxian shooting star, indicating that the short position is corrected, the Bollinger Bands are wide open, the KDJ indicator is about to form a golden cross, the midline fluctuates widely, and the general trend is still upward. Looking at the 4-hour chart, the Bollinger Bands open wide, the KDJ indicator is about to form a golden cross, and the price fluctuates at a low level. On the daily chart, the price of gold fluctuated and fell. The dead cross of the 5-day and 10-day moving averages crossed the middle track of the Bollinger Bands downwards, and formed a short-term suppression on the price of gold. The middle track and the lower track of the Bollinger Bands turned downward, indicating that the short Occupy a short-term advantage and gradually open up the downside space, but the downside time of the lower track of the Bollinger Band is relatively short, which may limit the short-term downside space. In terms of indicators, the dead cross of KDJ and RSI indicators turned slightly upward, indicating that there is a short-term rebound opportunity for gold prices, but the dead cross of MACD indicator diverged and crossed the zero axis, and the short-term technical side has the upper hand. Today, the upper pressure of gold price focuses on 1922 and 1933 US dollars, and the lower support focuses on 1910 and 1900 US dollars.
Gold operation strategy:
SELL: 1920-1923
TP1:1916
TP2:1910
Buy: 1903-1906
TP1:1909
TP2:1918

Mastering Gold Trading: Precise Timing Introduction:
Welcome to a groundbreaking trading opportunity that could revolutionize the way you approach gold trading. In this comprehensive analysis, we're about to delve into the world of W.D. Gann methods and advanced mathematical techniques to unveil timing pivot predictions that offer exceptional insights into the gold market's major reversals. By meticulously analyzing the 15-minute timeframe, we've decoded key patterns to help you anticipate market movements and position yourself for potentially lucrative trades.
Understanding the Method:
At the heart of this analysis lies the revered W.D. Gann methods, a cornerstone of technical analysis, and their symbiotic relationship with advanced mathematics. These methods, which combine price and time analysis, provide us with a unique lens through which to perceive the gold market's hidden rhythms. By scrutinizing historical price data and aligning it with mathematical principles, we've uncovered crucial pivot points that have historically indicated significant market shifts.
The Power of Timing Pivot Predictions:
Imagine knowing exactly when the market is poised to make a major reversal. With our timing pivot predictions, you'll gain the edge you need to plan your trades effectively. These predictions identify specific timeframes when market sentiment and price momentum are likely to undergo substantial transformations. Whether you're a seasoned trader or a newcomer, having this advantage can drastically enhance your trading strategy.
How to Utilize the Predictions:
Our comprehensive analysis is all about translating insights into actionable strategies. We provide clear entry and exit points for your trades, taking the guesswork out of your decision-making process. Our carefully calculated predictions highlight the moments to consider opening a position and, equally importantly, when to close it. By aligning your trades with these timing pivot predictions, you position yourself strategically to potentially maximize profits while minimizing risks.
Trade Idea in Motion:
Let's put theory into practice with a recent real-world example. Based on our analysis, we've identified a compelling trade ideas for the upcoming week. We anticipate major reversals to occur around within the 15-minute timeframe. This are opportunities to consider entering a long/short positions, targeting massive ROI profit margins. Our predictive analysis indicates that the reversal's momentum could extend, making this an excellent chance to ride the market wave.
Risk Management and Beyond:
No trading strategy is complete without robust risk management. We'll guide you through optimal stop-loss placement to safeguard your capital in case the market behaves unexpectedly. Furthermore, we'll explore potential trade extensions, helping you recognize when to stay in a position for the potential of greater rewards.
Conclusion:
Get ready to elevate your trading game with our precise timing pivot predictions based on W.D. Gann methods and mathematical insights. By understanding the historical patterns and aligning them with mathematical principles, we're offering you a chance to anticipate major reversals like never before. Embrace the power of informed trading decisions, guided by our carefully curated entry and exit points. As you embark on this trading journey armed with cutting-edge analysis, remember that success favors those who dare to take calculated steps into the future of trading.
Disclaimer: Trading involves inherent risks, and while our analysis provides valuable insights, it doesn't guarantee success. Always exercise caution and conduct thorough research before making trading decisions.

GOLD BUY Hello, according to my analysis of the gold market, there is a high possibility of a rise towards the 1980 region. Everything is explained in the analysis. Good luck to everyone

GOLD: The trend is highly likely to drop to 190x with CPIGold price is replicating the moves seen in the first half of Wednesday on the United States (US) Consumer Price Index (CPI) day. The United States Dollar (USD) buyers take a breather, awaiting the critical US inflation data for a fresh directional impetus.

Gold: Step back in place, and the current price of 1923 will go
Gold stepped back on the support again, the current price is directly higher than 1924, continue to be bullish! The US market will continue to rebound!
The gold down structure is complete! Now we are going to oscillate to build a bottom, and the first-line support at 1923 below is obvious! After rebounding above 1930, there will be a callback, and the fall will continue to increase. Next, it will be bullish around 1945!
Enter more, the US market will continue to be more bullish, and then start a rebound structure, and it will be a level of rising band! Falling back now is an opportunity to do more!
Gold is more than 1923, stop loss is 1917, and stop profit is 1940.

XAUUSD Top-down analysis Hello traders, this is a complete multiple timeframe analysis of this pair. We see could find significant trading opportunities as per analysis upon price action confirmation we may take this trade. Smash the like button if you find value in this analysis and drop a comment if you have any questions or let me know which pair to cover in my next analysis.

GOLD: DXY and CPI data!The Dollar Index (DXY) and US Yields helped keep Gold on the backfoot yesterday with Dollar strength continuing this morning. The US Dollar appears to be benefitting from a risk-off tone this morning following lackluster data from China as well as Moody’s downgrading a host of small to medium sized US Banks.

XAUUSD Top-down analysis Hello traders, this is a complete multiple timeframe analysis of this pair. We see could find significant trading opportunities as per analysis upon price action confirmation we may take this trade. Smash the like button if you find value in this analysis and drop a comment if you have any questions or let me know which pair to cover in my next analysis.

GOLD: stronger US Dollar!Gold price remains under some selling pressure for the second successive day on Tuesday and drops to a fresh daily low, around the 1,931 area during the Asian session. The XAU/USD, however, manages to hold above a three-and-half-week low touched last Friday.
Gold is predicted to stay in a falling wedge
Support zone: 1928, 1922, 1912

XAUUSD: 7/8 Gold Trading StrategyGold trend analysis
It can also be seen on the daily line that this callback has touched the support of the Bollinger lower track on the daily line, which is an undoubted turning point of the market! Then go all out to do more this week! In 4 hours, there is still a need for adjustment at the bottom of gold, but the callback is an opportunity to go long. After the rise on Friday, the callback low was 1937, which was the previous pressure position. After breaking through, it became a support. For further resistance, refer to the position near the 21-day moving average of 1952.70 And the 1960 mark, the strong resistance is around the 100-day moving average of 1968.68. If this position can be regained, it will increase the bullish signal for the market outlook.
Gold operation strategy:
SELL: 1946-1949
TP1: 1940
TP2: 1935
BUY: 1933-1936
TP1:1940
TP2:1945
