GOLD before NF: Beware of tricksGold prices increased by more than 0.7% on Thursday, resulting in an overall gain of about 1.6% for the week.
This marks the best week for gold since early April. The rise in XAU/USD comes as the US Dollar and Treasury yields weaken, highlighting gold's anti-fiat characteristics.
On the daily chart, the next major technical obstacle for gold prices is approaching. On the 4-hour chart, the pair has rebounded off the rising EMA34 and is attempting to stay above the EMA89.
Technical indicators are still in positive territory, with the RSI remaining bullish at around 64. More upside potential is expected in the near future, especially if the current positive trend continues.
Goldtradingsetup

XAUUSD - 1975 needs to be re-examined The US Dollar Index (DXY) experienced a drop from its 10-week high and fell to an intraday low of 104.00.
Despite this, the US 10-year Treasury yields remain low, around 3.68% at present, while the two-year counterpart also remains low near 4.45% after a 12-day uptrend.
It's worth noting that recent data in the US hasn't supported the Federal Reserve's hawkish bets, leading to a rally in XAU/USD.
However, Richmond Fed President Thomas Barkin believes that rate hikes are limiting demand.
As such, the 1975 area needs to be re-examined, and my first target is to place a buy order around 1950.

Gold looking BEARISHGold has had a fantastic bull run since December 2015, however this trend may be due for a reversal ahead.
The Green wave 5 seems to have completed, so an entry on a short position can be taken at the current price of 1960.39
Further size can be added to the short if the price reaches 2068.32 as this could be the final push upwards before the reversal.
The weekly RSI is "bearishly diverging" meaning we are seeing higher highs in price with lower highs in the RSI, although in this case the highs in price are at the same level.
A conservative target that will commonly be reached is the 0.382 retracement of all 5 green waves at the 1641 level.
Given that this is on the weekly chart, this could take between 6-12 months to play out.
Entry 1 = 1960.39
Entry 2 = 2068.32
Take profit = 1641.51
Stop loss = 2185.85

Gold trading recommendations today
Gold rebounded but 1950, continue to be short
The current decline of gold is still the same, the rebound is not under pressure, and it will continue to make new lows after the shock! Relying on the key pressure position is short
The current gold is undoubtedly still in a downward trend. On the 4-hour level, gold fluctuates all the way down! And it keeps breaking new lows, and the high point connection forms the suppression of the current downward trend line! It is also the key resistance of this rebound!
Before breaking through the suppression of the downward trend line, gold will continue to fluctuate downward, and will continue to break new lows! The longer the shock, the stronger the explosive power!
Trading straregy:
gold: sell@1950 tp1:1935 tp2:1925
Next, there will be a lot of trading opportunities for gold, and I will provide you with more signals, don't miss the opportunity to make money!

Gold trading recommendations today
The current decline of gold remains unchanged, and the rebound is still a short-selling opportunity! The pressure in 1957 above is obvious!
The current gold is in a downward trend. Shorting is the only strategy at present. The thinking is clear. The remaining execution points rely on key pressures, and we should deal with them immediately!
From the perspective of the 4-hour level, gold fluctuates and fluctuates, and after each shock, it will break a new low! Mainly operate at high altitudes, relying on the suppression of the downward trend line, and the upper horizontal pressure of 1957 to dry up, continue to look at new lows!
Trading straregy:
Trading strategy for next week:
gold: sell@1957 tp1:1950 tp2:1940
Next, there will be a lot of trading opportunities for gold, and I will provide you with more signals, don't miss the opportunity to make money!

GOLD: The influence of USDUS Dollar eases from recent peaks near 104.40
If the Federal Reserve meeting were to take place today, it is likely that the interest rates would remain unchanged due to the current uncertainty surrounding banks. However, the markets can change significantly within a week. If the upcoming weekend remains peaceful with no urgent need to rescue any banks, there is a high likelihood of a 25 basis points increase in the rates. The Federal Reserve continues to hike rates until it hits a roadblock. In case that obstacle is only Silicon Valley Bank (SVB), the persistently high inflation rates may lead to further hikes. This, in turn, would strengthen the US Dollar and eventually result in a decline in stocks once the initial relief rally wears off due to a lack of new bank failures.

Gold down slightly for the first Monday of the week!The US Dollar is experiencing a minor setback from its two-month high against other major currencies due to the slow performance of US Treasury bond yields.
Although the US Dollar is weakening, Gold price is still under pressure because of the potential risk of a US recession, even though the debt deal still needs to be approved by Congress.
The recent decline in Gold price is also due to the expectation of a 25 basis points rate hike by the US Federal Reserve (Fed) in June. Market predictions indicate a 62% chance of a rate hike next month, up from 12% last week.
Strong US economic data and the debt-ceiling extension could give the Fed room to continue its tightening cycle in June.
The first Monday of the week, I still follow the downtrend of Gold . This decline will start around the price range 1953 -1958
And fall back to 193x or even 1925 in the future

Gold trading recommendations today
The current decline continues, without any upward signals and rebounds, and the rebound is an opportunity to short again! The 1954 pressure position continues to be shorted, and the 1950 can be directly shorted
Trading straregy:
gold: sell@1954-1950 tp1:1940 tp2:1930
Next, there will be a lot of trading opportunities for gold, and I will provide you with more signals, don't miss the opportunity to make money!

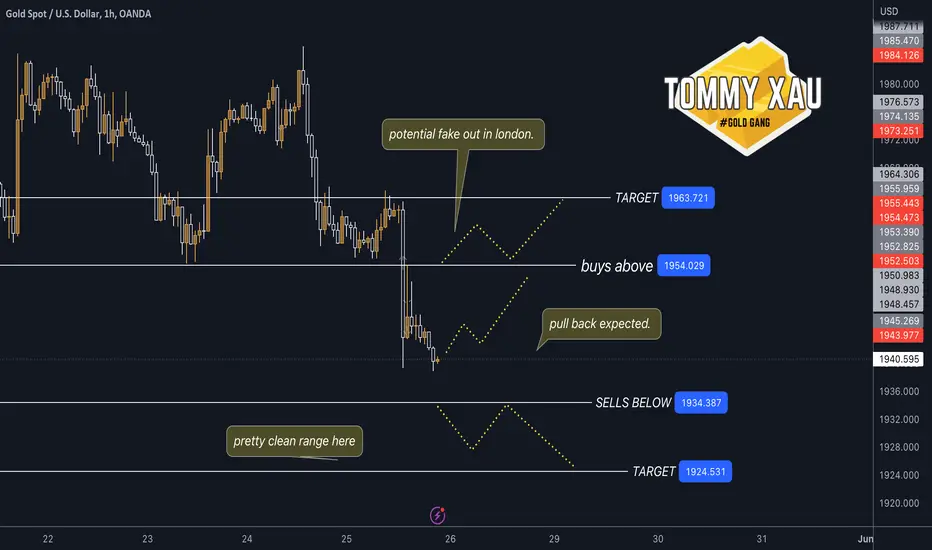
XAUUSD Outlook 26/5/23. The bears are here! 📉Good evening gold gang, another amazing day catching the sells all the way to hell! Congrats.
Looks like the bears are here to stay for a while .. price has closed beneath the high of february indicating some mid term downside, coupled with DXY strength making higher highs. I think the only think that will pump us up back into the 2000s is a world economic event .. but all charts pointing downward for the time being.
Ok on to the outlook .. big push down today will require a small pull back, we may see this in asia .. buy zones are out of the way just in case to target that nice clean candle to the upside.
Sells below the current structure and should be pretty straight forward there. Im already at my 200 pip target for the week so ill only be trading if there is a clear set up there for me using the classic strategy or the new 1 min strategy.
Some lovely news coming up tomorrow with a bunch of folders there waiting for us to catch that sweet sweet volume. Lets see what we get!!
thank you for over 900 followers!! please follow along if you're not already. My analysis is simple, but very accurate. Look back and see for yourself.
Like and boost this post!
TommyXAU
Gold 4hr TF Currently, the outlook for gold is positive, with a bullish trend. However, I anticipate a temporary pullback from 2045.26 - 2047.73. This presents an opportunity for me to consider buying positions before gold potentially reaches an all-time high.
On the other hand, the US dollar has a bearish outlook, having broken and retested the channel.
Furthermore, silver has broken and retested its channel and is currently on an upward trend. As expected, gold miners are also moving higher.

Gold 4hr TF Gold is currently displaying bullish behavior, but a correction is expected in the coming days, presenting a favorable chance to buy. If gold's value drops to approximately 2030 or 2013, it would provide an ideal opportunity to buy as these levels have confluences.
Additionally, gold miners are also demonstrating bullish behavior, indicating a potential surge in gold. However, it is recommended to wait for reversals in both gold and silver before making any decisions on their next move.

Gold 4hr TF Gold presents a few Confluences for long positions upon retesting the decline trend line. My expectation is that gold will touch 2003.99 twice, which is where I plan to add another position.
Regarding GDX "Gold miners," the fact that it only closed down -0.81% while gold closed -1.66% suggests that gold's sell-off will likely be brief, and the market should begin to turn bullish.
Silver is currently reacting and retesting the upper band of the pattern, and I anticipate a bullish swing in the near future.
I believe that once the Dow Jones breaks 12750 and an incline trend line from October 2021, gold will move into a bullish phase.

Gold 15m TF I anticipate a favorable market response to occur within the price of 2031.08 to 2033.55, and there appear to be several potential opportunities to sell based on the following confluences: Moving Average, Reversal point, Decline Trend line, Incline Trend line, 0.618 bearish fib and Structure.
Currently, Gold has experienced an increase of 1.6%, indicating the need for a pullback before it can make further upward movements. Gold miners have only seen a marginal increase of 0.06%. As such, I am anticipating a reversal in gold's performance within my area of interest.

GOLD: Stalls on the offer after FOMC minutesFOMC minutes, key notes
Some participants commented that additional policy firming would likely be warranted at future meetings.
Some participants stressed it was crucial that policy that the statement not signal the likelihood of rate cuts this year or rule out further hikes.
Fed staff continue to forecast mild recession starting later this year, followed by a modestly-paced recovery.
Several participants said if the economy evolved along lines of their outlooks, further policy firming might not be needed.
Participants generally agreed that the extent to which further interest rate hikes may be appropriate had become less certain.
Many participants focused on need to retain optionality after May meeting.
Participants judged that the banking sector stress would likely weigh on economic activity but to an uncertain extent.
Participants agreed that inflation was unacceptably high, and are declining slower than they had expected.
Some participants noted concerns that the Federal debt limit may not be raised in a timely manner, threatening significant financial system disruptions, and tighter financial conditions.

Gold Weekly TF Gold's recent decline has brought it back within the established trading range. To confirm that this is merely a temporary break and subsequent retest of the range, it would be necessary for gold to close above the level of 1960.
It should be noted that while an increase in the US debt limit alone may not directly trigger a rise in the price of gold, certain accompanying factors such as concerns about the country's fiscal health, economic instability, or a loss of confidence in the US dollar can make gold a more appealing investment. In such situations, investors may allocate more funds into gold, driving up its demand and potentially increasing its price.
However, it's important to recognize that the price of gold is influenced by a multitude of factors, including global economic conditions, geopolitical events, interest rates, inflation, and investor sentiment. Consequently, while the US debt limit can be a relevant factor to consider, it is not the sole determinant of gold's price. Other factors and market dynamics play significant roles in shaping the value of this precious metal.

Golden calm before going upHi, according to my analysis of the gold market. There is a high potential for an upside from this area. It reached the bottom of the ascending channel. With very strong support at the 1950 level. Good luck everyone .Note: If you like this analysis, please give your opinion on it. in the comments. I will be happy to share ideas. Like and click to get free content. Thank you

📉XAUUSD fake bullish scenario📈FOREXCOM:XAUUSD
OANDA:XAUUSD
Gold analytical series, Episode 10
Hello Traders, Gold can create a bullish view by starting a fake upward movement and continue the downward trend by falling below $1950 in the following days to the level of at least $1885.
Optimum stop-loss for long positions: Under 1957$
Optimum stop-loss for short positions: above 2017$
Don't forget to risk-free your positions.
Please share ideas and leave a comment,
Let me know what's your idea.
CrazyS✌

XAU/USD Sees Modest Upside Amid US Debt Ceiling ConcernsThe XAU/USD pair shows a potential buying opportunity as Gold price receives support from various factors, including US debt ceiling concerns and Powell's less hawkish remarks. However, it's essential to stay informed about market developments and adjust the trade plan accordingly.
TRADE IDEA DETAILS
CURRENCY PAIR: XAU/USD (Gold/US Dollar)
CURRENT TREND: Sideways with a slight bullish bias
TRADE SIGNAL: Buy Signal
👉ENTRY PRICE: $1,984-$1,985
✅TAKE PROFIT: $2,011-$2,012
❌STOP LOSS: Below $1,950
The analysis suggests a potential buy signal for the XAU/USD currency pair. Here's the breakdown:
1. Gold price is currently trading within a narrow range and influenced by various factors.
2. The US Dollar has experienced a modest intraday uptick, which acts as a headwind for the XAU/USD.
3. Despite the US Dollar strength, Gold's downside is cushioned by looming recession risks and concerns about the US debt ceiling.
4. Federal Reserve Chair Jerome Powell's less hawkish remarks provide support to Gold price.
5. Technical analysis indicates that a sustained strength above the $1,984-$1,985 region could lift the price towards $2,000 and beyond.
6. The immediate support level is around $1,950, with the 100-day Simple Moving Average (SMA) acting as the next support around $1,930.
TRADE PLAN: Based on the analysis, the trade plan is as follows:
1. Enter a long position (buy) if the price breaks above the $1,984-$1,985 resistance level.
2. Set the take profit level at $2,011-$2,012, which represents the next relevant hurdle.
3. Place the stop loss below the $1,950 support level to limit potential losses.
4. Implement proper risk management techniques, ensuring a risk-to-reward ratio of at least 1:2.
5. Monitor the trade closely, considering key events such as the meeting between President Joe Biden and House Republican Speaker Kevin McCarthy and the release of US PMI prints and FOMC meeting minutes.
#GoldPriceForecast #XAUUSD #USDebtCeiling #FederalReserve #MarketAnalysis

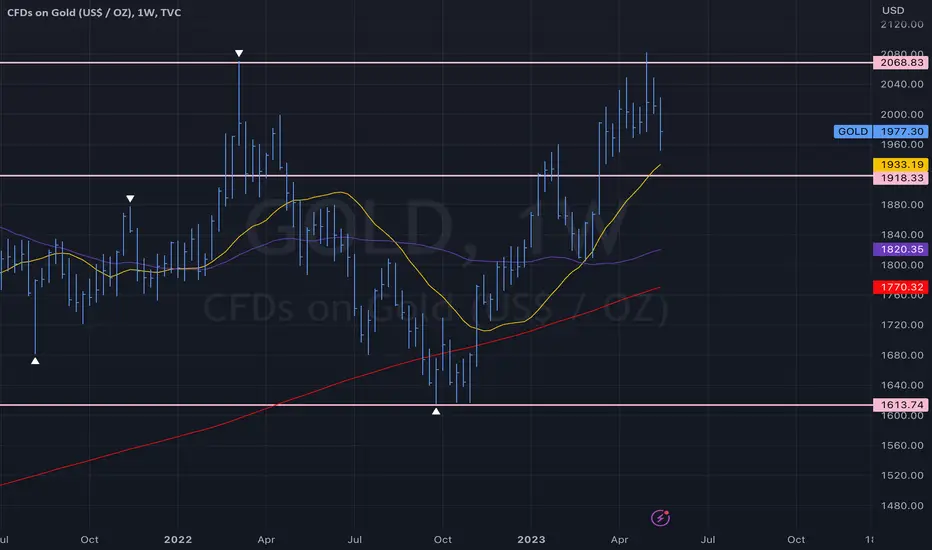
$GOLD Support at the 20 weekly moving averageTVC:GOLD AMEX:GLD #GOLD #GOLDBUGS Double top rejected, a ton of support at the 20 moving weekly average and the horizontal trend line. Gold needs to consolidate in a bull flag before it can move higher.
XAUUSD xauusd we are know in price 1977, price is below march poc, below, market is moving below as DXY get strong, we are reaching major strong key level 1930 as long setup is all depend upon supply and demand we buy low as we sell high as economic data realis price break our key zones, watch for weekly openings follow your trading plan execute trade as reach your level execute the trade according to the plan.. happy trading.

Why To Buy Gold NowGold is failing to break through the 4h support, giving us the low-risk opportunity to buy gold,
when you look close to the m1. the buyer's momentum has reduced. so look for confirmations to buy short term.

XAUUSD BUYHi fellow traders, XAUUSD is completing an ABC correction on the 15 min. TF. Look for a buy opportunity from the blue box area. The trade will be invalidated if we break the red line. Target the resistance levels. Good luck and trade safe!

Gold shorting
The 2000 line was supported twice, this time it was going to break.There are too many data profits to rush up, and the main force will take advantage of the data to put the bulls on top.2000 points have support. Everyone can see this. Let me talk about it here. 2000 points will be broken.
Trading strategy: gold 2008 short, stop loss 2015, target 1980
Next, there will be a lot of trading opportunities for gold, and I will provide you with more signals, don't miss the opportunity to make money!
