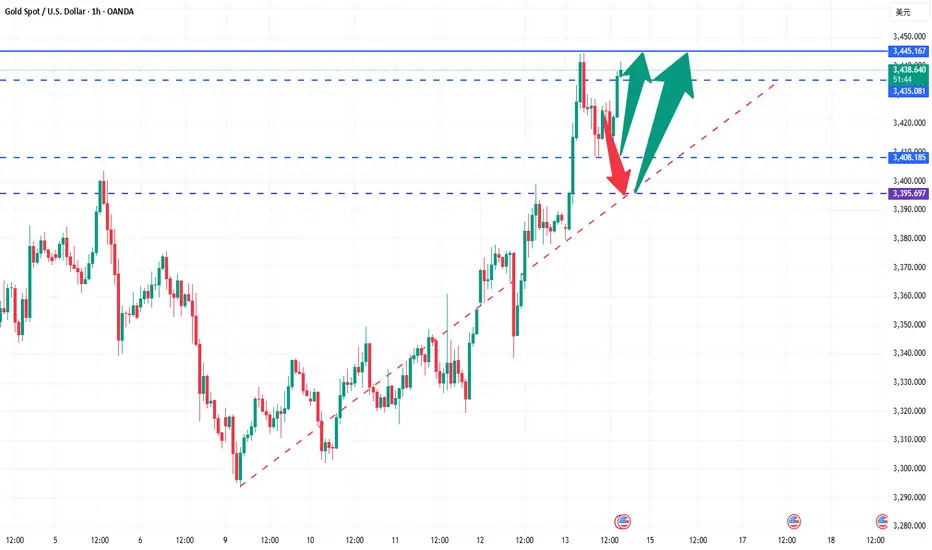
Bulls are in control, and pullbacks are opportunities!Gold rose directly at the opening today due to risk aversion, reaching a high of around 3446.8. We successfully stopped profit twice when we went long. Subsequently, we also notified everyone to enter short positions at 3445 and exit with profit at 3425. Pay attention to the support situation at 3395-3408. Going long on pullbacks is still the main trend at present.
From the current gold trend analysis, today's gold mid-line pulled up and broke through and stood above the 3400 mark to further continue its strength. The short-term support below is around 3310-3408, and the key support below is around the recent top and bottom conversion position of 3395-3405. The intraday pullback relies on this position to continue to be bullish and the short-term bullish dividing line moves up to 3345-3350. The daily level stabilizes above this position and continues to maintain the trend of low-long rhythm. Be cautious about short orders against the trend. I will give you tips on specific operations, and pay attention in time.
Gold operation strategy: Buy gold when it falls back to around 3395-3405, and target around 3425-3440. If it is strong, continue to buy gold at the support of 3410-3408.
When operating, be sure to strictly set stop loss, strictly control risks, and respond to market fluctuations steadily.
Goldtradingstrategy

Gold will inevitably fall after risingGold has risen sharply due to the violent geopolitical conflicts and the surge in risk aversion. It once reached around 3445, but in the process of falling back, it only touched 3408 and rebounded again, stabilizing above 3400. It is obvious that due to the changes in fundamentals, the sentiment of gold bulls is high; although the upward momentum of gold near 3440 has weakened, there is no clear signal of peaking yet!
For short-term trading, it is relatively difficult to participate at present. To be honest, I naturally don’t want to chase gold at a high level; but there are no more signals to support me to short gold for the time being. However, with the rebound of gold, the current short-term support below is in the 3425-3415 area, followed by the psychological support of the 3400 integer mark; and the short-term resistance above is in the 3455-3465 area, followed by the area near 3480.
Compared with the profit and loss ratio, I prefer shorting gold for short-term trading, because gold has performed relatively strongly in the London market. Logically, gold will have the inertia to rise in the New York market, so I think gold may rise and then fall in the New York market, so my current plan is to try shorting gold starting in the 3455-3465 area.
Because the changes in gold's fundamentals are more extreme and complex, you must set up SL when participating in transactions.

GOLD ROUTE MAP UPDATEHey Everyone,
Great finish after completing each of our targets throughout the week with ema5 lock confirmations on our proprietary Goldturn levels. Yesterday we finished off with 3388 and stated we would look for ema5 cross and lock above 3388 to open 3428 and failure to lock will follow with a rejection.
- This played out perfectly with the cross and lock confirmation and then the target hit at 3428 completing the range.
BULLISH TARGET
3318 - DONE
EMA5 CROSS AND LOCK ABOVE 3318 WILL OPEN THE FOLLOWING BULLISH TARGETS
3352 - DONE
EMA5 CROSS AND LOCK ABOVE 3352 WILL OPEN THE FOLLOWING BULLISH TARGET
3388 - DONE
EMA5 CROSS AND LOCK ABOVE 3388 WILL OPEN THE FOLLOWING BULLISH TARGET
3428 - DONE
We’ll be back now on Sunday with our multi-timeframe analysis and trading plans for the week ahead. Thanks again for all your likes, comments, and follows.
Wishing you all a fantastic weekend!!
Mr Gold
GoldViewFX

Hit the target with one strike! Gold perfectly cashed in 3435Gold closed sideways at a high level yesterday, and closed positive again overnight. It opened back to 3379 and pulled up strongly, breaking through the 3400 mark and then increasing in volume. The recent low-multiple bullish ideas have been realized. There is no doubt that it will continue to be bullish and long today. The market has turned from the previous sweeping upward to a strong unilateral trend. The upper side will first look at the previous high pressure of 3435. Continued breakthrough will further open up the upper space, or it will hit 3500 or even a new high again. The lower support focuses on the top and bottom conversion position of 3395-3405, and then pay attention to the 1H cycle support near 3410. The intraday operation is mainly long on the decline.
Operation suggestion: Go long on gold when it falls back to 3395-3345, and look at 3434 and 3450. If it is strong, continue to go long with the support of 3415-3410.
When operating, be sure to strictly set stop loss, strictly control risks, and respond to market fluctuations steadily.
The summit is just around the corner, just one final push away!Gold closed sideways at a high level yesterday, and closed positive again overnight. It opened back to 3379 and pulled up strongly, breaking through the 3400 mark and then increasing in volume. The recent low-multiple bullish ideas have been realized. Today, there is no doubt that it will continue to be bullish and long. The market has turned from the previous sweeping upward to a strong unilateral trend. The upper side will first look at the previous high pressure of 3435. Continued breakthrough will further open up the upper space, or it will hit 3500 or even a new high again. The lower support focuses on the top and bottom conversion position of 3395-3405, and then pay attention to the 1H cycle support near 3410. Intraday operations are still mainly based on falling back and long.
Operation suggestion: Go long when gold falls back to 3395-3345, and look at 3434 and 3450. If it is strong, continue to go long with the support of 3415-3410.

XAUUSD Analysis todayHello traders, this is a complete multiple timeframe analysis of this pair. We see could find significant trading opportunities as per analysis upon price action confirmation we may take this trade. Smash the like button if you find value in this analysis and drop a comment if you have any questions or let me know which pair to cover in my next analysis.

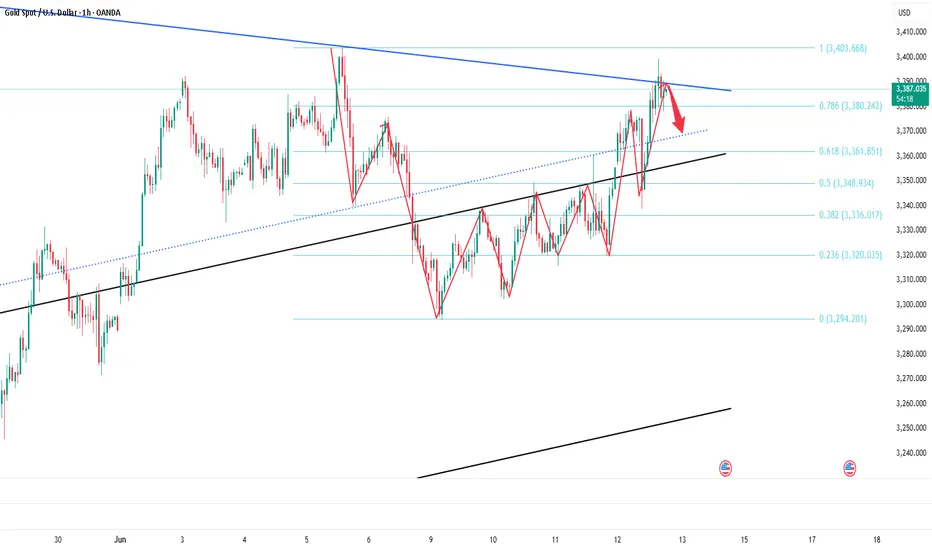
Stick to shorting gold and aim for the target area.Gold has not broken through 3400 after accelerating its rise, and the upper suppression effect still exists; currently gold is fluctuating in a narrow range below 3390, showing signs of stagflation to a certain extent. Therefore, the accelerated rise of gold is not for the short-term impact of 3400, but for a deep retracement, eliminating more scattered funds in the market by sweeping up and down.
So in the short term, I think it is difficult for gold to continue to break upward under the suppression of the resistance area near the short-term high of 3402, but to test the lower support area of 3375-3365 before breaking upward. So I have shorted gold as scheduled according to the short trading plan mentioned above, and aimed at the lower target area of 3375-3365.
At present, our short position has made a certain profit, but I still look forward to profiting from gold hitting TP! Let us look forward to gold falling back to the target area as expected!
Accurately capture golden trading opportunitiesBased on the current trend, it is recommended to focus on low-long operations, but be wary of the market repeating the pattern of the previous few days of high-rush, wash-out and fall. From the perspective of key points, 3360 has been converted from a previous resistance level to a support level. At the same time, the hourly line forms an important support near 3358. If there is a stabilization signal at this position, it can be regarded as a good opportunity to go long. However, if the market falls below the 3356 line, it is not ruled out that the price will further fall to around 3345. This position is the key long-short watershed during the day. Once it is lost, the short-selling force may increase; in extreme cases, if there is a deep wash-out, the gold price may even pull back to 3325. For the upper resistance, pay attention to 3395-3405 first. If it can break strongly, it can further look to 3414.
Based on the above analysis, the trading strategy is as follows:
If gold falls back to the area near 3345-3355 and does not break, you can consider arranging long orders;
When the price rises to the area near 3395-3405 and does not break, you can try to arrange short orders.
When operating, be sure to strictly set stop losses and control risks.
Today's market trend is completely in line with the predicted rhythm, with a clear shock structure and flexible response around key points. With precise layout based on two-way thinking, we can achieve a double kill of long and short positions and a steady harvest. If your current gold operation is not ideal, and we hope to help you avoid detours in your investment, please feel free to communicate with us!

GOLD ROUTE MAP UPDATEHey Everyone,
Another PITASTIC day on the charts, with our analysis playing out perfectly.
Yesterday after completing the target at 3352, we stated that we’ll be watching for a confirmed cross and lock above 3352 for a continuation. We got the cross and lock above 3352 opening 3388.
- 3388 was hit perfectly today completing this target. We will now look for a ema5 cross and lock above 3388 for a continuation. If price fails to lock above, we could see rejections leading back into the lower Goldturns, where we’ll look for support and bounce.
We will keep the above in mind when taking buys from dips. Our updated levels and weighted levels will allow us to track the movement down and then catch bounces up.
We will continue to buy dips using our support levels taking 20 to 40 pips. As stated before each of our level structures give 20 to 40 pip bounces, which is enough for a nice entry and exit. If you back test the levels we shared every week for the past 24 months, you can see how effectively they were used to trade with or against short/mid term swings and trends.
The swing range give bigger bounces then our weighted levels that's the difference between weighted levels and swing ranges.
BULLISH TARGET
3318 - DONE
EMA5 CROSS AND LOCK ABOVE 3318 WILL OPEN THE FOLLOWING BULLISH TARGETS
3352 - DONE
EMA5 CROSS AND LOCK ABOVE 3352 WILL OPEN THE FOLLOWING BULLISH TARGET
3388 - DONE
EMA5 CROSS AND LOCK ABOVE 3388 WILL OPEN THE FOLLOWING BULLISH TARGET
3428
EMA5 CROSS AND LOCK ABOVE 3428 WILL OPEN THE FOLLOWING BULLISH TARGET
3478
BEARISH TARGETS
3281
EMA5 CROSS AND LOCK BELOW 3281 WILL OPEN THE FOLLOWING BEARISH TARGET
3254
EMA5 CROSS AND LOCK BELOW 3254 WILL OPEN THE FOLLOWING BEARISH TARGET
3210
EMA5 CROSS AND LOCK BELOW 3210 WILL OPEN THE SWING RANGE
3179
3146
As always, we will keep you all updated with regular updates throughout the week and how we manage the active ideas and setups. Thank you all for your likes, comments and follows, we really appreciate it!
Mr Gold
GoldViewFX

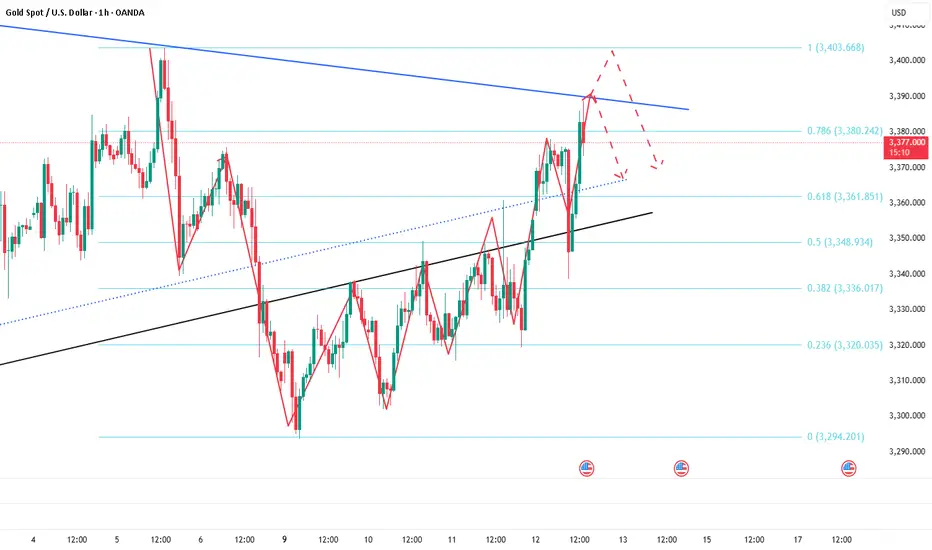
Short gold ,it is expected to retreatToday, we accurately seized the trading opportunity of long gold at 3350 according to the trading plan, and hit TP: 3380 in the process of rebounding. We firmly grasped the profit of 300pips in the short-term long trading. At present, gold maintains the trend of continued rise! Now I definitely do not advocate chasing gold in short-term trading. On the contrary, I will actively look for good opportunities for short-term short trading to earn profits from short-term retracement.
In the short term, the suppression area I focus on is the 3390-3395 area, because the gold trend is relatively strong during the European session, and the US session should continue. If gold cannot break through this area in the short term, gold will likely usher in a wave of retracement. I think it should not be difficult to test the 3370-3360 area downward; secondly, we must pay attention to the same suppression area as the short-term high of 3402: 3405-3415; if gold touches this area and stagflation occurs, then it may form a secondary high in the short term, thereby hitting the firmness of the bulls' confidence and ushering in a retracement.
So next, I will test the gold short trade around the two areas of 3390-3395 and 3405-3415. Relatively speaking, the profit and loss ratio is still very favorable to us! But in the process of trading, we must strictly set up protection, after all, it is a counter-trend trade in the short term!
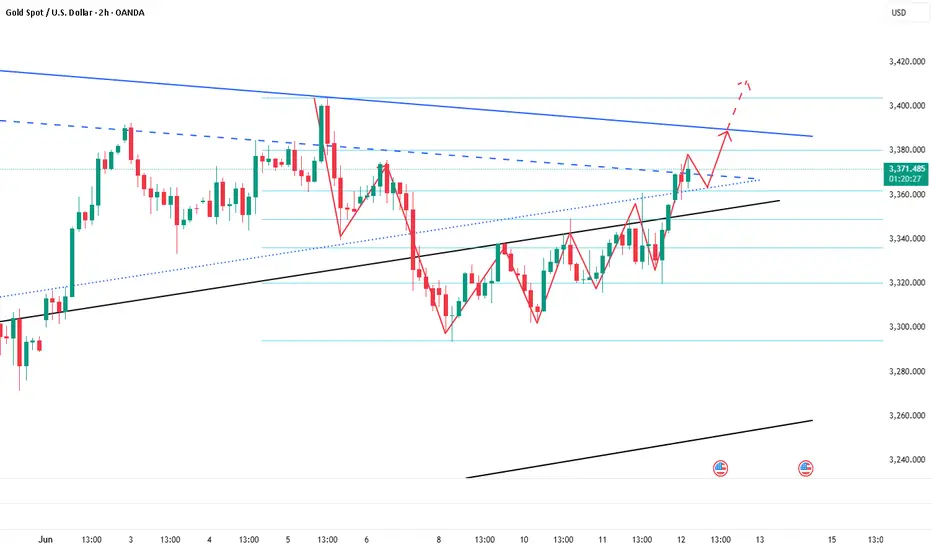
Buy gold, it is expected to continue to rise and test 3380-3390After the Asian session began, gold began to rise rapidly, and the original plan to short gold near 3355 had to be cancelled. After gold touched 3374, it fell back slightly, but after retreating to 3357, it rebounded again and broke through the short-term suppression near 3370 again. At present, gold still has the potential to rise further.
According to the current structure, gold has formed an oscillating upward structure, and the lows have been rising. After breaking through the short-term resistance area of 3360-3370, the willingness to rise has strengthened. Gold is expected to usher in a second rise and test the 3380-3390 area. If it breaks through this area, gold is even expected to continue to the 3410-3420 area. As gold rises, the gold support area rises to the 3360-3350 area.
So for short-term trading, we can try to go long on gold while controlling the risk after gold retreats to the 3360-3350 area!
Go with the flow and seize the gold trading opportunityGold rose and fell yesterday due to the influence of CPI data, and fluctuated violently during the session. There were obvious signs of a wash. In the evening, it rose again driven by the news, closed positive on the daily line, continued its strong upward trend at the opening and set a new high, showing an obvious bullish pattern. The overall structure maintains the bullish idea of low-long and trend-following.
From the 4H cycle, gold rose continuously after stepping back and stabilizing the middle track. The moving average system showed a bullish arrangement, and the Bollinger band opened and expanded, further confirming the continuation of the strong pattern. However, the current price is still running within the triangle convergence range, and has not yet effectively broken. It is not advisable to blindly chase more in the short term.
In terms of operation, it is recommended to take the step back and do more. Pay attention to the short-term support below the 3360-3358 range, and focus on the 3350-3340 range. You can rely on the support to arrange long orders in batches. Pay attention to the 3389 and 3400 areas on the upper short-term pressure. If the high is weak, you can try short-selling in combination with the actual trend.
Operation suggestion: It is recommended to buy gold near 3340-3350, and the target is 3366 and 3382. If it is strong, it is recommended to buy gold at the support of 3358-3360!
All recent trading strategies and ideas have been realized, and the point predictions are accurate. If your current gold operation is not ideal, we hope to help you avoid detours in your investment. Welcome to communicate with us!

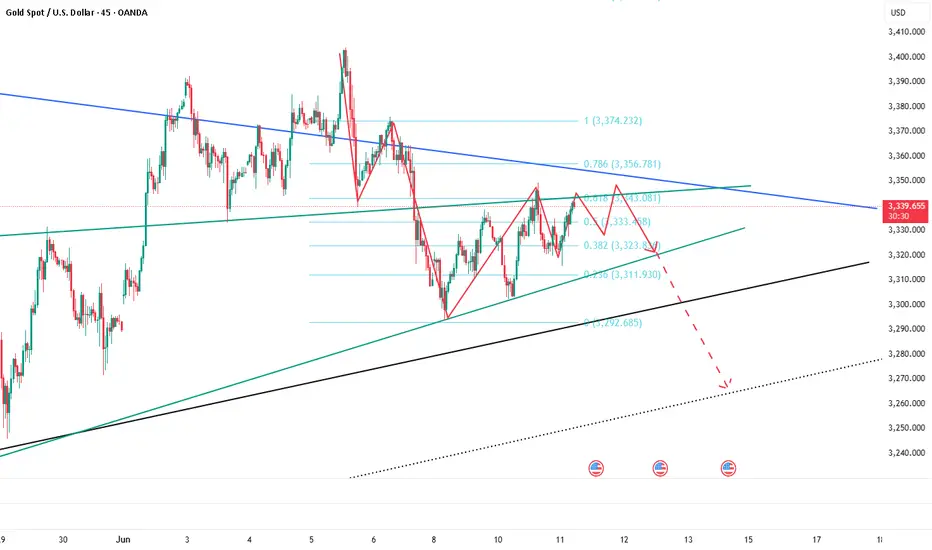
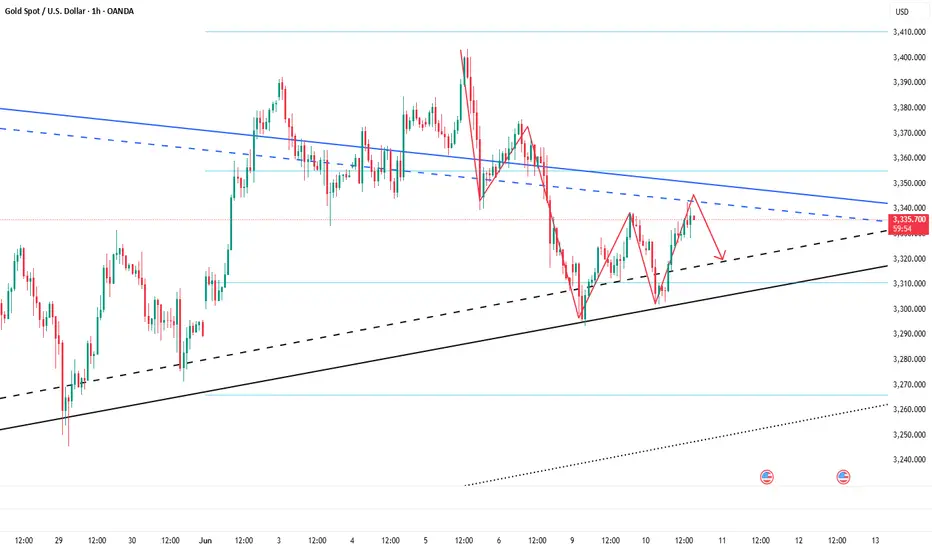
The gold trend is perfectly in line with expectations.The recent trend of gold is consistent with my expectations. Overall, the rebound is mainly based on fluctuating downward, and the rhythm of the oscillation between long and short positions is perfectly grasped. The upper resistance is still strong, and gold can still be shorted if the rebound is not broken.
From the current analysis of the gold trend, the lower support focuses on the area around 3315-3305. If it falls back to this position range, continue to look at the continuation of the rebound upward; the upper resistance focuses on the area around 3350-3362. The overall rhythm of the high-altitude and low-multiple range is still maintained, and the strategy is mainly to participate in the range back and forth.
1. Go long when gold falls back to 3315-3305, and the target is 3330-3340;
2. Go short when gold rebounds to 3350-3360, and the target is 3340-3330.

Insist on shorting gold on ralliesToday we made a total profit of 350 pips in 2 short trades. First, we shorted gold near 3345, and when gold fell to around 3330, we manually closed the order to lock in profits; the second time, gold rebounded sharply with the help of CPI data, and we seized the opportunity to short gold again near 3360, and ended the transaction by hitting TP: 3340. We accurately grasped the profit of gold shorting.
At present, gold is in a narrow range of fluctuations near the 3330 mark. Relatively speaking, gold is still in a weak position. Although gold has rebounded sharply with the help of the positive CPI data, it has shown a long upper shadow in the candle chart due to the rapid retracement, which has strengthened the resistance above and limited the rebound space of gold in the short term. In addition, the morphological structure shows signs of building a head and shoulders top structure. The resistance area in the short term is 3345-3355; followed by 3360-3370. Although gold is currently in a narrow range of fluctuations near the 3330 mark, it does not show obvious signs of support. It is easy to fall below the area near 3330 in a weak situation. The relatively strong support is in the 3320-3310 area, followed by the area near 3300-3290.
So for short-term trading, I still advocate taking the 3345-3355 area as resistance first and continue to short gold!

Gold rebound is still a short-selling opportunityFirst of all, let's take a look at why the market is still not reversing after a big rise, and there is a rapid rise and fall?
The data is bullish, and gold is rising rapidly, but we should pay attention to the sustainability of the rise, and secondly, the current trend direction. The overall trend of gold is still fluctuating downward recently, so even if the data is bullish, it is likely to just give an opportunity to "go high and short".
Although gold performed strongly after the data was released, it began to fall under pressure at the 3360 line, the trading concentration area of the last box shock, indicating that the bulls' volume is still not enough to break through the upper resistance. It is reasonable to rise and fall.
Since gold is currently in a market that is tempting to buy more, it means that the main trend is still bearish. The rebound is still dominated by short selling. The gold 1-hour cycle closed with a long upper shadow, indicating that the upward attack is weak, indicating that the area above 3350 is still a strong pressure area. This upward rush is just a short-term effort with the help of data benefits, which is a typical false breakthrough. Therefore, gold rebounded to the 3350-3360 area in the US market, and it is still dominated by high shorts.
This is the charm of the market - some people are always hesitant in the ups and downs, while others can always grasp the key turning points. The premise is to be able to see the trend clearly and follow the trend.
Don't be led by the market, but understand: Is the current fluctuation a trap or an opportunity?
If the direction is wrong, the effort will be in vain; if the direction is right, you will get twice the result with half the effort.
Don't make excuses for failure, just find ways to succeed. Have you found it?
All recent trading strategies and ideas have been realized, and the point predictions are accurate. If your current gold operation is not ideal, we hope to help you avoid detours in your investment. Welcome to communicate with us!

GOLD ROUTE MAP UPDATEHey Everyone,
Another solid day on the charts, with our analysis unfolding exactly as anticipated.
As mentioned yesterday, after the cross and lock above 3318, we identified a gap at 3352 that remained unfilled, acting as a magnet for price action. Since then, price has been consolidating in a tight range between 3318 and 3352.
Today, we saw a perfect move up, completing the target at 3352. From here, we’ll be watching for a confirmed cross and lock above 3352 for a continuation. If price fails to lock above, we could see rejections leading back into the lower Goldturns, where we’ll look for support and bounce.
We will keep the above in mind when taking buys from dips. Our updated levels and weighted levels will allow us to track the movement down and then catch bounces up.
We will continue to buy dips using our support levels taking 20 to 40 pips. As stated before each of our level structures give 20 to 40 pip bounces, which is enough for a nice entry and exit. If you back test the levels we shared every week for the past 24 months, you can see how effectively they were used to trade with or against short/mid term swings and trends.
The swing range give bigger bounces then our weighted levels that's the difference between weighted levels and swing ranges.
BULLISH TARGET
3318 - DONE
EMA5 CROSS AND LOCK ABOVE 3318 WILL OPEN THE FOLLOWING BULLISH TARGETS
3352 - DONE
EMA5 CROSS AND LOCK ABOVE 3352 WILL OPEN THE FOLLOWING BULLISH TARGET
3388
EMA5 CROSS AND LOCK ABOVE 3388 WILL OPEN THE FOLLOWING BULLISH TARGET
3428
EMA5 CROSS AND LOCK ABOVE 3428 WILL OPEN THE FOLLOWING BULLISH TARGET
3478
BEARISH TARGETS
3281
EMA5 CROSS AND LOCK BELOW 3281 WILL OPEN THE FOLLOWING BEARISH TARGET
3254
EMA5 CROSS AND LOCK BELOW 3254 WILL OPEN THE FOLLOWING BEARISH TARGET
3210
EMA5 CROSS AND LOCK BELOW 3210 WILL OPEN THE SWING RANGE
3179
3146
As always, we will keep you all updated with regular updates throughout the week and how we manage the active ideas and setups. Thank you all for your likes, comments and follows, we really appreciate it!
Mr Gold
GoldViewFX

Gold fluctuates repeatedly, and opportunities emerge!Gold was under pressure for the second time during the day, and the pressure at the 3349 line fell back. It continued to be treated with a fluctuating mindset. The 4H cycle observation showed that the Bollinger Bands were closing, and the K-line repeatedly interspersed around the middle track. The short-term structure tended to fluctuate upward. Pay attention to the 3348-3350 and 3362 pressure zones above, and the support below is located in the 3315 and 3302 areas. In terms of operation, the main long and auxiliary short ideas are maintained, and the guidance of CPI data is paid special attention.
Operational suggestions: Gold retreats to the 3315-3305 area and tries to arrange long orders, with the target looking at 3338 and 3349. A strong breakthrough can look up to 3360. If the 3350-3360 pressure zone above is not broken, short orders can be tried in the short term.
All recent trading strategies and ideas have been realized, and the point predictions are accurate. If your current gold operation is not ideal, we hope to help you avoid detours in your investment. Welcome to communicate with us!

Continue to short gold Gold rebounded from around 3315 and has now reached above 3340. According to the current structure, gold tends to rebound upward. But the characteristics of the recent market trends are also very obvious. Gold has risen with difficulty, but has retreated very quickly! Overall, there was no continuation in the process of long and short games, which was disorderly fluctuation.
According to the current structure, as long as gold cannot break through the 3350-3355 area and the bulls have not completely gained the upper hand, gold still has the potential to go down and test the 3320-3310 area again. Therefore, for short-term trading, we should not chase gold too much, and we can still try to short gold with the 3345-3355 area as resistance.
Gold V-shaped reversal still has room to rise In the morning, the market was under pressure at 3328, and two consecutive big negative lines fell to the low of 3302, breaking through the lower track of the descending flag consolidation channel, forming an effective break. 3317 was originally the confirmation point of the channel counter-pressure, and it was also the 618 split resistance at the time. Then the middle track was lost, and the trend was bearish, so it tried to rebound but continued to fall under pressure.
But the market immediately made a V-shaped reversal, breaking through the morning high of 3328, and had attacked to 3342 before the US market. The European session was volatile and strong, and with the help of a pullback before and after the U.S. session to lure short sellers, there is still hope for a second rise
The focus of the support for the retracement is on two positions: one is the 3322 line, corresponding to the middle track and 50% split support; the other is 3318, corresponding to the 618 split support. If it stabilizes after touching it, it will most likely point to the 3348 counter-pressure position.
If the pressure of 3348 cannot be broken, there is still a possibility of repeated fluctuations in the short term. It is necessary to pay attention to whether the secondary low point appears when it pulls back to further consolidate the support structure. If the market directly breaks through and stands above 3348, 3293 may have been confirmed as a short-term low.
The recent trading strategy ideas are all realized, and all the points are predicted accurately. If your current gold operation is not ideal, I hope I can help you avoid detours in your investment. Welcome to communicate with us!

Gold fluctuates repeatedly and opportunities emerge.Gold bottomed out in the Asian session and rebounded to break through the opening of the decline. The European session continued to break through yesterday's high. The US session continued to break through the key pressure position of 3335-3345, and walked out of the standard strong cycle. After the break, it is necessary to change the thinking and follow the trend to be bullish. Pay attention to the support below 3315-3325. In terms of operation, it is mainly long when it falls back. The upper side gradually looks to 3352 and 3365. If the pressure is not broken, look at the falling space!
Operation suggestion: Go long when gold falls back to 3325-3315, and look at 3338 and 3352! If the pressure above 3352 and 3365 is not broken, you can short!
The recent trading strategy ideas are all realized, and all the points are predicted accurately. If your current gold operation is not ideal, I hope I can help you avoid detours in your investment. Welcome to communicate with us!

GOLD ROUTE MAP UPDATEHey Everyone,
Quick update following on from yesterday’s post.
As expected, we got the push up after the EMA5 cross and lock above 3318, but price just fell short of our bullish target at 3352, leaving it open. This level now acts as a magnet, with price currently playing between 3318 and 3352, creating a tight range.
We're watching closely for tests on both 3318 and 3352, with direction confirmed only by EMA5 cross and lock. The gap to 3352 still remains, so any bullish momentum should aim to fill this cleanly.
Until one of these levels breaks with confirmation, we’ll likely continue seeing choppy movement in this range. We’ll keep using dips into support for intraday buys, targeting our usual 20–40 pip bounce trades as structure allows.
Once again, thank you all for your ongoing support and engagement, we’ll continue to keep you updated throughout the week, as price unfolds and setups confirm.
Mr Gold
GoldViewFX

Another try on the gold short tradeTo be honest, it was beyond my expectation that gold could continue to rebound above 3340. According to my original expectation, the upper limit of gold's rebound in the short term was around 3336-3338. However, gold has already touched around 3342 during the rebound, but because gold failed to close above 3345, I still advocate shorting gold in batches in the 3335-3345 area.
Recently, both the long and short sides of gold have not continued, and the overall market tends to be volatile. In the short term, as long as gold does not break through 3345, gold still has a chance to retrace, which also means that the rebound is an opportunity for us to short gold, but with the rebound of gold, we need to moderately reduce the expectation of gold retracement, so for short-term short gold, our primary retracement target is in the 3325-3320 area.
So for short-term trading, I think we can still try to short gold again!
Perfect grasp of the high altitude and low multi rhythm!The current trend of gold continues yesterday's trend, maintaining a high rebound and volatile market. But don't panic, focus on the performance of the rebound. If the rebound fails to break through the upper resistance level, continue to focus on shorting. The upper suppression area is locked at the 3335-3345 line. Although the bullish performance has been strengthened, if it cannot effectively break through this range, it is still a short-term weak signal. From the current market, the upper pressure is obvious, and the rebound can rely on this range to layout the main short, focusing on the continuation of the decline. The lower support focuses on the 3293-3300 integer mark, and the overall long and short wide range of volatile market is maintained. Before the daily level fails to effectively break through and stand firm at the 3345 mark, it is difficult to say that the bulls will turn strong, and operations need to be cautious. If the market adjusts, the strategy will be updated simultaneously.
Operation strategy suggestion: Gold rebounds to the 3335-3345 first-line area to choose the opportunity to short, target the 3295-3306 range, strictly control risks, and follow the trend.
