Best GOLD XAUUSD Consolidation Trading Strategy Explained
In article , you will learn how to identify and trade consolidation on Gold easily.
I will share with you my consolidation trading strategy and a lot of useful XAUUSD trading tips.
1. How to Identify Consolidation
In order to trade consolidation, you should learn to recognize that.
The best and reliable way to spot consolidation is to analyse a price action.
Consolidation is the state of the market when it STOPS updating higher highs & higher lows in a bullish trend OR lower lows & lower highs in a bearish trend.
In other words, it is the situation when the market IS NOT trending.
Most of the time, during such a period, the price forms a horizontal channel.
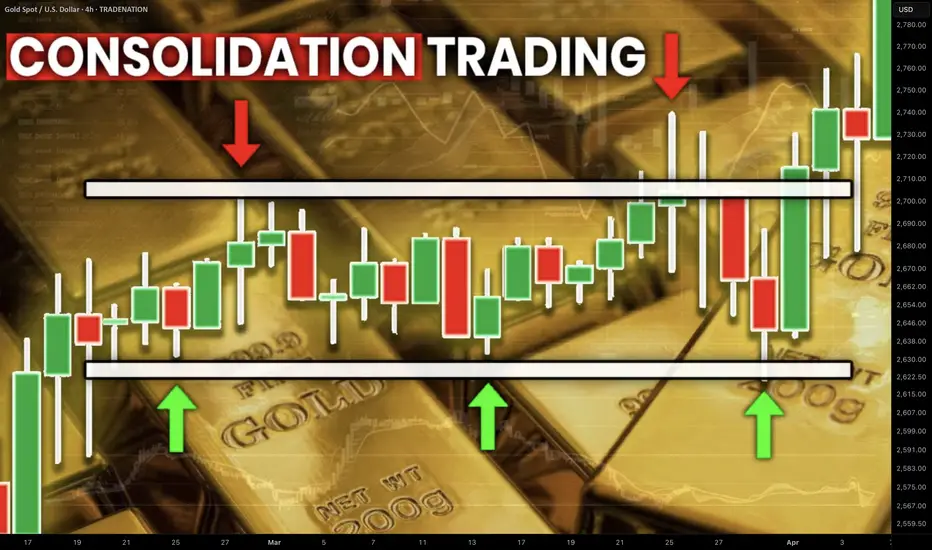
Above is a perfect example of a consolidation on Gold chart on a daily.
We see a horizontal parallel channel with multiple equal or almost equal highs and lows inside.
For a correct trading of a consolidation, you should correctly underline its boundaries.
Following the chart above, the upper boundary - the resistance, is based on the highest high and the highest candle close.
The lowest candle close and the lowest low compose the lower boundary - the support.
2. What Consolidation Means
Spotting the consolidating market, it is important to understand its meaning and the processes that happen inside.
Consolidation signifies that the market found a fair value.
Growth and bullish impulses occur because of the excess of demand on the market, while bearish moves happen because of the excess of supply.
When supply and demand find a balance, sideways movements start .
Look at the price movements on Gold above.
First, the market was rising because of a strong buying pressure.
Finally, the excess of buying interest was curbed by the sellers.
The market started to trade with a sideways range and found the equilibrium
At some moment, demand started to exceed the supply again and the consolidation was violated . The price updated the high and continued growth.
Usually, the violation of the consolidation happens because of some fundamental event that makes the market participants reassess the value of the asset.
At the same time, the institutional traders, the smart money accumulate their trading positions within the consolidation ranges. As the accumulation completes, they push the prices higher/lower, violating the consolidation.
3. How to Trade Consolidation
Once you identified a consolidation on Gold, there are 2 strategies to trade it.
The resistance of the consolidation provides a perfect zone to sell the market from. You simply put your stop loss above the resistance and your take profit should be the upper boundary of the support.
That is the example of a long trade from support of the consolidation on Gold.
The support of the sideways movement will be a safe zone to buy Gold from. Stop loss will lie below the support zone, take profit will be the lower boundary of the resistance.
AS the price reached a take profit level and tested a resistance, that is a short trade from that.
You can follow such a strategy till the price violates the consolidation and establishes a trend.
The market may stay a very extended period of time in sideways, providing a lot of profitable trading opportunities.
What I like about Gold consolidation trading is that the strategy is very straightforward and completely appropriate for beginners.
It works on any time frame and can be used for intraday, swing trading and scalping
❤️Please, support my work with like, thank you!❤️
I am part of Trade Nation's Influencer program and receive a monthly fee for using their TradingView charts in my analysis.
Goldtradingstrategy
Gold trading insights: 19-MAR-2025Gold trading insights for today: Explore our zones for informed decision-making.

GOLD ROUTE MAP UPDATEHey Everyone,
Another great day on the charts once again with our analysis playing out to perfection!!
After completing our 2993 Bullish target yesterday, we stated that we now have a ema5 lock above 2993 opening 3011. This target was hit today just like we said, followed with a further cross and lock above 3011 opening 3029, which was also hit today completing this range.
We now have a lock above 3029 opening 3049. We now need to keep in mind we have had no corrections from the last two days momentum. Failure to lock above the next level will follow with a rejection to find support at the lower Goldturns for bounce and then further cross and locks will confirm the next range for us.
We will keep the above in mind when taking buys from dips. Our updated levels and weighted levels will allow us to track the movement down and then catch bounces up.
We will continue to buy dips using our support levels taking 30 to 40 pips. As stated before each of our level structures give 20 to 40 pip bounces, which is enough for a nice entry and exit. If you back test the levels we shared every week for the past 24 months, you can see how effectively they were used to trade with or against short/mid term swings and trends.
BULLISH TARGET
2993 - DONE
EMA5 CROSS AND LOCK ABOVE 2993 WILL OPEN THE FOLLOWING BULLISH TARGET
3011 - DONE
EMA5 CROSS AND LOCK ABOVE 3011 WILL OPEN THE FOLLOWING BULLISH TARGET
3029 - DONE
EMA5 CROSS AND LOCK ABOVE 3029 WILL OPEN THE FOLLOWING BULLISH TARGET
3049
EMA5 CROSS AND LOCK ABOVE 3049 WILL OPEN THE FOLLOWING BULLISH TARGET
3068
BEARISH TARGETS
2968
EMA5 CROSS AND LOCK BELOW 2968 WILL OPEN THE FOLLOWING BEARISH TARGET
2942
EMA5 CROSS AND LOCK BELOW 2942 WILL OPEN THE FOLLOWING BEARISH TARGET
2922
EMA5 CROSS AND LOCK BELOW 2922 WILL OPEN THE SWING RANGE
SWING RANGE
2906 - 2886
As always, we will keep you all updated with regular updates throughout the week and how we manage the active ideas and setups. Thank you all for your likes, comments and follows, we really appreciate it!
Mr Gold
GoldViewFX

Last chance to short gold💡Today, gold hit a low of around 2980 during its decline. Obviously, gold's decline has not reached its peak! There is still demand for gold to continue to retreat.
💡At present, gold has rebounded to above 2998 again, but gold has not broken through the 3005-3010 zone during multiple rebound tests. The upper space has been compressed smaller and smaller, and the bullish momentum has been largely consumed. Gold is expected to seek a breakthrough downward;
💡In the process of multiple rebounds, the momentum of the rebound has gradually weakened, the bull market confidence above 3000 is not strong, the confidence of bulls is not firm, and after the profit realization and selling psychology gradually gain the upper hand, gold is likely to have a flash crash!
📉So we can short gold in the 3000-3010 zone! The first target: 2985-2975, followed by 2965-2955
📞Trading means that everything has results and everything has feedback. I have been committed to market trading and trading strategy sharing, striving to improve the winning rate of trading and maximize profits. If you want to copy trading signals to make a profit, or master independent trading skills and thinking, you can follow the channel at the bottom of the article to copy trading strategies and signals

THE KOG REPORT - UpdateEnd of day update from us here at KOG:
Not a bad start to the week with the lower Red box support which was active holding price and giving the push up early session completing the first red box target. Since that we've experience accumulation and ranging which allowed us a short trade on the indicator and then a nice long to end the day, which is now protected and managed.
We'll stick with the plan at the moment expecting a spike up with the first region being 3006 and above that 3010. Again, a bit high to even attempt a long as traders will want to see if we can hold above the 3000 level, until then, we'll look for the potential RIP.
KOG’s bias for the week:
Bearish below 2995 with targets below 2970, 2965, 2955 and below that 2950
Bullish on break of 2995 with targets above 3003, 3006, 3010, 3016 and above that 3020
RED BOXES:
Break above 2995 for 2997✅, 3003, 3009, 3016 and 3021 in extension of the move
Break below 2980 for 2975, 2971, 2965, 2959, 2955 and 2945 in extension of the move
Short and simple this week, let’s see how the week plays out and remember, your risk model is there to protect you, use it, keep your losers small and your winners big!
Please do support us by hitting the like button, leaving a comment, and giving us a follow. We’ve been doing this for a long time now providing traders with in-depth free analysis on Gold, so your likes and comments are very much appreciated.
As always, trade safe.
KOG

GOLD ROUTE MAP UPDATEHey Everyone,
Great start top the week with our chart idea already kicked off with our first Bullish target hit at 2993. We are now seeing a lock above 2993 opening 3011. Failure to lock above will follow with a rejection to find support at the lower Goldturns for bounce and then further cross and locks will confirm the next range for us.
We will keep the above in mind when taking buys from dips. Our updated levels and weighted levels will allow us to track the movement down and then catch bounces up.
We will continue to buy dips using our support levels taking 30 to 40 pips. As stated before each of our level structures give 20 to 40 pip bounces, which is enough for a nice entry and exit. If you back test the levels we shared every week for the past 24 months, you can see how effectively they were used to trade with or against short/mid term swings and trends.
BULLISH TARGET
2993 - DONE
EMA5 CROSS AND LOCK ABOVE 2993 WILL OPEN THE FOLLOWING BULLISH TARGET
3011
EMA5 CROSS AND LOCK ABOVE 3011 WILL OPEN THE FOLLOWING BULLISH TARGET
3039
EMA5 CROSS AND LOCK ABOVE 3039 WILL OPEN THE FOLLOWING BULLISH TARGET
3049
EMA5 CROSS AND LOCK ABOVE 3049 WILL OPEN THE FOLLOWING BULLISH TARGET
3068
BEARISH TARGETS
2968
EMA5 CROSS AND LOCK BELOW 2968 WILL OPEN THE FOLLOWING BEARISH TARGET
2942
EMA5 CROSS AND LOCK BELOW 2942 WILL OPEN THE FOLLOWING BEARISH TARGET
2922
EMA5 CROSS AND LOCK BELOW 2922 WILL OPEN THE SWING RANGE
SWING RANGE
2906 - 2886
As always, we will keep you all updated with regular updates throughout the week and how we manage the active ideas and setups. Thank you all for your likes, comments and follows, we really appreciate it!
Mr Gold
GoldViewFX

The bear is coming soon, TP: 2965-2955Bros, bears are about to see the dawn!
Gold is fiercely fighting for control in the 2985-3000 zone. Although the winner has not been completely decided, the balance of victory is tilting towards the bears!
As gold stands above the 3000 mark, the upper space is relatively compressed, and the liquidity is getting lower and lower. Gold needs to retreat to increase liquidity! Judging from the candle chart, gold stood above 3000 twice and then quickly fell back, forming two obvious upper shadow lines, indicating that the bull market is not completely convincing, and it is very likely that a double-top structure will be technically constructed to further stimulate the decline of gold!
At present, gold has not been able to effectively fall below 2880. In addition to having a certain support structure, it is more likely to be a bull market trap! So in the next short-term trading, I do not recommend continuing to chase gold. You can use the 3005-3015 zone as resistance and boldly short gold! Then wait patiently for gold to fall back to the 2965-2955 zone.
Trading means that everything has results and everything has feedback. I have been committed to market trading and trading strategy sharing, striving to improve the winning rate of trading and maximize profits. If you want to copy trading signals to make a profit, or master independent trading skills and thinking, you can follow the channel at the bottom of the article to copy trading strategies and signals

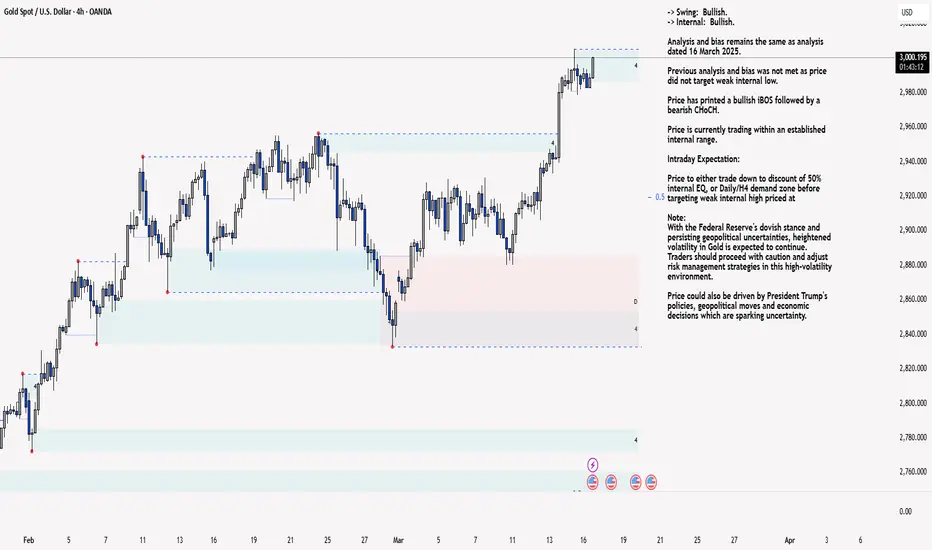
XAU/USD 17 March 2025 Intraday AnalysisH4 Analysis:
-> Swing: Bullish.
-> Internal: Bullish.
Analysis and bias remains the same as analysis dated 16 March 2025.
Previous analysis and bias was not met as price did not target weak internal low.
Price has printed a bullish iBOS followed by a bearish CHoCH.
Price is currently trading within an established internal range.
Intraday Expectation:
Price to either trade down to discount of 50% internal EQ, or Daily/H4 demand zone before targeting weak internal high priced at
Note:
With the Federal Reserve's dovish stance and persisting geopolitical uncertainties, heightened volatility in Gold is expected to continue. Traders should proceed with caution and adjust risk management strategies in this high-volatility environment.
Price could also be driven by President Trump's policies, geopolitical moves and economic decisions which are sparking uncertainty.
H4 Chart:
M15 Analysis:
-> Swing: Bullish.
-> Internal: Bullish.
Price has printed a bearish CHoCH confirming internal range, however, price has not in any way pulled back significantly enough to classify current internal high as an iBOS, should price print higher than current internal high.
Remainder of analysis and bias remains the same as yesterday's analysis dated 13 March 2025
Analysis and bias has not been met, largely due macroeconomic events, particularly the Trump trade tariff war, which is causing uncertainty within the markets which is supporting Gold price.
Price has printed a bullish iBOS.
Within the structure following the iBOS, price has printed a several bearish CHoCH's with very minimal pullbacks before continuing bullish.
In order not to distort internal structure range I will apply discretion and not classify bearish CHoCH without considerable pullback.
Intraday Expectation:
Await for price to print Bearish CHoCH which is supported by a pullback relative to recent price action.
Note:
With the Federal Reserve maintaining a dovish stance and ongoing geopolitical tensions, volatility in Gold prices is expected to remain elevated. Traders should exercise caution, adjust risk management strategies, and stay prepared for potential price whipsaws in this high-volatility environment.
M15 Chart:
Gold market analysis: 17-MAR-2025Good morning! Happy New Week! Happy New Day! Here's your daily Gold market analysis. Learn, grow, and trade wisely.

GOLD 1H CHART ROUTE MAP & TRADING PLAN FOR THE WEEKHey Everyone,
Please see our updated 1h chart levels and targets for the coming week.
We are seeing price play between two weighted levels with a gap above at 2993 and a gap below at 2968. We will need to see ema5 cross and lock on either weighted level to determine the next range.
We will see levels tested side by side until one of the weighted levels break and lock to confirm direction for the next range.
We will keep the above in mind when taking buys from dips. Our updated levels and weighted levels will allow us to track the movement down and then catch bounces up.
We will continue to buy dips using our support levels taking 30 to 40 pips. As stated before each of our level structures give 20 to 40 pip bounces, which is enough for a nice entry and exit. If you back test the levels we shared every week for the past 24 months, you can see how effectively they were used to trade with or against short/mid term swings and trends.
BULLISH TARGET
2993
EMA5 CROSS AND LOCK ABOVE 2993 WILL OPEN THE FOLLOWING BULLISH TARGET
3011
EMA5 CROSS AND LOCK ABOVE 3011 WILL OPEN THE FOLLOWING BULLISH TARGET
3039
EMA5 CROSS AND LOCK ABOVE 3039 WILL OPEN THE FOLLOWING BULLISH TARGET
3049
EMA5 CROSS AND LOCK ABOVE 3049 WILL OPEN THE FOLLOWING BULLISH TARGET
3068
BEARISH TARGETS
2968
EMA5 CROSS AND LOCK BELOW 2968 WILL OPEN THE FOLLOWING BEARISH TARGET
2942
EMA5 CROSS AND LOCK BELOW 2942 WILL OPEN THE FOLLOWING BEARISH TARGET
2922
EMA5 CROSS AND LOCK BELOW 2922 WILL OPEN THE SWING RANGE
SWING RANGE
2906 - 2886
As always, we will keep you all updated with regular updates throughout the week and how we manage the active ideas and setups. Thank you all for your likes, comments and follows, we really appreciate it!
Mr Gold
GoldViewFX

GOLD 4H CHART ROUTE MAP & TRADING PLAN FOR THE WEEKHey Everyone,
Please see our updated 4h chart levels and targets for the coming week.
We are seeing price play between two weighted levels with a gap above at 3005 and a gap below at 2972. We will need to see ema5 cross and lock on either weighted level to determine the next range.
We will see levels tested side by side until one of the weighted levels break and lock to confirm direction for the next range.
We will keep the above in mind when taking buys from dips. Our updated levels and weighted levels will allow us to track the movement down and then catch bounces up.
We will continue to buy dips using our support levels taking 30 to 40 pips. As stated before each of our level structures give 20 to 40 pip bounces, which is enough for a nice entry and exit. If you back test the levels we shared every week for the past 24 months, you can see how effectively they were used to trade with or against short/mid term swings and trends.
BULLISH TARGET
3005
EMA5 CROSS AND LOCK ABOVE 3005 WILL OPEN THE FOLLOWING BULLISH TARGET
3033
EMA5 CROSS AND LOCK ABOVE 3033 WILL OPEN THE FOLLOWING BULLISH TARGET
3059
EMA5 CROSS AND LOCK ABOVE 3059 WILL OPEN THE FOLLOWING BULLISH TARGET
3090
EMA5 CROSS AND LOCK ABOVE 3090 WILL OPEN THE FOLLOWING BULLISH TARGET
3117
BEARISH TARGETS
2972
EMA5 CROSS AND LOCK BELOW 2972 WILL OPEN THE FOLLOWING BEARISH TARGET
2947
EMA5 CROSS AND LOCK BELOW 2947 WILL OPEN THE FOLLOWING BEARISH TARGET
2918
EMA5 CROSS AND LOCK BELOW 2918 WILL OPEN THE SWING RANGE
SWING RANGE
2889 - 2857
As always, we will keep you all updated with regular updates throughout the week and how we manage the active ideas and setups. Thank you all for your likes, comments and follows, we really appreciate it!
Mr Gold
GoldViewFX

GOLD DAILY CHART MID/LONG TERM UPDATEHey Everyone,
This is an update on our daily chart idea that we are now tracking for a while now. If you have only started following us, please read the updates below from previous weeks.
Last week we stated that we had a candle body close above 2904 opening 2959 with ema5 lock to further confirm this. This played out perfectly completing this target and also perfectly inline with the channel top. We will now expect some resistance here on the channel top to then provide support on the lower levels and slowly ascend up the channel over a longer term. However, if we see ema5 lock outside the channel then we will look for support outside the channel on the channel top for a continuation.
This is the beauty of our Goldturn channels, which we draw in our unique way, using averages rather than price. This enables us to identify fake-outs and breakouts clearly, as minimal noise in the way our channels are drawn.
We will use our smaller timeframe analysis on the 1H and 4H chart to buy dips from the weighted Goldturns for 30 to 40 pips clean. Ranging markets are perfectly suited for this type of trading, instead of trying to hold longer positions and getting chopped up in the swings up and down in the range.
We will keep the above in mind when taking buys from dips. Our updated levels and weighted levels will allow us to track the movement down and then catch bounces up using our smaller timeframe ideas.
Our long term bias is Bullish and therefore we look forward to drops from rejections, which allows us to continue to use our smaller timeframes to buy dips using our levels and setups.
Buying dips allows us to safely manage any swings rather then chasing the bull from the top.
Thank you all for your likes, comments and follows, we really appreciate it!
Mr Gold
GoldViewFX
LAST WEEK UPDATE
The half line of our unique channel gave the perfect bounce into the next axis target at 2904, inline with our plans to buy dips just like we stated. We now have a body close once again with ema5 cross and lock above 2904 leaving the range above open. We will continue to look for support at the ascending half-line of the channel, as we climb into the range.
PREVIOUS WEEKS UPDATE
After completing our Bullish targets we stated that the channel top will act as resistance confirmed with ema5 rejection. A break of the channel top with ema5 would confirm a continuation and failure would confirm rejection. This allowed us to identify true breakouts against fake outs.
We also stated that we need to keep in mind the channel half line below to establish floor to provide support for the range, should we continue to track further up. A break below the half line will open the lower part of the channel to establish floor on the channel bottom. The safest way to track this movement is by buying dips.
- Once again this played out perfectly as we got the rejection on the channel top followed with the channel half line test, which gave the perfect bounce like we stated. We will now either look for a continuation from this bounce or a cross and lock below the half line for a break into the lower channel floor.

GOLD WEEKLY CHART MID/LONG TERM ROUTE MAPHey Everyone,
Please see update on the weekly chart idea that we have been tracking for over a while now and now fully complete.
After completing 2856 target, we were left with candle body close above 2856 leaving a gap to 2976 but needed ema5 lock to further confirm this. We then had the ema5 lock last week to further confirm the long range gap above. This gap was completed last week completing this chart idea and with plenty of time for us to get in for the action, just perfect!!!
This is the beauty of our channels, which we draw in our unique way, using averages rather than price. This enables us to identify fake-outs and breakouts clearly, as minimal noise in the way our channels are drawn.
We will now update a new weekly chart idea for our long term analysis, targets and gaps next week. Please keep an eye out for it.
Thank you all for your likes, comments and follows, we really appreciate it!
Mr Gold
GoldViewFX

GOLD ROUTE MAP UPDATEHey Everyone,
What a PIPTASTIC finish to the week with our chart idea now complete with our final target at 3005 now done.
We started the week with our 2918 Bullish target hit, followed with cross and lock in each stage of the range, completing 2947 and 2978 and now today confirmed a further lock opening 3005, which was hit and completed perfectly!!
The power of our algo levels, even at a new range is being respected to perfection!!
BULLISH TARGET
2918 - DONE
EMA5 CROSS AND LOCK ABOVE 2918 WILL OPEN THE FOLLOWING BULLISH TARGET
2947 - DONE
EMA5 CROSS AND LOCK ABOVE 2947 WILL OPEN THE FOLLOWING BULLISH TARGET
2978 - DONE
BEARISH TARGETS
2889 - DONE
We will now come back Sunday with our updated Multi time-frame analysis, Gold route map and trading plans for the week ahead and also a new Daily chart long term chart idea, now that this one is complete.
Have a smashing weekend!! And once again, thank you all for your likes, comments and follows, we really appreciate it!
Mr Gold
GoldViewFX

Gold is about to plummet, double short gold!Brothers, gold accelerated to around 2985, but it could not cross 2990. The closer it is to the 3000 mark, the greater the resistance it faces. After the news is digested by the market to a certain extent, it is difficult for gold to have enough momentum to continue to break through the 2990-3000 market psychological mark in the short term, so a retracement will inevitably follow!
The accelerated squeeze of gold has been separated from the technical side. After the news returns to normal, gold will inevitably have a technical retracement demand, so we can boldly short gold again in the 2985-2990 area! Tomorrow, Friday, will definitely be a turning point. Gold will at least retrace to the 2950-2940 zone tomorrow, and may even extend to the area around 2935.
So in short-term trading, I still insist on using double trading lots to short gold at 2985-2990! Looking forward to making a profit of 400-500 pips in the short term!Trading means that everything has results and everything has feedback. I have been committed to market trading and trading strategy sharing, striving to improve the winning rate of trading and maximize profits. If you want to copy trading signals to make a profit, or master independent trading skills and thinking, you can follow the channel at the bottom of the article to copy trading strategies and signals

Short positions are in trouble, how to get out of trouble?Bros, gold accelerated to above 2980 today under the stimulation of news. If you hold a short position in gold, you must be in a trading dilemma, so how to get rid of the trading dilemma has become the current primary goal.
First remember the key node, Thursday. Under normal circumstances, Thursday and Friday are the nodes most likely to cause market changes! And from the candle chart, it is just pulled back to the high area with the stimulation of news. From the regional conversion, we can clearly see that according to the current momentum of gold, it will only reach the area around 2980-2982 (there may be a technical false breakthrough). It is difficult to rise to the vicinity of the 3000 mark in one fell swoop.
If you still have sufficient margin levels to help you get out of trouble, you might as well consider adding more positions near 2980 to continue shorting gold, effectively raising your average cost price. After gold falls back, you can choose to close all short positions and turn losses into profits. However, because gold has risen sharply, we must lower our expectations for the extent of gold's retracement. If gold retraces to the 2940-2930 area, we can consider closing our positions, so that we can turn losses into profits! And I predict that gold will enter a correction market tomorrow at the latest!
Trading means that everything has results and everything has feedback. I have been committed to market trading and trading strategy sharing, striving to improve the winning rate of trading and maximize profits. If you want to copy trading signals to make a profit, or master independent trading skills and thinking, you can follow the channel at the bottom of the article to copy trading strategies and signals

GOLD 1H AND 4H CHART ROUTE MAP UDATEHey Everyone,
Once again a smashing day on the markets with both our 1h and 4h charts, playing out as analysed.
We got our Bullish targets 2922, 2947 and 2968 all completed on our 1h chart, confirmed with cross and lock, giving us enough time from confirmation to target being hit.
Please see our 4h chart below, also completing our target at 2947, which we confirmed was open yesterday, giving enough time for the target to be hit today and now also finished off with 2978. We will now look for a test and lock for a further continuation or failure to lock above will see a rejection to find support at the lower Goldturns for support and bounce.
We will keep the above in mind when taking buys from dips. Our updated levels and weighted levels will allow us to track the movement down and then catch bounces up.
We will continue to buy dips using our support levels taking 30 to 40 pips. As stated before each of our level structures give 20 to 40 pip bounces, which is enough for a nice entry and exit. If you back test the levels we shared every week for the past 24 months, you can see how effectively they were used to trade with or against short/mid term swings and trends.
BULLISH TARGET
2922 - DONE
EMA5 CROSS AND LOCK ABOVE 2922 WILL OPEN THE FOLLOWING BULLISH TARGET
2947 - DONE
EMA5 CROSS AND LOCK ABOVE 2947 WILL OPEN THE FOLLOWING BULLISH TARGET
2968 DONE
As always, we will keep you all updated with regular updates throughout the week and how we manage the active ideas and setups. Thank you all for your likes, comments and follows, we really appreciate it!
Mr Gold
GoldViewFX

Gold is about to plunge, stick to short positions!Bros, Good morning,I made it very clear yesterday that 2935-2945 is definitely a good opportunity to sell gold. I still stick to my point of view and insist on holding my short position.
To be honest, the continuity of the market news stimulating the rise of gold is not strong. After the rise of gold hits 2946, it faces the suppression of the previous high near 2955. With the current momentum of gold, it is impossible to break through the high suppression area in one go. Even if it is to accumulate more momentum for a breakthrough, gold will have a deep need to step back to the 2920-2910 zone. So I remain positive on short positions in the short term.
In addition, it is particularly important to note that gold is facing high pressure, and there may be many temptations to do long signals. Now you must keep a clear mind and not be confused by the temptation signals. When you chase long gold at a high position, once gold retreats, you may be deeply trapped and it will be difficult to get out!
Do you think gold will fall back to the 2920-2910 zone as expected? Trading means that everything has results and everything has feedback. I have been committed to market trading and trading strategy sharing, striving to improve the winning rate of trading and maximize profits. If you want to copy trading signals to make a profit, or master independent trading skills and thinking, you can follow the channel at the bottom of the article to copy trading strategies and signals

Be sure to short gold!Expected profit: 150-300 pipsBros, be sure to be short gold and never miss the profits in every swing.As I said in my last article, the 2935-2945 zone is worth selling gold, and I have shorted gold in this area according to the trading plan. Have you shorted gold with me?
Although gold once rose to around 2940 under the stimulation of news, I think the accelerated rise of gold was suspected of short squeeze, and after the market calmed down, gold will return to the technical level and have a need for retracement. However, as gold breaks through the oscillation range upward, the lower support will move up to the 2920-2910 zone.
Therefore, our primary target for shorting gold in the short term is the 2920-2910 zone. If gold falls back to this area as expected, then in the short term, we will still gain 150-300 pips of profit, which is still a good return for short-term trading!
Do you think gold will fall back to the 2920-2910 zone as expected? Trading means that everything has results and everything has feedback. I have been committed to market trading and trading strategy sharing, striving to improve the winning rate of trading and maximize profits. If you want to copy trading signals to make a profit, or master independent trading skills and thinking, you can follow the channel at the bottom of the article to copy trading strategies and signals

A good opportunity to short gold, do you want to miss it?Because Trump mentioned the issue of tariffs, gold prices soared and broke through the recent range of fluctuations, reaching around 2938.
Gold prices soared due to the impact of the news, so the continuity is probably not strong. Gold is likely to return to the technical level of 2920-2910 in a short period of time; in addition, the accelerated rise of gold already means a short squeeze, and the top is facing strong pressure from the previous high area, and gold is likely to rise and then fall back.
Therefore, in terms of short-term trading, I don’t think it is a wise choice to continue to chase the rise of gold. On the contrary, I think that the rise of gold is a good opportunity to short, and the 2935-2945 zone is also worth selling gold.
Trading means that everything has results and everything has feedback. I have been committed to market trading and trading strategy sharing, striving to improve the winning rate of trading and maximize profits. If you want to copy trading signals to make a profit, or master independent trading skills and thinking, you can follow the channel at the bottom of the article to copy trading strategies and signals

GOLD 4H CHART ROUTE MAP UPDATEHey Everyone,
Another great day on the markets today once again. Yesterday we updated our 1H CHART IDEA and today we update our 4H CHART IDEA.
Great start with our Bullish target hit at 2889 earlier this week followed with no cross and lock confirming the rejection and support for the bounce into 2918 completing our Bullish target. We now have a lock above 2918 opening 2947. We will look for a test and lock for a further continuation or failure to lock above will see a rejection to find support at the lower Goldturns for support and bounce.
We will see levels tested side by side until one of the weighted levels break and lock to confirm direction for the next range.
We will keep the above in mind when taking buys from dips. Our updated levels and weighted levels will allow us to track the movement down and then catch bounces up.
We will continue to buy dips using our support levels taking 30 to 40 pips. As stated before each of our level structures give 20 to 40 pip bounces, which is enough for a nice entry and exit. If you back test the levels we shared every week for the past 24 months, you can see how effectively they were used to trade with or against short/mid term swings and trends.
BULLISH TARGET
2918 - DONE
EMA5 CROSS AND LOCK ABOVE 2918 WILL OPEN THE FOLLOWING BULLISH TARGET
2947
EMA5 CROSS AND LOCK ABOVE 2947 WILL OPEN THE FOLLOWING BULLISH TARGET
2978
BEARISH TARGETS
2889 - DONE
EMA5 CROSS AND LOCK BELOW 2889 WILL OPEN THE FOLLOWING BEARISH TARGET
2857
EMA5 CROSS AND LOCK BELOW 2857 WILL OPEN THE SWING RANGE
SWING RANGE
2813 - 2772
As always, we will keep you all updated with regular updates throughout the week and how we manage the active ideas and setups. Thank you all for your likes, comments and follows, we really appreciate it!
Mr Gold
GoldViewFX

XAU/USD 12 March 2024 Intraday AnalysisH4 Analysis:
-> Swing: Bullish.
-> Internal: Bearish.
Analysis/Bias remains the same as analysis dated 07 March 2024.
Price has printed a bullish CHoCH according to analysis and bias dated 28 February 2025.
Price is currently trading within an established internal range.
Intraday Expectation:
Price is now trading in premium of 50% internal EQ where we could see a reaction at any point. Price could also target H4 supply zone before targeting weak internal low, priced at 2,832.720
Note:
With the Federal Reserve's dovish stance and persisting geopolitical uncertainties, heightened volatility in Gold is expected to continue. Traders should proceed with caution and adjust risk management strategies in this high-volatility environment.
Price could also be driven by President Trump's policies, geopolitical moves and economic decisions which are sparking uncertainty.
H4 Chart:
M15 Analysis:
-> Swing: Bullish.
-> Internal: Bearish.
Analysis and bias remains the same as analysis dated 03 March 2023.
As mentioned in my analysis dated 28 February 2025, whereby price printed a bullish CHoCH but stated I would continue to monitor price.
On this occasion I have marked the previous bullish CHoCH in red as price did not pull back deeply enough to warrant internal structure breaks, additionally, there was minimal time spent .
Price has printed a further bullish CHoCH which is now confirmed. Price is not trading within an established internal range.
Intraday Expectation:
Price to continue bullish, react at either premium of internal 50% EQ, or M15 supply zone before targeting weak internal low priced at 2,832.720.
Note:
With the Federal Reserve maintaining a dovish stance and ongoing geopolitical tensions, volatility in Gold prices is expected to remain elevated. Traders should exercise caution, adjust risk management strategies, and stay prepared for potential price whipsaws in this high-volatility environment.
M15 Chart:

You will be glad you have a short positionBrothers, I have clearly reminded you in the above two article updates that I am very optimistic about gold's retreat to the 2905-2895 area. In the short term, gold has shown signs of retreat after touching the area near 2922 several times, and formed a distinct long upper shadow in the candle chart, further strengthening the effectiveness of the resistance area 2925-2935 area, further stimulating the willingness of gold to fall.
In the short term, I think gold still has the opportunity to retreat to the 2905-2895 area again. I am still patiently holding my short position and looking forward to further declines in gold, which will bring us rich profits.
Bro, do you have the courage to short gold with me?Trading means that everything has results and everything has feedback. I have been committed to market trading and trading strategy sharing, striving to improve the winning rate of trading and maximize profits. If you want to copy trading signals to make a profit, or master independent trading skills and thinking, you can follow the channel at the bottom of the article to copy trading strategies and signals
