Buy gold, there may be a rebound in the short termAt present, gold has touched the area of 3325-3315 mentioned in my previous article, and the lowest price is around 3316. At present, due to the current important support area of 3310-3300 below, gold still has a rebound demand in the short term; although gold has not rebounded sharply at present, the downward momentum has indeed slowed down, and gold may rebound after the short force is consumed. Moreover, the ceasefire between Iran and Israel has not yet been settled. Moreover, the ceasefire between Iran and Israel has not yet been settled. With the fluctuating situation in the Middle East, bulls may have opportunities to counterattack.
However, the current performance of gold is indeed relatively weak, so there is no need to expect gold to rebound and fill the upper gap area of 3360-3370 in the short term; in trading, the rebound expectation can be appropriately lowered, and long positions can continue to be held and look up to the 3340-3350 area.
Goldtradingstrategy

Buy gold first, and short on gold after filling the gapGold is currently continuing to retreat, and the lowest has reached around 3333. Gold is quite weak, and the bears have completely taken the upper hand. The overall center of gravity of gold is shifting downward, and the short-term support below is 3330-3325. Once gold falls below this support area, gold may continue to fall to 3300, or even 3280; since gold has fallen to the 3340-3330 area, we cannot rush to short gold in the operation, because there is a technical gap above that needs to be filled, so gold still has a rebound to 3360-3370 in the short term.
Therefore, before gold falls below the short-term support of 3300-3325, we can appropriately consider going long on gold; after gold rebounds technically and fills the gap above, we can consider continuing to try to short gold in the 3360-3370 area.

The golden storm is coming again, are you ready?Gold rebounded after falling back to 3333 in the first wave, and then rebounded to 3357 in the second wave before falling again, breaking through the previous low of 3333 and accelerating down to 3316. Currently, the short-term trend has stabilized in the 3316 area, which is also the support level for multiple rebounds in the previous period. After continuing to fall today, it has not broken through. We have arranged long orders in the 3316-3317 area in advance and have taken profits near 3331. Gold rebounded after stepping back again. Our long order plan is still in position. If the subsequent rebound breaks through the 3333 line, it is expected to further rise to the 3340-3348 area. We will try to short in this area.
In the short-term structure, the upper resistance focuses on the 3340-3348 area, and the lower support focuses on the 3310-3315 area. 3300-3305 is the watershed between the strength of long and short positions in the short term. The daily level is still under pressure as a whole, and the main idea of high altitude continues.
Gold operation strategy: short gold when it rebounds to around 3340-3348, target the 3330-3320 range.
Are you ready for the next wave of gold market?Gold fell back as expected after opening high. Today's strategy arranged long orders at 3350-3352, and successfully closed the market at around 3362 with profit. The subsequent three short orders also closed the market at a profit as expected. The points were perfectly predicted, and the long and short positions were perfectly grasped during the day. The strategic ideas were disclosed in advance and all were fulfilled.
At present, the overall trend of gold is still bullish, and it is in the adjustment stage in the short term. The large range this week is 3340-3405. Although there is a rebound, the upward pressure is still not small, and the gold price may continue the wide range of long and short fluctuations. Pay attention to the 3355-3340 area below. In terms of operation, long orders are arranged according to the strength of the retreat; pay attention to 3385 in the short term above. If it can effectively break through, look at 3395-3405. The strong pressure is still at the 3405 line. If it does not break, it will still fall under pressure. On the contrary, if it stabilizes, it is expected to hit last week's high.
Operation suggestion: When gold falls back to around 3355-3340, long orders can be arranged in batches, with the target at 3370-3380. Short orders will be adjusted according to the real-time market, please pay attention to the bottom 🌐 notification for specific points.

There are still profit opportunities in short selling!As gold continues to rebound, bulls are reversing their decline. After gold broke through the 3370-3380 area, the current market consensus on 3350-3340 as the bottom area was strengthened. However, as gold fell back under pressure several times after the rebound, it proved that there was still a certain amount of selling pressure above, and it was obvious that the resistance was in the 3395-3405 area; once gold broke through this resistance area, gold bulls would regain the upper hand and are expected to continue to probe the 3320-3330 area. However, before gold effectively broke through the 3395-3405 area, bulls and bears would still fiercely compete for control, so it is still in a wide range of fluctuations.
Therefore, before gold broke through the 3395-3405 area, we can still appropriately short gold in the 3385-3395 area, and expect gold to retreat to the 3375-3365 area in the short term. In trading, we must pay attention to the changes in the rhythm of gold. Once gold chooses a direction and makes a breakthrough, we need to change our trading strategy!

GOLD ROUTE MAP UPDATEHey Everyone,
Great start to the week with our new 1H chart playing out to perfection!!!
We started with a gap on market open clearing our Bullish target. We then got our bearish target at 3348, followed with no ema5 cross and lock confirming the rejection into our bullish target 3376.
We now have ema5 cross and lock above 3376 opening 3395.
We will see levels tested side by side until one of the weighted levels break and lock to confirm direction for the next range.
We will keep the above in mind when taking buys from dips. Our updated levels and weighted levels will allow us to track the movement down and then catch bounces up.
We will continue to buy dips using our support levels taking 20 to 40 pips. As stated before each of our level structures give 20 to 40 pip bounces, which is enough for a nice entry and exit. If you back test the levels we shared every week for the past 24 months, you can see how effectively they were used to trade with or against short/mid term swings and trends.
The swing range give bigger bounces then our weighted levels that's the difference between weighted levels and swing ranges.
BULLISH TARGET
3376 - DONE
EMA5 CROSS AND LOCK ABOVE 3376 WILL OPEN THE FOLLOWING BULLISH TARGETS
3395
EMA5 CROSS AND LOCK ABOVE 3395 WILL OPEN THE FOLLOWING BULLISH TARGET
3419
EMA5 CROSS AND LOCK ABOVE 3419 WILL OPEN THE FOLLOWING BULLISH TARGET
3440
BEARISH TARGETS
3348 - DONE
EMA5 CROSS AND LOCK BELOW 3348 WILL OPEN THE SWING RANGE
3330
3306
EMA5 CROSS AND LOCK BELOW 3306 WILL OPEN THE SECONDARY SWING RANGE
3288
3271
As always, we will keep you all updated with regular updates throughout the week and how we manage the active ideas and setups. Thank you all for your likes, comments and follows, we really appreciate it!
Mr Gold
GoldViewFX

It’s the right time to make a golden layout!Last Friday, the overall gold price continued to be suppressed and fell back to fluctuate and adjust. Finally, it stabilized at the 3340 mark before closing and rebounded and fluctuated. The daily K line closed with a fluctuating number K. The overall gold price continued to be suppressed and fluctuated in the near term. However, the US military attacked Iran's nuclear facilities over the weekend, exacerbating geopolitical tensions in the Middle East, and the market's risk aversion sentiment heated up. Today, the gold price jumped high and fell back into a volatile state. In the short term, the gold price is likely to continue the wide range of long and short fluctuations, and continue to trade time for space. Although gold opened high and went low, it still did not break the bullish trend channel. Looking for opportunities to go long after stepping back is also the current trend.
From the current market trend, today's technical support below is around 3345-3355, focusing on the gains and losses of the 3340 line; the upper short-term resistance is around 3380-3385, focusing on the 3395-3405 line. Relying on this range to maintain the main tone of high-altitude low-multiple cycle participation during the day, the middle position is always more watchful and less active, cautious pursuit of orders, and patiently waiting for key points to enter the market.
Gold operation strategy: go long when gold falls back to around 3350-3355, and add to long positions when it falls back to 3340-3345. The target is 3370-3380.Counter-trend short orders will be entered at an appropriate time based on market changes, and the specific points will be subject to the bottom 🌐 notification.

Short gold, gold still has at least one chance to pullback!At present, gold has rebounded to the 3370-3380 area again, which largely confirms that 3350-3340 is the bottom area at this stage. However, what we still cannot underestimate is that even with the support of safe-haven, gold has still failed to effectively break through the resistance of 3385-3395-3405 area, and even fell under pressure several times. To a certain extent, it weakened the willingness and confidence of bulls, so it aggravated the trend of wide fluctuations in the short term. During this period, we must pay attention to the rhythm change of gold.
According to the current bullish strength of gold, I think gold does not have the conditions to directly break through the heavy resistance of 3385-3395-3405 area for the time being, so gold still needs at least one retracement expectation, so I think we can still try to short gold in the 3375-3385 area, but the retracement expectation should not be too large, 3365-3355 is enough!

Follow the trend and go short, and buy when the price falls backAffected by the situation in the Middle East, gold opened higher and lower again on Monday, and the trend was exactly the same as last Monday. After the opening, gold fell back to the 3352-3355 line and fluctuated. We planned to arrange long orders near 3350, but gold went up directly and did not give an entry opportunity. During the rebound, gold was blocked and under pressure at the 3366 line, and at the same time, there were signs of stagflation at high levels. Combined with the short-term adjustment needs, the strategy was to arrange short orders near 3364 and successfully stop profit at the target of 3350. Then we went long at the 3348-3350 line, which is also the preset long entry area. The current target continues to focus on the 3370-3380 area. So far, although gold opened high and went low, the overall bullish trend channel has not been broken, and the retracement to long is still the current mainstream direction.The specific points are subject to the bottom 🌐 notification.
From the current trend, the support below focuses on the 3340-3345 area. Combined with the stimulus of the Middle East situation over the weekend, the short-term upper resistance focuses on the 3380-3385 area. The expectation of breakthrough is still there, and the focus is on the suppression performance of the 3400-3415 line. The overall strategy continues to rely on the idea of buying on pullbacks. Watch more and do less in the middle position, chase orders cautiously, and wait patiently for clear signals at key points before intervening.
Gold operation strategy: Gold retracement near the 3340-3350 line to do more, the target is 3370-3380.

Gold bottomed out and rebounded, continue to go longAffected by the situation in the Middle East, gold opened high and fell again on Monday, just like last Monday. At present, it has fallen back to the 3352-3355 line and fluctuated. Although it is under short-term pressure, the bull channel has not been broken, and the retracement is still a long opportunity. The support below is 3340-3345, and the short-term resistance is 3380-3385. It is only a matter of time before it breaks through. The key suppression is still in the 3400-3415 area. In terms of strategy, continue to arrange long orders around the retracement, be cautious in chasing orders in the middle oscillation zone, and wait patiently for key position signals. The specific points are subject to the bottom 🌐 notification.
Gold suggestion: arrange long orders around 3340-3350, and the target is 3370-3380.

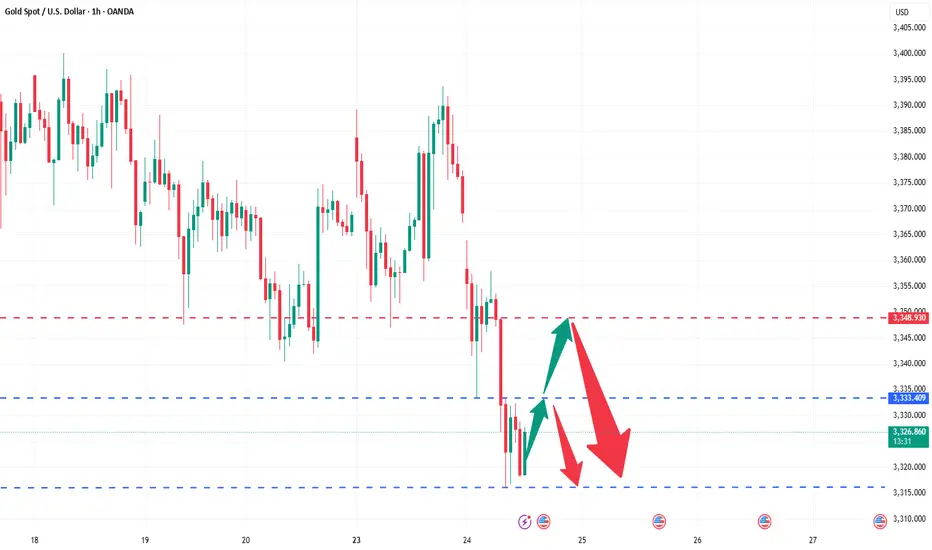
GOLD 1H CHART ROUTE MAP UPDATE & TRADING PLAN FOR THE WEEKHey Everyone,
Please see our updated 1h chart levels and targets for the coming week.
We are seeing price play between two weighted levels with a gap above at 3376 and a gap below at 3348. We will need to see ema5 cross and lock on either weighted level to determine the next range.
We will see levels tested side by side until one of the weighted levels break and lock to confirm direction for the next range.
We will keep the above in mind when taking buys from dips. Our updated levels and weighted levels will allow us to track the movement down and then catch bounces up.
We will continue to buy dips using our support levels taking 20 to 40 pips. As stated before each of our level structures give 20 to 40 pip bounces, which is enough for a nice entry and exit. If you back test the levels we shared every week for the past 24 months, you can see how effectively they were used to trade with or against short/mid term swings and trends.
The swing range give bigger bounces then our weighted levels that's the difference between weighted levels and swing ranges.
BULLISH TARGET
3376
EMA5 CROSS AND LOCK ABOVE 3376 WILL OPEN THE FOLLOWING BULLISH TARGETS
3395
EMA5 CROSS AND LOCK ABOVE 3395 WILL OPEN THE FOLLOWING BULLISH TARGET
3419
EMA5 CROSS AND LOCK ABOVE 3419 WILL OPEN THE FOLLOWING BULLISH TARGET
3440
BEARISH TARGETS
3348
EMA5 CROSS AND LOCK BELOW 3348 WILL OPEN THE SWING RANGE
3330
3306
EMA5 CROSS AND LOCK BELOW 3306 WILL OPEN THE SECONDARY SWING RANGE
3288
3271
As always, we will keep you all updated with regular updates throughout the week and how we manage the active ideas and setups. Thank you all for your likes, comments and follows, we really appreciate it!
Mr Gold
GoldViewFX

GOLD 4H CHART ROUTE MAP UPDATE & TRADING PLAN FOR THE WEEKHey Everyone,
Please see our updated 4h chart levels and targets for the coming week.
We are seeing price play between two weighted levels with a gap above at 3375 and a gap below at 3306. We will need to see ema5 cross and lock on either weighted level to determine the next range.
We will see levels tested side by side until one of the weighted levels break and lock to confirm direction for the next range.
We will keep the above in mind when taking buys from dips. Our updated levels and weighted levels will allow us to track the movement down and then catch bounces up.
We will continue to buy dips using our support levels taking 20 to 40 pips. As stated before each of our level structures give 20 to 40 pip bounces, which is enough for a nice entry and exit. If you back test the levels we shared every week for the past 24 months, you can see how effectively they were used to trade with or against short/mid term swings and trends.
The swing range give bigger bounces then our weighted levels that's the difference between weighted levels and swing ranges.
BULLISH TARGET
3375
EMA5 CROSS AND LOCK ABOVE 3375 WILL OPEN THE FOLLOWING BULLISH TARGETS
3439
EMA5 CROSS AND LOCK ABOVE 3439 WILL OPEN THE FOLLOWING BULLISH TARGET
3499
EMA5 CROSS AND LOCK ABOVE 3499 WILL OPEN THE FOLLOWING BULLISH TARGET
3561
BEARISH TARGETS
3306
EMA5 CROSS AND LOCK BELOW 3306 WILL OPEN THE SWING RANGE
3236
3171
EMA5 CROSS AND LOCK BELOW 3171 WILL OPEN THE SECONDARY SWING RANGE
3089
2995
As always, we will keep you all updated with regular updates throughout the week and how we manage the active ideas and setups. Thank you all for your likes, comments and follows, we really appreciate it!
Mr Gold
GoldViewFX

GOLD DAILY CHART ROUTE MAPHey Everyone,
Quick update on our Daily chart Goldturn channel setup.
Since our last post, price action has continued to play out within the structure as anticipated but with a new development: we’ve now had the challenge and rejection at the channel top. Price challenged the 3433 axis again but failed to lock above, confirming the resistance remains firm at this level.
To confirm a continuation higher into 3564, we’ll now need to see either a blue candle body close or the EMA5 cross and lock cleanly outside the channel. Without that confirmation, we treat any move to the top as a potential fade opportunity, not a breakout.
On the downside, daily support at 3272 remains intact and continues to anchor our range structure. As long as price holds above this level, we maintain our strategy of buying dips, especially when supported by our weighted Goldturn zones on lower timeframes (1H, 4H).
This rejection further validates the precision of our Goldturn channel. The structure continues to guide us effectively filtering the noise and keeping us on the right side of the setup.
Stay disciplined. The range is still in play until we get a clear break and hold above the top.
Watch 3272 and 3433 closely. The next move will hinge on whether bulls can finally break the ceiling or if sellers continue to defend this range top.
Let the market show its hand.
Mr Gold
GoldViewFX

GOLD WEEKLY CHART MID/LONG TERM ROUTE MAPHey Everyone,
Following up on our previous weekly update = last week we saw the expected correction play out with a move down for the EMA5 detachment touch, highlighted by the circle on the chart. This was a healthy pullback within the structure and aligns perfectly with the Goldturn methodology.
While we previously had the candle body close gap at 3482, that target still remains open and active. The move lower was not a breakdown but a technical retest, setting up the potential for continuation higher once momentum returns.
Support continues to hold at 3281, reinforcing our buy the dip strategy within the structure. The price remains guided by the channel and is still following the expected trajectory toward the long term gap target.
We'll be watching closely for renewed strength to drive back toward 3482, and any close above recent highs could reignite that move. Until then, structure remains bullish and contained.
Stay disciplined and let price do the talking.
Mr Gold
GoldViewFX

Wait for the key points to be confirmed before taking actionThe trend of gold on Friday is still in line with my analysis. Before the market opened, I suggested that gold would rebound from the bottom. Considering the resistance level, I would arrange short orders with a light position. I clearly emphasized that I should not chase short orders at low levels. The actual market price fluctuated upward after hitting the 3340 line at the lowest point, and maintained a range-bound fluctuation pattern as a whole. We arranged long orders in batches at 3342-3353, successfully stopped profit near 3358, reversed shorting, and stopped profit again at 3342. After that, the market hit the top again and was blocked. Short orders were arranged at 3370-3375. It is not recommended to hold positions over the weekend. I have already left the market with a small profit near 3365. Although there was no significant breakthrough, all ended with profit, but it was quite satisfactory for Friday's market.
News: Gold prices were stable on Friday, but fell 1.8% this week. It closed at 3368. The latest Federal Open Market Committee (FOMC) statement reinforced the Fed's cautious stance, keeping interest rates in the 4.25%-4.50% range. However, the statement also lowered the number of expected rate cuts this year, which put downward pressure on gold prices. In addition, U.S. Treasury yields did not change much but rose slightly, reflecting the stabilization of market risk sentiment. The 10-year Treasury yield rose by more than 2 basis points to 4.421%, and the 30-year Treasury yield rose to 4.924%. Rising yields often put pressure on non-yielding assets such as gold, further suppressing the upward momentum of gold prices. The Fed's failure to immediately launch an easing policy, coupled with a stronger dollar and a reduced urgency of geopolitical risks, have all exacerbated selling pressure. Unless tensions escalate again or the Fed unexpectedly turns, short-term gold price forecasts point to further weakening.
The price of gold has rebounded since it fell from its historical high of 3500 to 3120, After continuous rise, due to the decline of risk aversion in the market, it fell under pressure at 3452. It rebounded to 3340 on Friday. The K-line combination arrangement was bearish. The 4H chart showed a stop-loss signal. It is expected that the market will consolidate below 3400 in the short term. In the medium term, attention should be paid to the geopolitical crisis and the July interest rate decision of the Federal Reserve. It will break through the node after confirming the upper resistance of 3400. In the short-term 4-hour chart, the lower support is around 3340-3345, and the upper short-term resistance is around 3380-3385. Focus on the suppression of the 3400-05 line. The overall idea of retracing back to long positions remains unchanged, and the middle area is mainly kept on the sidelines. Be cautious in chasing orders and wait patiently for the key points to be confirmed before intervening. If the upper resistance is not broken, you can still consider light positions to arrange short orders, and pay attention to the bottom for the specific entry point.

Precise short orders in 3370-3375 area are launched!Gold has been volatile recently, with intraday fluctuations ranging from 1 to 200 US dollars, which greatly increases the difficulty of operation for retail investors. On the surface, there are many opportunities, but there are only a few real big market opportunities. If you miss the rhythm, you can only watch your funds shrink. Remember that risk management is crucial.
From the 4-hour analysis of gold, there are repeated resistances from bulls before the downward break; once it breaks down, the market will go further down, and the focus below is 3340. The upper short-term is 3370-3380, and the important resistance is 3400. Only by breaking through the bulls can the rebound continue. In terms of operation, sell high and buy low, and pay attention to the breakthrough!
There are too many long orders accumulated at the current high level of gold, and the market will not rise sharply easily. The current international situation is so tense, and gold is still slowly declining. In this situation, it is difficult to rebound sharply.
Operational suggestions: For short orders above, focus on the layout of the 3370-3375 area, strictly set a stop loss, target more than 20 points, control risks, and follow the trend.

GOLD DAILY CHART UPDATEHey Everyone,
Great finish to the week across all our multi timeframe analysis.
We updated our 1H chart throughout the week catching the buys from the dips using our levels and ema5 cross and lock allowed us to track the movement with confirmation.
This is now an end of week update on our daily chart idea. This chart shows our perfect play into the channel top and then rejection for the movement down. We used our smaller timeframe charts to catch the bounces from this movement down.
Following up on our previous analysis, price action has continued to respect our Goldturn channel beautifully. The key takeaway here is that the channel levels are being respected with precision, validating the strength and reliability of our Goldturn channel framework.
We’ll be back now on Sunday with our multi-timeframe analysis and trading plans for the week ahead. Thanks again for all your likes, comments, and follows.
Wishing you all a fantastic weekend!!
Mr Gold
GoldViewFX

Stick to shorting gold and holding itAlthough gold has risen sharply to around 3375 in the short term due to the dovish remarks of Fed officials, it has not made an effective breakthrough. Therefore, gold has not reversed its trend due to the short-term rebound. Gold is still in an obvious short trend. In the short term, gold is obviously under pressure in the 3365-3375 area. If gold fails to break through this resistance area, then after gold consumes a certain amount of long energy, gold shorts will counterattack again and are expected to retreat to the 3350-3340 area again.
In the case that good news cannot support the continued rebound of gold, the market's bullish confidence will be hit again, and the short confidence will be further strengthened, stimulating gold to accelerate its decline, and it is even expected to fall below the 3350-3340 area. Therefore, in short-term trading, I still advocate shorting gold, and I am currently holding a short position in gold, and I look forward to the accelerated decline of gold as expected!

Hold on to the high point and go short decisively!Gold closed the weekly line today, maintaining the idea of oscillating downward. The 4H consecutive negatives tested the support of the lower Bollinger track. Although it was roundabout and saw-sawed, every decline would be accompanied by a new low. Therefore, hold the high point to see the bottom break and accelerate. The lower side will gradually look to 3338 and 3315. Among them, 3315 is a strong support for the weekly line. If it is not broken, you can consider going long; the upper rebound pressure is 3361 and 3375. In terms of operation, short according to the rebound strength, and the specific points are subject to the bottom 🌐 notification.
Operation suggestion: Short gold in batches near 3361-3375, with a target of 3350-3340.

Perhaps 3300 or even 3280 is foreseeable!Obviously, gold is currently fluctuating downward, and in the short term, there is a certain support in the 3340-3330 area, so gold will not fall below this support area in one fell swoop, and it is still possible to rebound to the 3360-3370 area with the support of this area. If gold encounters resistance and retreats again after touching the 3360-3370 area, if there is no major good news, gold is likely to fall below the 3340-3330 area. After gold falls below this support area, the 3300 and 3280 areas are foreseeable.
So according to the above logic, I still hold a long position executed near 3345, and I am very much looking forward to gold reaching the 3360-3365 area;
If gold continues to rebound to the 3365-3375 area, I will try to short gold again; and look forward to the accelerated downward movement of gold!
The above is a preview of the performance of gold. There may be some deviations in the specific execution of transactions, because in short-term transactions, it is necessary to judge the true breakthrough and false breakthrough in advance, but I will still roughly follow the above preview process to execute the transaction! I also hope that this can provide some reference for everyone!

A glimmer of hope for bullish lovers!Gold is currently dominated by bears, but thanks to the support of risk aversion caused by geopolitical conflicts, gold has shown a certain degree of resistance to decline while falling. Therefore, the current market direction is very clear, with weak and volatile downward movement. But under this market situation, we cannot short gold excessively. We can only wait for it to rebound to the pressure level and then short gold, or try to go long on gold with strong support.
At present, gold has touched the 3350 area again, which has a certain support effect. If gold cannot effectively fall below 3350, then gold may still rebound to the 3370-3380 area again; but once gold effectively breaks the support near 3350, gold is expected to continue to fall to the 3340-3330 area.
In terms of short-term trading, I think it is possible to consider starting to try to go long on gold in batches in the 3350-3330 area, TP: 3365-3375

THE KOG REPORT - FOMCTHE KOG REPORT – FOMC
This is our view for FOMC, please do your own research and analysis to make an informed decision on the markets. It is not recommended you try to trade the event if you have less than 6 months trading experience and have a trusted risk strategy in place. The markets are extremely volatile, and these events can cause aggressive swings in price.
A you can see traders the pre-event price action started yesterday with the hourly now playing between the MA’s and waiting for FOMC for a potential breakout. As usual, we have highlighted the key levels and added the red boxes for all of you to help navigate the movement should this not be priced in.
Also remember, there is a press conference after the release, this is usually the time the market will react to anything Powell says about future plans for the economy.
Now, looking at the 4H, we have support at the 3370-65 level and below that 3355. If these are attacked and give a RIP, opportunity for the long trade may be available into the 3395 red box which price will need to break to go higher. If we can break above this red box, we can then look to attempt higher price with the levels 3430, 3445 and above that 3455-60 on the horizon. It’s that red box sitting higher up around the 3470-75 region which needs to be watched if we do get up there as an opportunity to attempt the reverse trade may present itself from there depending on the volume.
So in summary, we have 3 key levels in play, ideally a move upside and rejection from the 3400-6 level giving a further dip would suit buyers to get better pricing.
KOG’s RED BOX TARGETS:
BREAK ABOVE 3395 for 3404, 3406, 3410, 3420, 3430, 3435 and 3459 in extension of the move
BREAK BELOW 3380 FOR 3375, 3364, 3351, 3342, 3333 AND 3327 IN EXTENSION OF THE MOVE
LEARN AND GENERATE YOUR OWN SIGNALS. You don't need any of us to guide you.
Please do support us by hitting the like button, leaving a comment, and giving us a follow. We’ve been doing this for a long time now providing traders with in-depth free analysis on Gold, so your likes and comments are very much appreciated.
As always, trade safe.
KOG

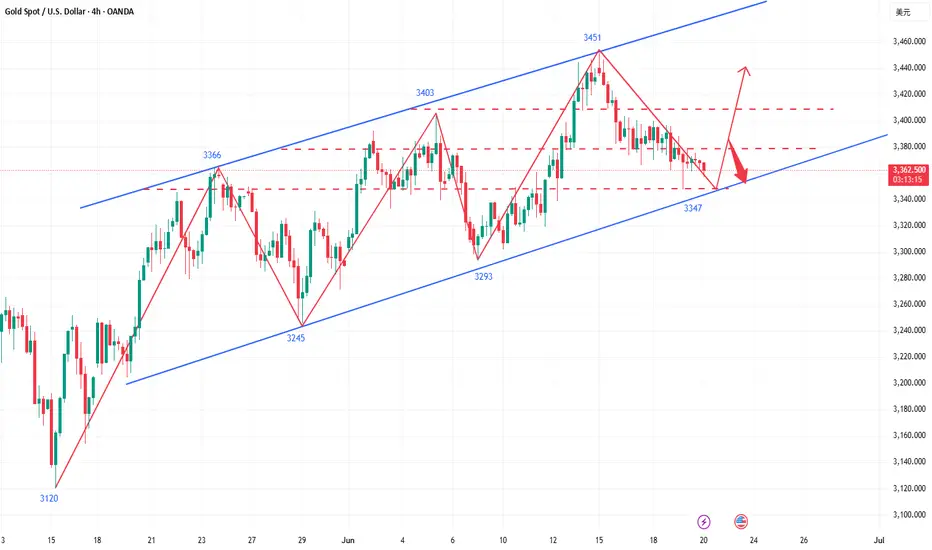
The bulls are not dead yet, it’s time to ambush at low levels!Gold only opened higher and rose on Monday this week, and then reached the highest level of 3452, and then started the road of shock and retracement this week. As of today, Friday, gold is still oscillating and adjusting in the lower range, but from the 4-hour market trend, the trend of gold is still dominated by bulls. In the short term, gold is oscillating and adjusting at a low level. Today, Friday, we will first focus on the support level of 3347-3353 below, which is also the starting point of the rebound yesterday. If this position is not broken today, Friday, we will mainly rebound and close.
From the 4-hour analysis, the support below focuses on 3347-3353, and the short-term resistance above focuses on the 3378-3385 level, with a focus on the 3408-3415 level. Continue to rely on this range to maintain the main tone of high-altitude low-multiple cycle participation unchanged, and the middle position is always more watchful and less active, cautiously chase orders, and patiently wait for key points to enter the market.
Gold operation strategy: Go long when gold falls back to 3347-3355, with a target of 3370-3380.
If you still lack direction in gold trading, you might as well try to follow my pace. The strategy is open and transparent, and the execution logic is clear and definite, which may bring new breakthroughs to your trading. The real value does not rely on verbal promises, but is verified by the market and time.