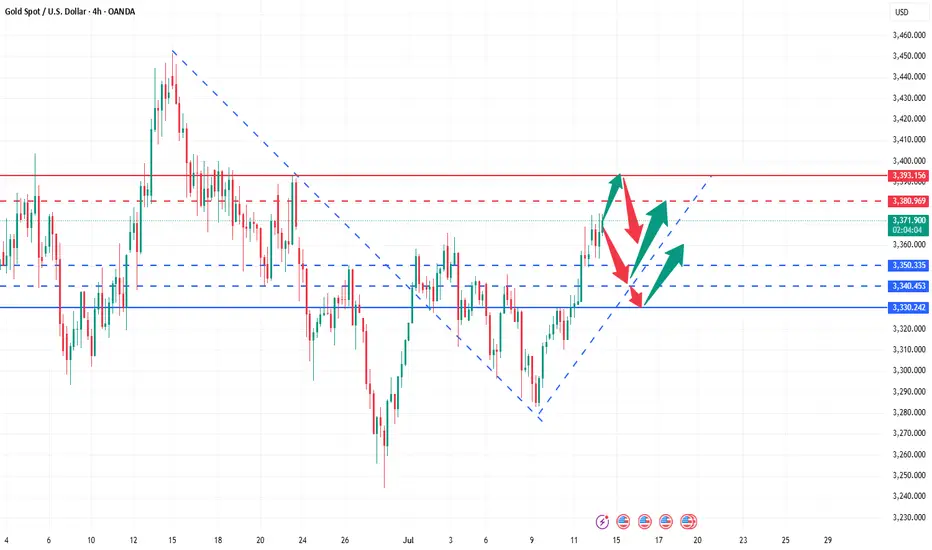
3325 accurate long position, gold rose as expectedToday, gold rebounded as expected. We arranged long orders in advance near 3325, which was completely based on the technical repair logic after the previous continuous decline and the accurate judgment of the key support area. From the rhythm point of view, the opening price quickly fell but did not break the previous low. The technical side showed a bottom stabilization signal, and the panic release on the emotional side was the core basis for our decisive long position. At present, gold has risen to around 3344, and we have made a big profit again, perfectly fulfilling the opening strategy and successfully starting this week. This wave of long orders not only has considerable space, but also reflects our grasp of rhythm and control of risks, and truly realizes predictable returns and controllable risks.
What to look at next?
Currently, gold is approaching the 3345-3355 periodic resistance area, and there is limited room for short-term gains. It is recommended to pay close attention to the competition for this position. If there is a lack of strength to rise or signs of stagflation, it is not ruled out that the market will fall into adjustment again. You can focus on the brewing of short-term opportunities.
Brothers can operate according to the plan. More strategies are updated in real time. Welcome to continue to pay attention!
Goldtrend

Double Down on Gold — Targeting 3400–3410!Obviously, gold did not give us the opportunity to short gold near 3440 today. In the process of its recent pullback, gold tested 3400 as expected, and after falling below 3400, it continued to fall to around 3385 as if it was planned by me. Although the lowest point had reached around 3381, it quickly rebounded above 3385. What is relatively regrettable today is that both of our plans to short gold ended in failure. The first time was when gold did not give us the opportunity to short near 3440. The second time was when we were preparing to short gold at 3400 and set the TP to 3385. However, we did not have time to create an order because the price fell too quickly, causing us to miss the gold short trade again.
At present, I have a trading order to go long on gold near 3386. And I go long on gold with twice the usual trading volume. Why am I still optimistic about the rebound of gold in the short term after the gold price fell by nearly $60? Because the area around 3385 is the short-term bull-bear dividing line, although gold has fallen sharply, as long as it stays above the area around 3385, gold is still in a bullish trend as a whole, and the bullish structure has not been destroyed, so in the short term, gold still has a lot of room for rebound after the pullback. This is why I dare to use twice the usual trading volume to buy gold near 3386.
However, because the current gold long and short continuity is not strong, and the market uncertainty is still increasing due to complex news, the gold market is prone to violent fluctuations in the short term, so we have to be more careful in trading. At present, I still hold a gold long position near 3386, and I hope that gold can continue to rebound to the target area: 3400-3410.

Bullish on gold, but avoid chasing highs , beware of pullbacks!Analysis of gold trend: From the daily chart, gold is in an upward trend. From the technical indicators, MA5-MA10 moving averages are golden crosses, BOLL opens upward, K line runs on the upper track of the daily Bollinger band, and the MACD candle chart momentum column continues to increase, indicating that the bullish trend remains unchanged. KDJ runs near the 80 draw line and is overbought, which means that the short-term market upward momentum may be over-released, and there is a need for callback or shock consolidation. Although the general trend is bullish, it is difficult to form a continuous surge. This wave to 3440-3450 is very good, and it is likely to form a mid-term adjustment under the pressure of 3450. Be cautious about the current rise. If there is an effective adjustment, it may turn from strong to weak.
From the 4-hour chart, the performance in the chart has the possibility of reaching the top now. Gold surged to around 3438 after opening, and then fell back. The current strength is still relatively large. Therefore, today we should pay attention to whether there is a possibility of reaching the mid-term top. The support below is around 3410-3400. If it breaks below 3400, it may continue to adjust to -3385-3375 today. From the 1-hour chart, the technical indicators in the chart cross downward, indicating that there is a need for a short-term decline. The general trend is bullish. The short-term will first look at the retracement. Today, the support below is around 3410-3400. The intraday retracement relies on this position to continue to be bullish.
Gold operation strategy: short gold around 3435-3438, target 3420-3310. It is recommended to go long around 3410-3400, target 3420-3430.

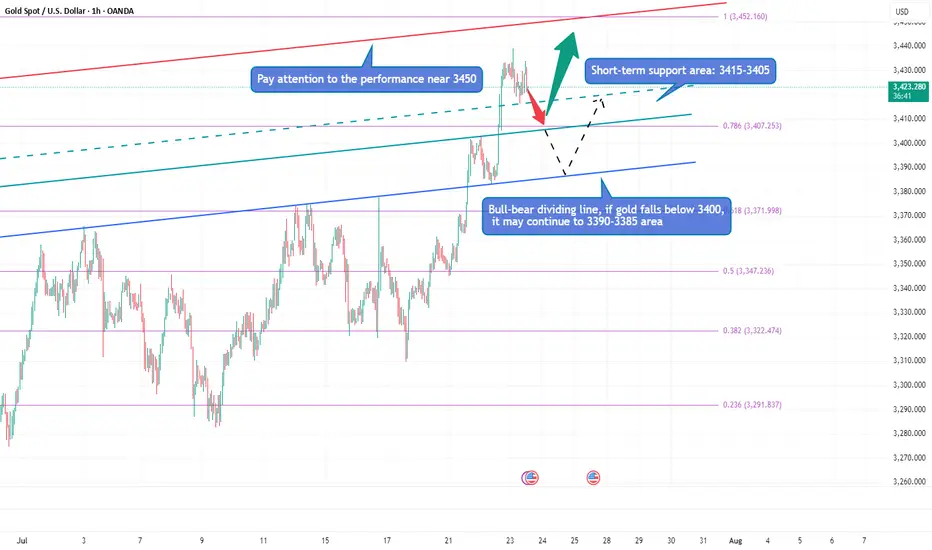
Gold is surging, can it hit 3500?Due to the trade tensions caused by tariffs and the continued conflict between the White House and the Federal Reserve, gold continued to rise, and the current highest has reached around 3438. Obviously, after gold rose strongly and broke through the 3400 and 3420 areas, the bullish sentiment of gold has been ignited. Next, we need to pay attention to whether gold can test and stand firm at 3450.
Gold is currently extremely strong, and there is basically no room for retracement during the rise. As gold rises, the short-term support below has also moved up to the 3415-3405 area; and the upper side needs to pay attention to the breakthrough of the 3450 mark. If gold continues to break through 3450, then gold has the potential to challenge 3500 again; however, if gold still cannot effectively break through when it touches the area near 3500 again, the sentiment of gold cashing out and leaving the market may be stimulated, resulting in gold There may be room for retracement in the short term. If gold falls below 3400 during the retracement, the decline may continue to the 3395-3385 area.
Therefore, for the next short-term trading, we can first wait for the opportunity for gold to pull back, and then consider going long on gold with the 3415-3405 area as support; if gold does not give a chance to pull back, then when gold first touches the area around 3440-3450, we can consider starting to short gold.
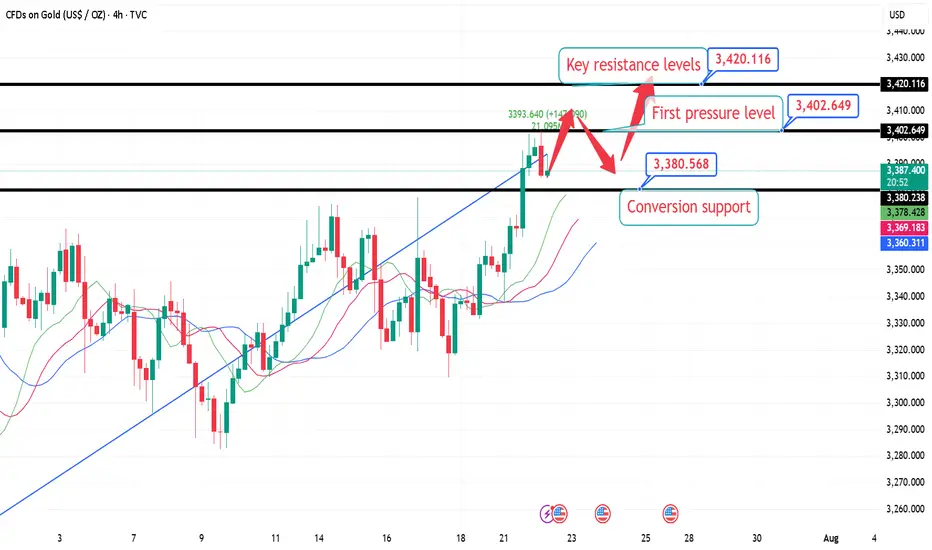
7.22 London Gold Market Analysis and Operation SuggestionsFrom the market perspective, the trend suppression line from the historical high of 3500 to the secondary high of 3452 has moved over time and is now around 3420, which can be used as an important resistance level reference for this week; the previous resistance level of 3376 can be converted into support after breaking through. For intraday short-term operations, focus on this range of callbacks and go long, wait for the key resistance level to be touched before going short, or see if there is an opportunity to arrange a mid-term short order based on the real-time trend.
Specific intraday operation ideas:
①. When the gold price falls back to around 3380, participate in long orders and call, protect the position of 3374, and first look at the position of 3402, the high point on Monday;
②. After yesterday's high point breaks, wait for a correction to around 3395 to continue to participate in long orders and call, protect the position of 3388, and look at the key suppression level of 3420;
③. (Aggressive orders, for those who are afraid of missing out) If you are short or have enough positions, you can first participate in long orders with a light position at the current price of 3388, and wait for 3380 to increase your position, and the target is the same as above.
Gold volatility intensifies.How to seize the golden opportunity?Gold is still in an upward trend. From the daily level, the KDJ indicator continues to diverge upward, the MA5 and MA10 moving averages form a golden cross, the MACD kinetic energy column continues to increase, and the fast and slow lines form a golden cross after bonding. The overall technical structure is strong, indicating that the market still has room to continue to rise. In terms of operation ideas, it is recommended to continue to focus on low-level longs. Today's market is dominated by a slow rise rhythm, and basically no obvious callback opportunities are given. From the 4-hour chart, KDJ continues to rise, the MA5-MA10 moving average maintains a golden cross structure, the upper track of the Bollinger Band shows signs of opening, and the kinetic energy column of the MACD golden cross continues to expand, indicating that the current buying is active, the market sentiment is optimistic, and the short-term upward trend is still expected to continue. The hourly line structure shows that gold has entered an accelerated upward stage after breaking through the 3375 line, and has always been running in the upper and middle track area of the moving average without any obvious retracement. Currently, the 3360 area constitutes a strong short-term support. At the same time, 3375 as the previous high has also become the first support level. If it falls back and stabilizes in this area, it is still expected to continue the upward trend. In the short term, it is expected to test the previous highs of 3405 or even 3415. If it is touched for the first time, pay attention to the risk of a decline in the double top pattern.
Operation suggestion: If gold falls back to the 3375-3360 area, you can try to go long, with the target looking at 3390-3400.

7.22 Gold falls back and continues to be bullish, 3400 is not thFrom the 4-hour analysis, the short-term support below is 3370, the important support is 3350-55, and the upper resistance is 3400-05. The overall support during the day is to maintain the main tone of high-altitude and low-multiple cycles in this range. For the middle position, watch more and do less, be cautious in chasing orders, and wait patiently for key points to enter the market.

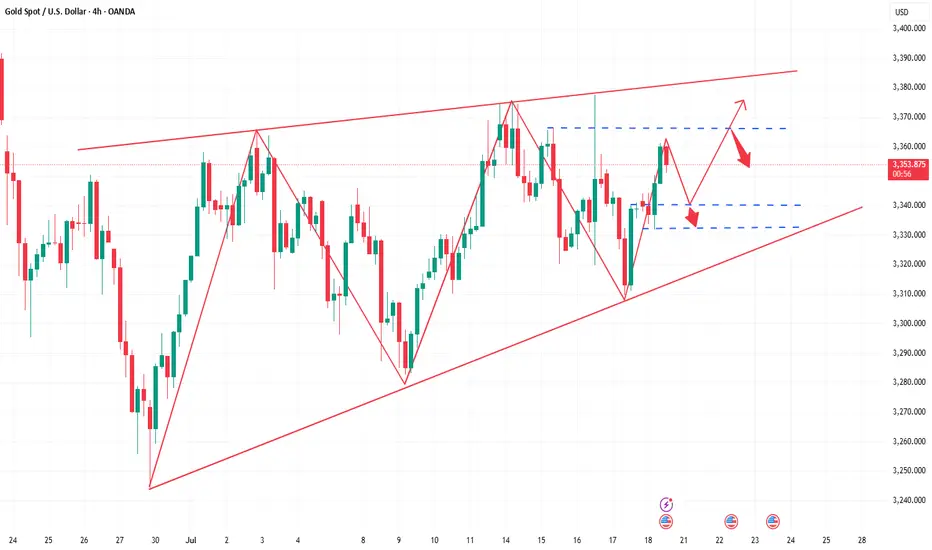
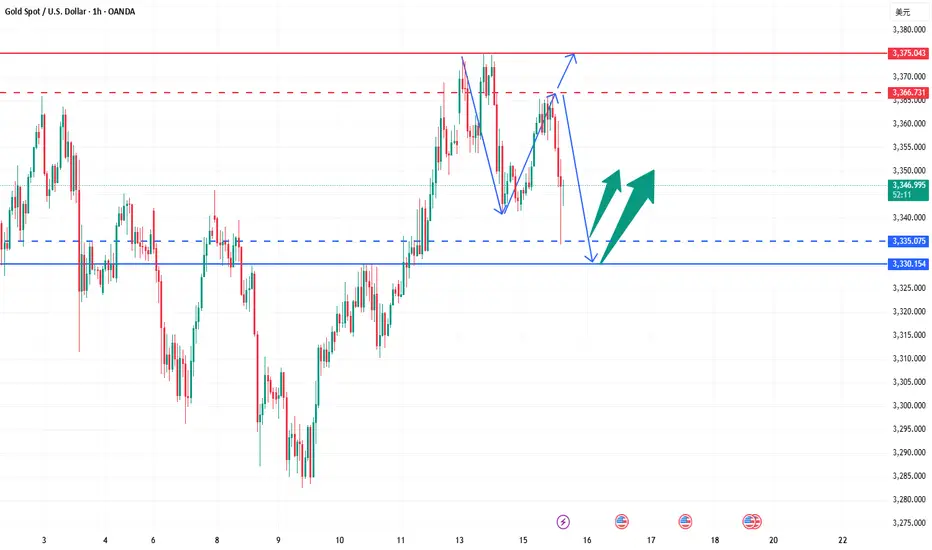
Gold bulls slowly climb higherJudging from the market trend last Friday, the trend channel has been broken, and the pullback to accumulate strength is an effective confirmation of the trend channel. At the same time, the large-cycle trend support is obvious, coupled with the break of the short-term structure, the current situation basically presents an overall bullish pattern, especially the key point of 3345, which is not only the neckline position of the large-cycle irregular W-bottom pattern, but also has obvious structural support. Therefore, every pullback is the best time to deploy longs. From the perspective of the European session, it is expected to rise again. The overall market trend is in line with the technical logic, and the trading opportunities are clear. Gold is still in a large shock range. The idea of the main long in intraday operations remains unchanged. Focus on the support of 3345-3330 and choose to go long when the opportunity arises. In the short term, pay attention to the reaction of the 3366-3377 resistance area. The current market direction is very clear. There is no need to hesitate too much. Go with the trend and wait for the key position to pull back to participate.
Gold strategy reference: Buy gold in batches when it falls back to 3345-3330, with the target at 3365-3375. If the price touches the 3370-3377 pressure zone without breaking, you can try shorting.

Why do you always miss the most stable trading opportunities?The market is always moving forward in the game between long and short positions. Sometimes the market is strong and sometimes it is falling rapidly. We cannot control the market trend. The only thing we can do is to protect the principal and stay rational. When the market is unclear, it is better to decisively exit and wait and see than to blindly waste energy. Whether the market rises or falls is not the most important thing. What you really need to think about is how you will deal with it, how much profit you can get when you are right, and how much loss you can avoid when you are wrong. This is the fundamental of trading.Trading method: follow the trend, macro resonance, refuse to bet everything, and implement iron discipline. Welcome like-minded friends to exchange technology, methods and trading experience, write analysis honestly, and trade seriously. I just hope you can take fewer detours!
Review of this week's upward trend analysis: This week, we did very well in gold. From Monday to Friday, the daily analysis layout and entry position were very accurate, the trend was correct, and it was simple and easy to do. Gold showed an overall volatile upward trend, which was in line with my previous prediction: First, the decline of the US dollar supported the gold price. The weakening of the US dollar increased the purchasing power of non-US currency holders, pushed up the demand for gold, and precious metals strengthened across the board. Second, the rise in risk aversion was affected by uncertainties such as the US fiscal deficit, tariff policy, and the independence of the Federal Reserve. The market's risk aversion demand increased, and bullish sentiment continued to be released.
As for the gold trend next week, the gold price bottomed out and rebounded this week, with obvious characteristics of washing and consolidation. The trend structure further converged and waited for the direction to be chosen. The weekly line closed with a long lower shadow and a small negative line. The daily line alternated between positive and negative, running between the middle and upper rails of the Bollinger Bands, continuing the slow bull shock pattern. Next week, focus on the break of the 3377-3309 range. If it does not break, maintain the high-altitude and low-multiple ideas. If it breaks, follow the unilateral trend. The short-term pressure is concentrated in the 3360-3370 area. It rose to this position on Friday and then fell back, showing obvious pressure. The lower support focuses on the 3330 line. It has not broken through many downward explorations, which has key support significance and needs special attention. If 3330 is lost, the bears may take the initiative. If it holds on and does not break, the bulls still have the upward momentum. Breaking through 3375 will open up the trend of rising space. In terms of operation rhythm, the short-term support focuses on 3345-3335. The key pressure above pays attention to the vicinity of 3380. Under the premise of no news stimulation, the market will most likely maintain a shock range this month.

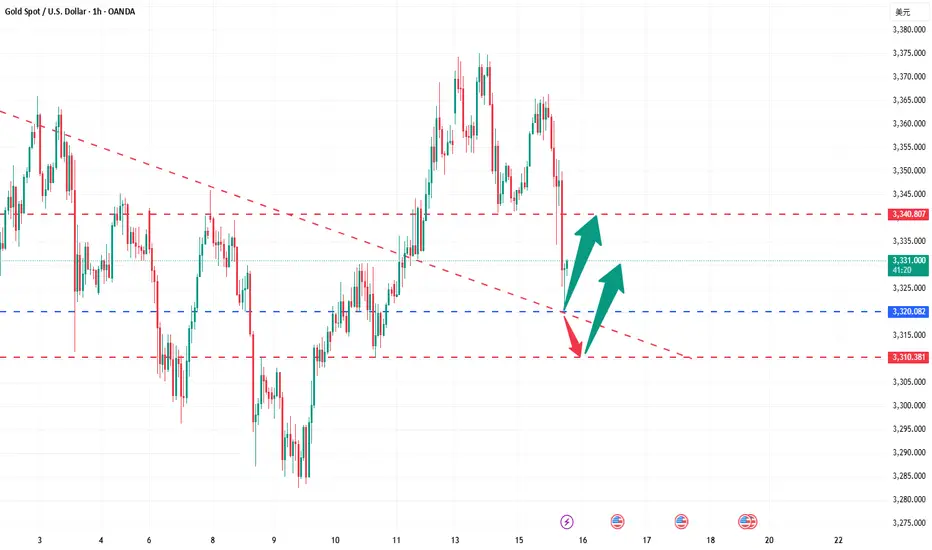
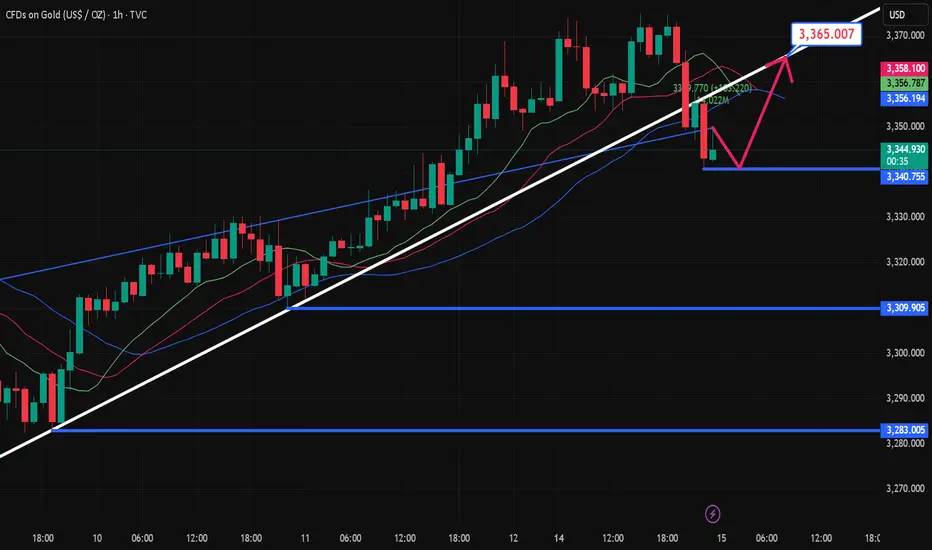
How to seize deterministic trading opportunities?The rebound momentum of the gold market has been significantly enhanced today. After breaking through the 3345 resistance in the Asian session, it has continued to rise. It has now reached around 3360, and has rebounded by more than US$50 from this week's low of 3310, setting a new rebound high in the past three trading days. After the gold price effectively broke through the key resistance band of 3340–3350, it triggered some short stop loss trading and trend funds to enter the market, driving the price to accelerate the upward trend. Judging from the hourly chart, the trading volume has increased by about 30% compared with the same period yesterday, indicating that the market's recognition of this round of rebound has increased significantly.
A physically full sun candle chart has been closed in the 4-hour cycle, successfully standing on the Bollinger middle track, further confirming the upward structure, the mid-track support area 3340–3345 has become a key position for bulls' defense, and the short-term structure of the market is still relatively strong. Overall, the intraday retracement range of gold is limited, and the probability of continuing to rise is relatively high. In terms of strategy, it is still recommended to go long. In the short term, focus on the 3340–3345 area retracement support, and the stop-profit target is 3365–3370; if the upward breakthrough, pay attention to the suppression performance of the 3370–3375 line, beware of highs and falls, and pay attention to controlling risks.
How to find solid trading opportunities amid gold volatility?Gold opened at around 3338, and then fluctuated and fell after reaching the highest point of 3344. The 3313 long orders that were publicly deployed yesterday reached the target range of 3327-3330 as expected and stopped profit smoothly. Although the overall trend is weak, it has never effectively left the range, and the typical bottoming rebound structure is still an important basis for the low-multiple thinking. The market rose to around 3340 in the short term and then fell again. The overall operation fluctuated and consolidated below 3340, and failed to reach the expected short order entry position, and maintained fluctuations until the close.
At present, gold is still in the range of fluctuations. Although the hourly line has some fluctuations, there is no obvious directional breakthrough, and it is more of a consolidation and accumulation state. The upper short-term suppression focuses on the 3345-3355 line, which is the current primary resistance area; the lower support focuses on the 3325-3315 area, and the judgment of the long and short key nodes is maintained. The daily structure shows a yin-yang staggered pattern. The market sentiment is cautious and the long and short forces are relatively balanced. Before an effective breakthrough is formed, the operation should be based on support and pressure points to avoid chasing ups and downs and do a good job of risk control.
Operation suggestions are as follows:
1. Go long near 3325-3315, with a target of 3340-3345.
2. Go short near 3345-3355, with a target of 3325-3320.
Today is Friday, and it is recommended to respond steadily, focusing on the competition for key support and resistance areas. I will prompt more real-time strategies and entry points at the bottom, remember to pay attention to it as soon as possible.

Pay attention to the 3350 high point suppression!At present, we are paying attention to the short-term pressure near 3340-3350. If this position is not broken today, the daily line will continue to maintain a downward oscillation state, and continue to pay attention to the short-term competition near 3340-3350. Considering that the US dollar index is at a relatively high level in the short term, there is a certain demand for pressure repair, which may also bring a certain range of fluctuations to gold. Therefore, the gold operation maintains a range of fluctuations of 3300-3350. In the short term, we also need to pay attention to the emotional impact brought by fundamentals. From the current gold trend analysis structure, the short-term support below continues to focus on the vicinity of 3310-3300, the short-term suppression above focuses on the vicinity of 3340-3350, and the key pressure above focuses on the vicinity of 3380. The overall trend is running around the 3300-3350 range. The operation is mainly to participate in the volatile market with the idea of selling high and buying low, and remain flexible in response. It is recommended to wait and see more and do less in the middle position, chase orders cautiously, and wait patiently for key points to enter the market.
Gold operation strategy: Go long when gold falls back to around 3315-3305, with a target of 3335-3340.

Today’s main strategy: bulls take the lead, followed by bears!Yesterday, gold maintained a range of fluctuations. The game between bulls and bears was fierce but failed to break the current structure. The overall trend is not clear for the time being. From a fundamental perspective, risk aversion still dominates market expectations, which makes the gold trend lack a directional breakthrough. However, we need to be vigilant that the main funds may force the gold price to fall through extreme suppression in the future. From the 4-hour cycle, gold has been under pressure near the upper track of 3377 and has fallen continuously. It has fallen below the middle track support and touched the lower track. The current price is temporarily supported near the lower track, but the overall situation is still in a wide range of fluctuations. The trend has not yet formed. The short-term strength of the US dollar also suppresses the gold rebound. The current bulls and bears are anxious, and the key support and resistance have not been effectively broken. Currently, pay attention to the effectiveness of the support in the 3325-3320 area. If it pulls back to this area, you can consider a short-term long layout, and the target is the 3340-3350 range above. If it rebounds to this area, you can choose to stop profit and go short at the right time, and the target is the lower track area. If the downward momentum is strong, it may fall below yesterday's low to form a continuous decline.

The high probability intraday trading strategy for gold is here!After gold fell below 3341 yesterday, the highest point of the rebound was around 3350-52. Today, we are long at 3320-25, and the target of 3340-45 has been reached. We continue to pay attention to the short-term suppression of 3340-45, but the overall rebound strength is limited. The 3340-45 point fell back several times last Friday, and it is now broken again. Therefore, we can participate in the short position at 3340-3345 in advance. Gold rebounded at 3322 today. Technically, it needs to rebound and repair when it falls back to 3316-20, so we can look for opportunities to go long below to seize the profit space of the rebound.
From the 4-hour analysis, the short-term pressure above is around 3340-3345, and the current focus is on the support of the middle track 3310 at the hourly level. If the gold price can effectively hold the 3310 area, it is expected to bottom out and rebound and test the intraday high, but the upper rail resistance of the 3345 channel is strong, and it may still fall under pressure when it is touched, and the range shock judgment will be maintained at that time. In terms of operation, if you hold this support, you can consider light positions to try short-term longs, and pay attention to the short-term support of 3320-3315 below. Relying on this range to maintain the main tone of high-altitude low-multiple cycles during the day, the middle position is always more watchful and less active, cautiously chasing orders, and patiently waiting for key points to enter the market. I will prompt more specific operation strategies at the bottom, and pay attention in time.
Gold operation strategy: Gold falls back to the 3322-3317 line to go long, the target is 3335-40 line, and continue to hold if it breaks.

Treat intraday fluctuations as long first and short later!Gold started to rebound near 3322 at the opening. Our long positions near 3324 are also in floating profit. We first focus on the short-term suppression of 3340-3345 on the upper side. The support below is at 3325-3320. We operate in this range. Technically, it needs to rebound and repair the demand when it falls back to 3320, so we can find opportunities to go long to grasp the profit space of the rebound.
4-hour cycle analysis: The strong dividing line of long positions below is at the 3320 first-line mark, and the short-term support focuses on the 3325-3320 range. The overall bullish rhythm of pulling back to lows and going long is maintained. Short-term pressure focuses on around 3340-3345. The overall main tone of participating in the high-altitude and low-multiple cycles remains unchanged relying on this range.
Gold operation strategy: Go long on gold when it falls back to around 3325-3320, target 3335-3340, and continue to hold if it breaks through.

How to find stable trading opportunities in gold fluctuations?Today, the rhythm of gold going short first and then long is perfectly grasped. Congratulations to those who followed the trading plan for reaping good returns. We are still holding long orders at present, and the overall position is arranged around the idea of stepping back to low and long. From the current market structure, the 3325-3320 area below is an important dividing line for the bulls to be strong, and it is also a key support level that determines the subsequent direction. If this area stabilizes, the short-term structure will still be bullish and unchanged, and the rhythm of stepping back to low and long is expected to continue. It is expected that gold will rebound to 3340-3350 and the upper target again. If 3320 is lost, it is recommended to stop loss as soon as possible, and the defense position is recommended to be set below 3315 to prevent the short-term structure from turning short and bringing further callback risks. The core of this round of trend is that only by holding the support can we be qualified to talk about rebound; if the support is lost, we need to turn decisively to prevent being passive. The current market volatility has intensified, but the direction has not yet completely broken. The focus of operation is still on entering the market around key points, switching positions between long and short positions to find the rhythm, blindly chasing orders and emotional operations will be taboos in the current market. Opportunities are not absent, but they belong to those who are always ready. The structure is not broken and the low and long will not change.
Gold bearishness once again in line with expectationsThe data released so far show that the US inflation data is stable and tends to decline, which increases the possibility of the Fed's monetary policy. The US dollar index fell first and then rose. Gold opened at around 3344 and rebounded all the way. The current highest rebound is around 3366. It fell back to 3352 before the data was released, and then quickly rebounded to 3360. After the data was released, it fell again quickly, and the current lowest touched around 3346. The short orders around 3360-3365 that we shared with brothers before were basically the highest short orders of the day, and we successfully completed our first goal. The brothers who participated in it all made good profits. Judging from the current trend of gold, we continue to participate in short orders during the rebound, and the long position is still around 3335-3330. After the release of the CPI data, it is bearish overall. The core is that it is lower than market expectations but higher than the previous value. Inflation has heated up again, which has once again suppressed the expectation of interest rate cuts. After this data, it also laid a good foundation for the decline in the market. If the price goes up again, it will still rely on the 3365 level to go short again. The data is obviously bearish, and it scared a lot of long positions before it was released.
Gold reference ideas:
Continue to short when it rebounds to around 3358-3365, with a target around 3350-3340;
Go long when it falls back to around 3335-3330, with a target around 3350.
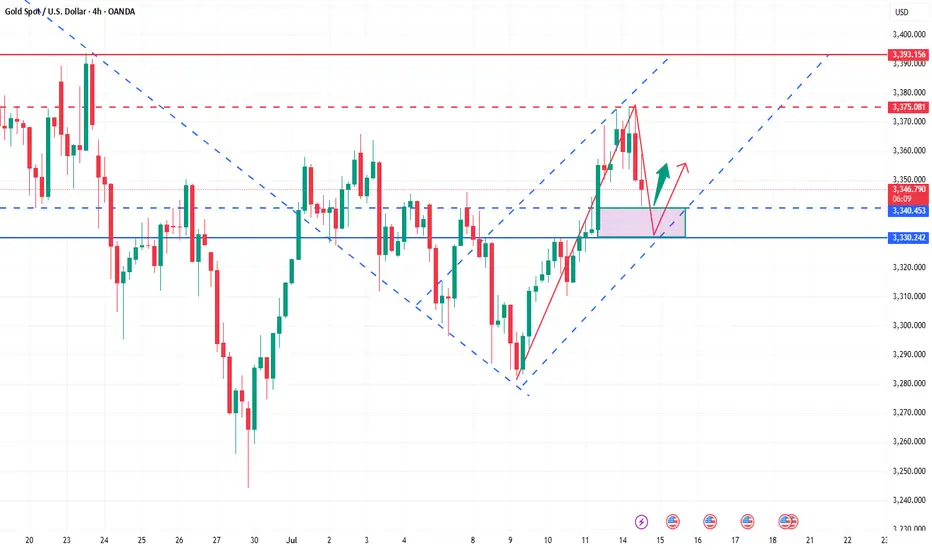
The battle for gold 3375-40 has begun, and CPI is coming!The current market has entered a short-term shock consolidation phase. Taking advantage of the temporary calm of the market, I would like to share my judgment and strategy with my brothers. I still tend to be bullish in the medium term. Yesterday's trend just verified my point of view. If the bulls want to break through the 3375 line, they must first complete the "deep squat wash", and this wave of retracement has also brought good profits to both our long and short traders. Friends who follow should have gained.
But the core of today is the CPI inflation data. As a heavy macro event, the recent forward-looking data (such as employment and labor market) is likely to be bearish for gold. The market has formed a consistent expectation. In this case, I have to temporarily put aside the long thinking and turn to short. My point of view is that as a qualified trader, I have always attached great importance to the data market. Whether it is non-agricultural, CPI or interest rate resolution, I have never easily made mistakes in grasping this kind of structural drive. Since the market has locked the focus of long and short positions in the core range of 3375-3340, we must face up to this structural competition. If the judgment is wrong this time, I will re-evaluate whether I should continue to participate deeply in this obvious data expectation transaction, but for now, I must respect the game logic of the market.
Operation strategy reference:
Currently, the 3360-3366 area can be lightly shorted. If it touches the 3370 line before the CPI is released, it can be appropriately covered; the stop loss is clearly set above 3375. Once it breaks through, leave the market decisively without hesitation. The lower target is 3350-3340 first. If it breaks, continue to look down to the 3330 area.

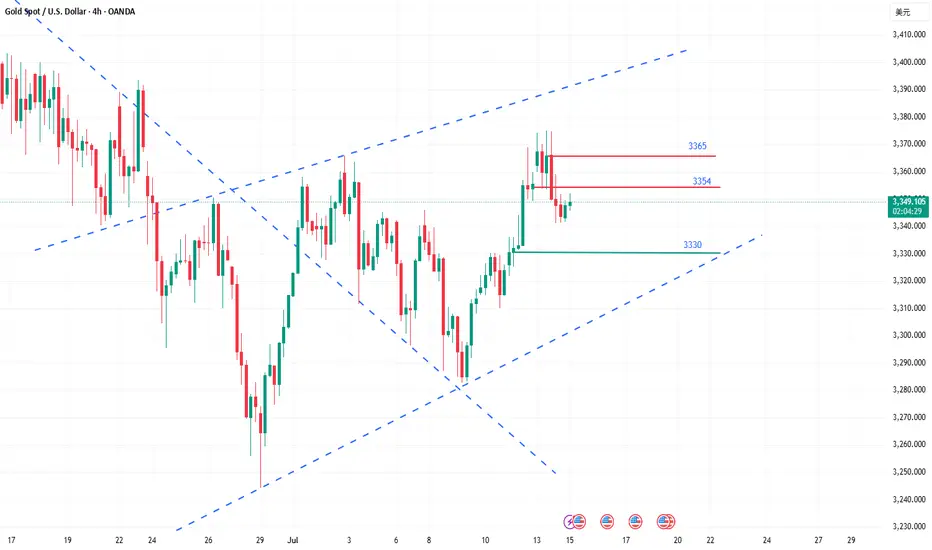
How to grasp the key trading points of gold?Yesterday, gold tested the 3375 line several times but failed to break through effectively. The selling pressure on the market was obvious, and the price immediately fell back, reaching a low of around 3341. The daily line closed with a long upper shadow, indicating that the bullish momentum has weakened and the short-term market has entered an adjustment phase. From the perspective of the 4-hour cycle, the continuous negative trend has led to the gradual closing of the Bollinger Bands, and the middle track position has temporarily gained support, but the overall market is volatile and weak. Today, we will focus on the 3354 watershed. If the rebound fails to effectively stand at this position, the pressure on the upper side will still be strong, and there is a risk of a short-term decline.
Key technical positions: upper resistance: 3365, 3354, lower support: 3340, 3330. In terms of operation rhythm, it is recommended to deal with it with a high-selling and low-buying, oscillating approach, and maintain flexible adjustments.
The operation suggestions are as follows: You can choose to short in the 3360-3365 area, with the target around 3350 and 3340; if the rebound is blocked below 3354, you can also enter the short order in advance. It is recommended to enter and exit quickly in the short-term weak market; strictly control the stop loss to avoid risks caused by sudden changes in the market.
The current market is obviously volatile, so don't blindly chase the rise and fall. It is particularly important to operate around the key pressure and support areas. The grasp of the rhythm will determine the final profit, and steady trading is the kingly way.
Two lines of defense for bulls: 3340 and 3330 are the key!Gold maintains a strong pattern in the short term, and it is recommended to mainly buy on dips. The short-term support below focuses on the neckline of the hourly line at 3340 last Friday. The more critical support is locked at the 3330 line. This range is an important watershed for judging the continuation of short-term bullish momentum. As long as the daily level can remain stable above the 3330 mark, the overall trend will remain upward. Before falling below this position, we should adhere to the idea of buying low and buying low, and rely on key support levels to arrange long orders. At present, the price has completed a technical breakthrough and broke through the upper edge of the 3330 convergence triangle under the dual positive factors of Trump's tariff landing to stimulate risk aversion and the support of the Fed's interest rate cut expectations, and formed three consecutive positive daily lines. It is necessary to pay attention to the short-term pressure at the 3375 line. The overall operation strategy will be combined with the real-time trend prompts during the trading session, and pay attention to the bottom in time.
7.15 Gold Market Analysis and Operation SuggestionsFrom the 4-hour analysis, the short-term support below focuses on the neckline of the hourly line of last Friday, 3340-45, and focuses on the support of 3325-30. The intraday retracement continues to follow the trend and the main bullish trend remains unchanged. The short-term bullish strong dividing line focuses on the 3325 mark. The daily level stabilizes above this position and continues to follow the trend and bullish rhythm. Before falling below this position, continue to follow the trend and follow the trend. Maintain the main tone of participation.
Gold operation strategy:
1. Go long when gold falls back to 3340-45, and add more when it falls back to 3325-30, stop loss 3317, target 3365-70, and continue to hold if it breaks;
Gold rises strongly, aiming for a new high!Last Friday, gold continued to rise strongly, breaking through 3320 in the Asia-Europe session and accelerating its rise. The European session broke through the 3340 mark continuously. The US session broke through 3369 and then fell back. The daily line closed with a big positive line. It broke through the high for three consecutive days and returned to above 3360. The unilateral bullish pattern was re-established. Today, the gold price jumped high and broke through 3370 and then fluctuated at a high level. Although it rushed up, the strength was limited. It must be adjusted after a short-term retracement before it can continue to rise. Therefore, in terms of operation, we continue to maintain the main idea of retreating and multiplying. Pay attention to the 3340-3345 area for short-term support during the day, and look at the 3330 line for strong support. If it does not break, it will continue to be a good opportunity to buy low and do more. Taking advantage of the trend is still the current main tone. As long as the daily level does not break 3330, the bullish structure will not be destroyed.
🔹Support focus: 3340-3345, key support level 3330
🔹Resistance focus: 3380-3393 area
1️⃣ If the price falls back to 3340-3350, a light long position will be intervened, with the target of 3365-3370. A strong breakthrough can see a new high;
2️⃣ If the price rises to 3380-3393 and is under pressure, a short-term short position adjustment can be tried, with a short-term target of around 3360.
The specific real-time points and position arrangements will be updated at the bottom. Interested friends are advised to pay attention to my strategy tips in a timely manner and seize every opportunity reasonably.
It is the right time to go long after the shock and adjustmentGold opened higher at 3364 today, and after a brief surge to 3374, it entered a stage of shock and retracement. Our plan to arrange short orders near 3370 was successfully implemented, and we stopped profits in batches in the 3360-3355 range, making short-term profits. Overall, although it jumped higher due to the stimulus of news such as the increase in tariffs over the weekend, the momentum of the surge is limited, and the technical side still needs to retrace to digest the gains.
At present, the market has returned to the technical rhythm. The key support refers to the breakthrough point of 3340-3345 last Friday. Further exploration will look at the strong support of 3330. The overall rhythm is still mainly to arrange long orders near the low support, and going with the trend is the key. As long as the 3330 support is not broken, the daily line structure will still maintain a strong bullish trend. Do not blindly chase the short position. The operation of short orders against the trend needs to be particularly cautious. I will promptly remind you of the specific operation strategy according to the changes in the market. You can pay attention to the bottom notification. It is recommended that you keep paying attention and respond to the market rhythm steadily.
Reference for gold operation strategy: Go long on gold near the 3345-3355 area, target the 3365-3370 line. If it breaks above 3370, you can continue to hold and hope for further continuation.
