Where will gold go?In 4 hours, it has fallen below the previous low of 3295, and will continue to fall. There are two supports below, namely 3280 and 3265. Don't expect a big rebound before going short in a negative market. If the rebound is large, it will not fall. This kind of negative decline is generally judged by the 15- and 30-minute patterns. When resistance appears in the big cycle, the market has actually fallen a lot.
Today, I think the pressure is mainly in the 3300 and 3310 areas. 3310 can be considered as the pressure of the top and bottom conversion. Pay attention to 3280 and 3265 below. If you consider going long, these two positions are the main positions. For the time being, the general direction is mainly short.
Goldtrend

There are opportunities for both bulls and bears in gold!Gold fell back and closed lower yesterday. The daily line closed with a negative cross overnight. The overall market has not changed much. The short-term repeated tug-of-war is temporarily consolidating. Today is the closing of the weekly line, and we will continue to maintain the volatile thinking. In the 4H cycle, the Bollinger Bands closed, temporarily exerting pressure on the middle track. After rebounding to 3350 yesterday, it failed to continue and remained in a weak shock pattern. Therefore, today's operation is mainly short and supplemented by long. The upper pressure is at 3328 and 3336. Short according to the rebound strength, pay attention to the rise and fall of 3310 below. A breakthrough may see the previous low of 3295. If the support is not broken, you can consider going long.🔔For more specific operation details and strategy updates, please pay attention to the notification 🌐 at the bottom.
Gold operation suggestion: short gold around 3328-3338, target 3315-3310.

Gold shorting opportunity not to be missedGold hit the key resistance of 3350 and then fell under pressure, reaching a low of 3309, and was temporarily supported by the low point on Wednesday. The intraday showed a pattern of rapid decline after a volatile rise, highlighting the long-short tug-of-war pattern. The hourly line fell again after a pullback to 3328, indicating that there is still room for short-term retracement. The current operation needs to focus on key points: short orders can be entered again near the pullback of 3328-3335. If the market continues to decline, focus on the support range of 3300-3290, and long orders can be arranged if it stabilizes. The overall idea of oscillation is maintained. Before effectively breaking through 3350 or losing 3290, high-altitude and low-long are still the main strategy.
Gold recommendation: short near 3328-3335, target 3315-3305

Gold rebound is blocked and high-altitude strategy continuesGold continued its bullish correction yesterday, reaching 3336 in the European session, and continued to retreat in the US session, reaching a low of around 3312 before temporarily stopping, and started a second pullback correction, and finally closed around 3332. Today, it opened at 3333, rebounded to 3340, and then entered a shock consolidation. Currently, the upper side focuses on the suppression of the 3342-3350 area. If the price cannot effectively break through and stand firm in this area, gold still has room for further retracement. In terms of operation, it will continue to rely on this suppression range to maintain a high-altitude thinking during the day, and follow the trend to see a decline. The recent market trends are basically the same, bottoming out and rebounding. In terms of strategy, keep a sense of rhythm and mainly short at highs.For more specific operation points, please pay attention to the notification at the bottom🌐.

Short gold after reboundGold rebounded after touching 3312, and has now rebounded to 3330, but the rebound strength is far less than the decline strength, so the overall performance of gold is still weak. Because gold fell sharply yesterday, the market bullish confidence suffered a heavy blow, and there are many resistances above after gold fell and broke, and it is under pressure at 3340-3350 in the short term, and there is a technical gap above that suppresses the 3360-3370 area.
Therefore, before gold stabilizes in the 3360-3370 area, the short-selling force still has the upper hand, so we still focus on shorting gold in trading. We can consider shorting gold with the 3340-3350 area as resistance, and look at the target area of 3320-3310.
The Premium privilege of my account will end on June 26, and it will stop updating here from tomorrow. Friends in the channel have already made a lot of money by following my trading strategies. Friends who have not joined yet can join and receive the latest trading strategies and trading signals in the first time to protect your trading!

Opportunities only come to those who ambush in advanceAfter Trump announced that Israel and Iran had reached a comprehensive ceasefire agreement, the market's risk aversion sentiment cooled significantly, and the price of gold once plummeted by more than $30. Although the stability of the ceasefire agreement is in doubt, the rebound in risk appetite dominates the market trend, with stock markets rebounding, oil prices falling, and demand for safe-haven assets falling. Powell will deliver a semi-annual monetary policy testimony, and the market is paying attention to his statement on the timing of the July rate cut. At present, the internal differences of the Federal Reserve on interest rate cuts have intensified. If Powell sends a signal that the number of interest rate cuts this year is limited, it may strengthen the rebound of the US dollar and suppress gold prices; on the contrary, if the stance is dovish, it may ease the downward pressure on gold prices. In the short term, the fading of geopolitical risks and the warming of risk appetite are the main reasons for the decline in gold prices, but the weakening of the US dollar and the potential dovish tendency of the Federal Reserve still provide support. In the medium and long term, global economic uncertainty, geopolitical risks and expectations of the Federal Reserve's loose policy still constitute structural support for gold.
From a technical perspective, the gold daily moving average system is in an intertwined state, and the forces of bulls and bears are relatively balanced. The current short-term resistance above is around 3320-3333, which is an important psychological level. If an effective breakthrough is achieved or the upside space is opened, the support below will focus on the 3285-3295 line, which is the lower edge of the May oscillation platform. If it falls below, the pressure of the correction may increase. The loss of the middle track in the 4-hour chart further confirms the short-term weak structure and provides technical support for the downward trend. It is recommended to go long on the pullback near 3285-3295. At present, gold continues to fall in line with the trend.

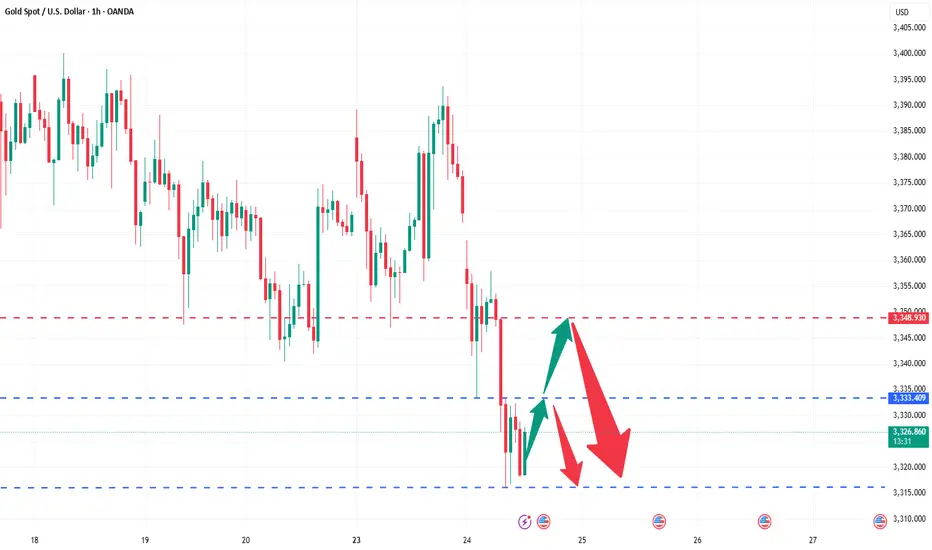
The golden storm is coming again, are you ready?Gold rebounded after falling back to 3333 in the first wave, and then rebounded to 3357 in the second wave before falling again, breaking through the previous low of 3333 and accelerating down to 3316. Currently, the short-term trend has stabilized in the 3316 area, which is also the support level for multiple rebounds in the previous period. After continuing to fall today, it has not broken through. We have arranged long orders in the 3316-3317 area in advance and have taken profits near 3331. Gold rebounded after stepping back again. Our long order plan is still in position. If the subsequent rebound breaks through the 3333 line, it is expected to further rise to the 3340-3348 area. We will try to short in this area.
In the short-term structure, the upper resistance focuses on the 3340-3348 area, and the lower support focuses on the 3310-3315 area. 3300-3305 is the watershed between the strength of long and short positions in the short term. The daily level is still under pressure as a whole, and the main idea of high altitude continues.
Gold operation strategy: short gold when it rebounds to around 3340-3348, target the 3330-3320 range.
Are you ready for the next wave of gold market?Gold fell back as expected after opening high. Today's strategy arranged long orders at 3350-3352, and successfully closed the market at around 3362 with profit. The subsequent three short orders also closed the market at a profit as expected. The points were perfectly predicted, and the long and short positions were perfectly grasped during the day. The strategic ideas were disclosed in advance and all were fulfilled.
At present, the overall trend of gold is still bullish, and it is in the adjustment stage in the short term. The large range this week is 3340-3405. Although there is a rebound, the upward pressure is still not small, and the gold price may continue the wide range of long and short fluctuations. Pay attention to the 3355-3340 area below. In terms of operation, long orders are arranged according to the strength of the retreat; pay attention to 3385 in the short term above. If it can effectively break through, look at 3395-3405. The strong pressure is still at the 3405 line. If it does not break, it will still fall under pressure. On the contrary, if it stabilizes, it is expected to hit last week's high.
Operation suggestion: When gold falls back to around 3355-3340, long orders can be arranged in batches, with the target at 3370-3380. Short orders will be adjusted according to the real-time market, please pay attention to the bottom 🌐 notification for specific points.

It’s the right time to make a golden layout!Last Friday, the overall gold price continued to be suppressed and fell back to fluctuate and adjust. Finally, it stabilized at the 3340 mark before closing and rebounded and fluctuated. The daily K line closed with a fluctuating number K. The overall gold price continued to be suppressed and fluctuated in the near term. However, the US military attacked Iran's nuclear facilities over the weekend, exacerbating geopolitical tensions in the Middle East, and the market's risk aversion sentiment heated up. Today, the gold price jumped high and fell back into a volatile state. In the short term, the gold price is likely to continue the wide range of long and short fluctuations, and continue to trade time for space. Although gold opened high and went low, it still did not break the bullish trend channel. Looking for opportunities to go long after stepping back is also the current trend.
From the current market trend, today's technical support below is around 3345-3355, focusing on the gains and losses of the 3340 line; the upper short-term resistance is around 3380-3385, focusing on the 3395-3405 line. Relying on this range to maintain the main tone of high-altitude low-multiple cycle participation during the day, the middle position is always more watchful and less active, cautious pursuit of orders, and patiently waiting for key points to enter the market.
Gold operation strategy: go long when gold falls back to around 3350-3355, and add to long positions when it falls back to 3340-3345. The target is 3370-3380.Counter-trend short orders will be entered at an appropriate time based on market changes, and the specific points will be subject to the bottom 🌐 notification.

Follow the trend and go short, and buy when the price falls backAffected by the situation in the Middle East, gold opened higher and lower again on Monday, and the trend was exactly the same as last Monday. After the opening, gold fell back to the 3352-3355 line and fluctuated. We planned to arrange long orders near 3350, but gold went up directly and did not give an entry opportunity. During the rebound, gold was blocked and under pressure at the 3366 line, and at the same time, there were signs of stagflation at high levels. Combined with the short-term adjustment needs, the strategy was to arrange short orders near 3364 and successfully stop profit at the target of 3350. Then we went long at the 3348-3350 line, which is also the preset long entry area. The current target continues to focus on the 3370-3380 area. So far, although gold opened high and went low, the overall bullish trend channel has not been broken, and the retracement to long is still the current mainstream direction.The specific points are subject to the bottom 🌐 notification.
From the current trend, the support below focuses on the 3340-3345 area. Combined with the stimulus of the Middle East situation over the weekend, the short-term upper resistance focuses on the 3380-3385 area. The expectation of breakthrough is still there, and the focus is on the suppression performance of the 3400-3415 line. The overall strategy continues to rely on the idea of buying on pullbacks. Watch more and do less in the middle position, chase orders cautiously, and wait patiently for clear signals at key points before intervening.
Gold operation strategy: Gold retracement near the 3340-3350 line to do more, the target is 3370-3380.

Gold bottomed out and rebounded, continue to go longAffected by the situation in the Middle East, gold opened high and fell again on Monday, just like last Monday. At present, it has fallen back to the 3352-3355 line and fluctuated. Although it is under short-term pressure, the bull channel has not been broken, and the retracement is still a long opportunity. The support below is 3340-3345, and the short-term resistance is 3380-3385. It is only a matter of time before it breaks through. The key suppression is still in the 3400-3415 area. In terms of strategy, continue to arrange long orders around the retracement, be cautious in chasing orders in the middle oscillation zone, and wait patiently for key position signals. The specific points are subject to the bottom 🌐 notification.
Gold suggestion: arrange long orders around 3340-3350, and the target is 3370-3380.

Wait for the key points to be confirmed before taking actionThe trend of gold on Friday is still in line with my analysis. Before the market opened, I suggested that gold would rebound from the bottom. Considering the resistance level, I would arrange short orders with a light position. I clearly emphasized that I should not chase short orders at low levels. The actual market price fluctuated upward after hitting the 3340 line at the lowest point, and maintained a range-bound fluctuation pattern as a whole. We arranged long orders in batches at 3342-3353, successfully stopped profit near 3358, reversed shorting, and stopped profit again at 3342. After that, the market hit the top again and was blocked. Short orders were arranged at 3370-3375. It is not recommended to hold positions over the weekend. I have already left the market with a small profit near 3365. Although there was no significant breakthrough, all ended with profit, but it was quite satisfactory for Friday's market.
News: Gold prices were stable on Friday, but fell 1.8% this week. It closed at 3368. The latest Federal Open Market Committee (FOMC) statement reinforced the Fed's cautious stance, keeping interest rates in the 4.25%-4.50% range. However, the statement also lowered the number of expected rate cuts this year, which put downward pressure on gold prices. In addition, U.S. Treasury yields did not change much but rose slightly, reflecting the stabilization of market risk sentiment. The 10-year Treasury yield rose by more than 2 basis points to 4.421%, and the 30-year Treasury yield rose to 4.924%. Rising yields often put pressure on non-yielding assets such as gold, further suppressing the upward momentum of gold prices. The Fed's failure to immediately launch an easing policy, coupled with a stronger dollar and a reduced urgency of geopolitical risks, have all exacerbated selling pressure. Unless tensions escalate again or the Fed unexpectedly turns, short-term gold price forecasts point to further weakening.
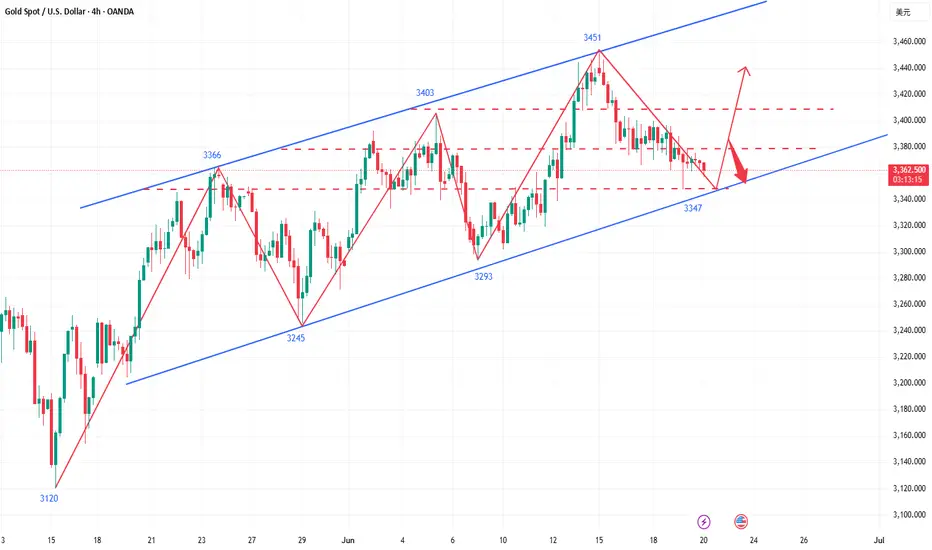
The price of gold has rebounded since it fell from its historical high of 3500 to 3120, After continuous rise, due to the decline of risk aversion in the market, it fell under pressure at 3452. It rebounded to 3340 on Friday. The K-line combination arrangement was bearish. The 4H chart showed a stop-loss signal. It is expected that the market will consolidate below 3400 in the short term. In the medium term, attention should be paid to the geopolitical crisis and the July interest rate decision of the Federal Reserve. It will break through the node after confirming the upper resistance of 3400. In the short-term 4-hour chart, the lower support is around 3340-3345, and the upper short-term resistance is around 3380-3385. Focus on the suppression of the 3400-05 line. The overall idea of retracing back to long positions remains unchanged, and the middle area is mainly kept on the sidelines. Be cautious in chasing orders and wait patiently for the key points to be confirmed before intervening. If the upper resistance is not broken, you can still consider light positions to arrange short orders, and pay attention to the bottom for the specific entry point.

Precise short orders in 3370-3375 area are launched!Gold has been volatile recently, with intraday fluctuations ranging from 1 to 200 US dollars, which greatly increases the difficulty of operation for retail investors. On the surface, there are many opportunities, but there are only a few real big market opportunities. If you miss the rhythm, you can only watch your funds shrink. Remember that risk management is crucial.
From the 4-hour analysis of gold, there are repeated resistances from bulls before the downward break; once it breaks down, the market will go further down, and the focus below is 3340. The upper short-term is 3370-3380, and the important resistance is 3400. Only by breaking through the bulls can the rebound continue. In terms of operation, sell high and buy low, and pay attention to the breakthrough!
There are too many long orders accumulated at the current high level of gold, and the market will not rise sharply easily. The current international situation is so tense, and gold is still slowly declining. In this situation, it is difficult to rebound sharply.
Operational suggestions: For short orders above, focus on the layout of the 3370-3375 area, strictly set a stop loss, target more than 20 points, control risks, and follow the trend.

Hold on to the high point and go short decisively!Gold closed the weekly line today, maintaining the idea of oscillating downward. The 4H consecutive negatives tested the support of the lower Bollinger track. Although it was roundabout and saw-sawed, every decline would be accompanied by a new low. Therefore, hold the high point to see the bottom break and accelerate. The lower side will gradually look to 3338 and 3315. Among them, 3315 is a strong support for the weekly line. If it is not broken, you can consider going long; the upper rebound pressure is 3361 and 3375. In terms of operation, short according to the rebound strength, and the specific points are subject to the bottom 🌐 notification.
Operation suggestion: Short gold in batches near 3361-3375, with a target of 3350-3340.

The bulls are not dead yet, it’s time to ambush at low levels!Gold only opened higher and rose on Monday this week, and then reached the highest level of 3452, and then started the road of shock and retracement this week. As of today, Friday, gold is still oscillating and adjusting in the lower range, but from the 4-hour market trend, the trend of gold is still dominated by bulls. In the short term, gold is oscillating and adjusting at a low level. Today, Friday, we will first focus on the support level of 3347-3353 below, which is also the starting point of the rebound yesterday. If this position is not broken today, Friday, we will mainly rebound and close.
From the 4-hour analysis, the support below focuses on 3347-3353, and the short-term resistance above focuses on the 3378-3385 level, with a focus on the 3408-3415 level. Continue to rely on this range to maintain the main tone of high-altitude low-multiple cycle participation unchanged, and the middle position is always more watchful and less active, cautiously chase orders, and patiently wait for key points to enter the market.
Gold operation strategy: Go long when gold falls back to 3347-3355, with a target of 3370-3380.
If you still lack direction in gold trading, you might as well try to follow my pace. The strategy is open and transparent, and the execution logic is clear and definite, which may bring new breakthroughs to your trading. The real value does not rely on verbal promises, but is verified by the market and time.
Gold continues to fluctuate, and range operations are effective!Gold opened high on Monday and then fell sharply. On Tuesday, it fluctuated and corrected with a cross-yang line. On Wednesday, the overall trend was also volatile. However, after the Fed's interest rate decision was announced on Wednesday, the price of gold fell to around 3362. The low point of this decline was just supported by the 10-day moving average. From a technical point of view, the support of the 10-day moving average at 3350 has become a key point. If this support can be effectively maintained, the gold price is expected to maintain a volatile pattern; once it breaks down, the short-selling force may continue, and then it will be necessary to look at the support of the 20-day moving average near 3350. In terms of upper resistance, the 5-day moving average is currently near 3390, which will suppress the upward movement of gold prices. Further resistance depends on the gains and losses of 3405.
There is not much change in the 4-hour chart. The lower track has not opened, and the support of 3360 is strong. It is still a bullish trend. However, it is worth noting that in the continuous rebound, the Bollinger middle track suppression point has not been broken. Relatively speaking, gold is weak and volatile in the medium term. Under the trend today, if it continues to rise, we must pay attention to the gains and losses of the dense suppression point 3405. If 3405 is broken, the trend strength will come out and we can see the high point of 3430. For intraday trading, we still maintain high-altitude and low-multiple, waiting for the trend strength to break through the space, and we are bullish above the support of 3350 during the day.
Gold operation strategy: It is recommended to short at the rebound of 3385-3390, with a target of 3370-3365; gold falls back to 3350-3355 and buys, with a target of 3375-3385;

Gold breaks down, short-term bears dominate the rhythmThe Fed's June resolution kept interest rates unchanged, but Powell's remarks (expected to slow down the pace of future rate cuts) suppressed gold prices, causing gold prices to fall from around $3,396 to $3,362; the rebound of the US dollar index put short-term pressure on gold, but gold rebounded slightly when the US dollar pulled back; the conflict between Iran and Israel continued to ferment, and the safe-haven demand partially supported the gold price, limiting the decline. After several days of volatility, gold opened slightly higher today and then fell sharply to $3,347.56 per ounce, breaking the unilateral decline in the volatile trend. The 4-hour moving average is in a short position, the Bollinger band is narrowing, and the gold price is running near the lower Bollinger band. Therefore, today's operation is to rebound and short.
Operational suggestions: Arrange short positions in batches in the 3370-3385 range, follow the trend, and control risks. Target 3350-3340.

Range oscillation, strategy remains unchanged!The Federal Reserve kept the interest rate unchanged. Gold did not break through the range we gave after all. The important support below is still at 3365-3360. Today, we continue to operate in the range and keep high and low as yesterday. Gold touched the lowest level of 3362 without breaking through, and still rebounded. The long orders of 3372 and 3363 that we arranged have successfully stopped profit at 3380, so we continue to operate in the range.
From the current analysis of gold trend, gold continues to focus on the important support of 3365-3360 below, and focuses on the short-term suppression of 3400-3415 above in the short term. The operation is mainly carried out in the range for the time being, and there is a high probability of continued volatility in the short term.
Gold operation strategy: Go long when gold falls back to 3375-3370, and cover long positions when it falls back to 3365-3360, with the target of 3380-3390-3400.

Once again, we seized a golden opportunityYesterday, gold fluctuated throughout the day and failed to break through the key range we pointed out. The current structure continues to fluctuate. During the day, we will continue to pay attention to the strong support of 3365-3360 below. This area is the key defensive position we emphasized yesterday. As long as this area is not broken, the bulls still have a chance to make a comeback. The long orders we arranged today at 3370-3375 have all been taken profit near 3387, and the short-term is perfectly realized! At present, 3400 above is the primary pressure position. We have also given a short order plan. We continue to hold it at present, and the target is to take profit when it falls back to 3380-3375.
The overall idea is to maintain the main long and auxiliary short rhythm. In terms of operation, the interval thinking is prioritized, and wait for the key points to be confirmed before taking action. If it breaks through, change the idea in time.
Operation suggestion: Gold falls back to 3375-3370 and goes long with a light position, and further falls back to 3365-3360 to cover the position. The target is 3380-3390-3400.
If you still lack direction in gold trading, you might as well try to follow my pace. The strategy is open and transparent, and the execution logic is clear and definite, which may bring new breakthroughs to your trading. The real value does not rely on verbal promises, but is verified by the market and time.

Golden opportunity comes again!Gold fluctuated all day yesterday, and finally did not break the range we gave. Today we continue to focus on the strong support range of 3365-3360, because this position is also the important key support we gave yesterday. Today we continue to look for opportunities to go long when we step back. As long as the strong support position below is not broken, there will be hope for the bulls to make a comeback.
From the current analysis of gold trends, gold continues to focus on the short-term support near 3375-3370 below, and the important support is around 3365-3360. The short-term focus is on the short-term suppression near 3400-3415 above. The operation is temporarily based on the range. There is a high probability that the short-term fluctuations will continue. Wait patiently for the key points to enter the market.
Gold operation strategy: Go long when gold steps back to 3375-3370, and cover long positions when it steps back to 3365-3360. The target is around 3380-3390-3400.
If you still lack direction in gold trading, you might as well try to follow my pace. The strategy is open and transparent, and the execution logic is clear and definite, which may bring new breakthroughs to your trading. The real value does not rely on verbal promises, but is verified by the market and time.
Have you caught up with this golden opportunity?The 4-hour K-line pattern of gold shows that the upward trend remains intact, focusing on the strong support range of 3360-3365 (technical resonance with the 5-week moving average). Before the price effectively breaks below the support band, the bulls still have upward momentum, otherwise the trend may reverse. The 3365-3400 range is maintained for intraday fluctuations. The gold operation strategy recommends arranging long orders in the 3370-3375 area when the price falls back, and adding positions to long positions if the support of 3360-3365 is broken.
Operation strategy: Gold recommends going long near 3370-3375 now, and adding positions to long positions in the support area of 3360-3365 when the price breaks, with the target of 3380-3390.
If you still lack direction in gold trading, you might as well try to follow my pace. The strategy is open and transparent, and the execution logic is clear and definite, which may bring new breakthroughs to your trading. The real value does not rely on verbal promises, but is verified by the market and time.

Have you seized the golden opportunity again and again?Today, the strength of gold is very weak. It only rushed up at the opening, and quickly fell below the 3400 mark. Keeping above the key point of 3400, gold continues to be bullish. Now that it has fallen below 3400, the short-term has gone out of the small-level top, and the market is no longer so strong. For our short-term operations, the short-term correction of gold prices focuses on the daily cycle MA5 support, and the weekly MA5 support is long. The rebound focuses on the 3403-3408 resistance card. The rebound can be followed by the short-term! Although gold has fallen below 3400, the short-term direction has changed, but the general direction has not changed. It is still bullish. In the future, we still have the opportunity to look at the high point of 3500, but we have to wait for the bottom to stabilize. Now we can only follow the trend. We will do what the market does.
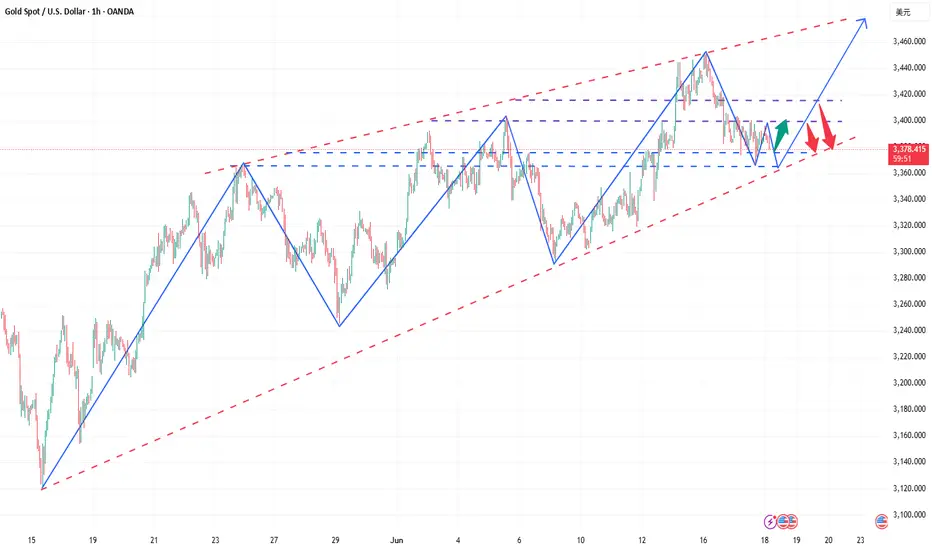
From a technical point of view, the current macd high dead cross in 4 hours has a large volume, and the smart indicator sto is oversold, which represents the 4-hour shock trend. The current bollinger band three-track shrinkage in 4 hours also represents the range compression. At present, the upper pressure of 4 hours is located at the adhesion point of the middle rail and the moving average MA10 at 3404-3409, while the support corresponds to the moving average MA30 and MA10 near the 3380-3363 line. From the current 4 hours, if the price is to fall directly, the rebound will not exceed the 3420-3422.5 line. The current macd dead cross of the gold 1-hour line is shrinking and sticking, and the smart indicator sto is running downward, indicating that the hourly line continues to fluctuate weakly. What we need to pay attention to now is the adhesion pressure of the upper moving average MA60 and MA30 corresponding to the 3412 line. Pay attention to the resistance of 3403 in the short term. Today's short-term operation of gold recommends rebound shorting as the main, and callback long as the auxiliary, and pay attention to the support of 3380-3370 in the short term.

Continue to be bullish after successful adjustment of low longToday, gold opened high at 3448, and fell under pressure after touching 3452. It fell after repeatedly confirming resistance at high levels. We arranged short orders in the 3445-3450 area, successfully touched the target of 3330, and realized profit-taking. Then the market fell back to around 3409 and stabilized and rebounded. We arranged long orders and stopped profit at around 3420. Then we fell back and arranged long orders of 3385 and 3395 to take profits at 3405.
Overall, gold fell slowly after opening high, and maintained sideways consolidation in the European session. The US session continued to fall due to the easing of the geopolitical situation. At present, the focus of the evening is on the support of 3390. If it does not break after the retracement, it can still go long. Pay attention to the key pressure levels of 3410 and 3422 above. The current market is still in the adjustment stage of the upward trend. After the adjustment, it is expected to continue the upward rhythm.
Operation suggestion: Go long on gold when it falls back to around 3390-3392, with the target at 3410 and 3435.
If you still lack direction in gold trading, you might as well try to follow my pace. The strategy is open and transparent, and the execution logic is clear and definite, which may bring new breakthroughs to your trading. The real value does not rely on verbal promises, but is verified by the market and time.
