Gold is sold short term. A must see. Additional operating instru
CAPITALCOM:GOLD NCDEX:GOLD MCX:GOLD1! TVC:GOLD FXOPEN:XAUUSD TVC:DXY OANDA:XAUUSD ACTIVTRADES:GOLD VELOCITY:GOLD
It's time for the U.S. market to open. Review yesterday’s XAUUSD predictions and transactions. Completely suitable. There was no news support today, and gold had some slight rebound. But the market is currently relatively weak. I believe many people have seen that gold has been trading sideways at 2160 for a long time. It proves that the pressure above is still too high. When there is no influence of dominant news, then technical indicators can be used as a good reference. Combined with the hourly candle chart, a small pressure position is currently formed at 2165. Combined with the pressure brought by the track above the BOLL. The three tracks showed almost flat and normal fluctuations. So I think this position is a sell. Then the probability of making money is relatively high.
The operation is mainly selling gold.
2164-2167 are mainly selling. tp2154. sl2176
Personal operation is for reference only. If followed copy signal. Remember to stay tuned for verification.
Goldtrend

Gold Wednesday Trading Strategy
With the release of cpi data, gold fell from 2185 to around 2150.
Tomorrow, gold will be supported at 2165-2168/2170-2174 above and 2145-2141/2132-2136 below. I think gold will break through above and then fall. We can rely on the upper pressure point to sell gold. Buy gold at the pressure point below.
sell 2165-2168/2170-2174
buy 2145-2141/2132-2136
Tomorrow I will give you more accurate trading signals based on specific trading trends. Please join to receive the latest updates

GOLD.. just below his today resistance?#GOLD.. well guys market very well placed 2151 in yesterday and that was our supporting area we we discussed .
Now we have 2160 to 2163 a resistance zone ..
If market told it the. You can see a drop and it will leads you towards downside further areas.
Good luck
Trade wisely

Gold fell again, selling trend todayAfter peaking at 1,282 USD/ounce, the world's gold price today, March 13, was sold very strongly when inflation in the US increased slightly and the USD increased in value compared to many other foreign currencies.
Gold prices reversed sharply today after the US announced data related to inflation that was slightly higher than forecast.
Specifically, the consumer price index (CPI) in February in the US increased by 3.2%, 0.1 percentage point higher than the market expectation of an increase of 3.1%.
CPI increased slightly, making investors worry that inflation in the US may heat up. This may cause the FED to maintain high interest rates for a long time. Accordingly, they increase their holdings of USD to help this currency increase in value. Gold price today is in a disadvantageous position.
On the other hand, US bond interest rates jumped from 4%/year to 4.14%/year, motivating many people to put capital into bonds. Meaning very little money flows into precious metals. Gold prices today are under more pressure to go down.

Gold prices will bottom out and rebound
According to the current gold trend, the gold price now forms a resistance level at 2154-2155. At this stage, the gold price reaches the bottom of 2154 and rebounds. Only by paying attention to my signals at any time can you make the right choice.
Gold price predicted to rise
It is recommended to go long in the short term: go long around $2155-2156
I will share trading strategies and trading ideas every day.
For those who want to make easy profits, follow me in the channel at the bottom of the article to get detailed trading signals. I hope that with my help, everyone can make huge profits!
Gold price - CPI waits for a DOWN adjustment⭐️ Smart investment, Strong finance
⭐️ GOLDEN INFORMATION:
Gold prices remained relatively unchanged towards the end of the North American session as traders prepared for the release of February's US Consumer Price Index (CPI) data. It is expected that the headline figures will remain unchanged, while core data is anticipated to cool down. This could put pressure on the US Dollar and provide a boost to XAU/USD. Currently, the price of Gold is trading at $2,180.60, showing minimal movement.
In the previous week, the price of Gold reached a record high of $2,195.15, just shy of breaking the $2,200 mark. This occurred after Jerome Powell, Chair of the US Federal Reserve (Fed), testified at the US Congress and acknowledged that inflation was decreasing. Powell mentioned that eventually, the Fed would begin to implement more accommodative policies, but stressed that the central bank's decisions are reliant on data. Despite expressing confidence that inflation is gradually decreasing, Powell emphasized that there is no urgency to lower borrowing costs.
⭐️ Personal comments NOVA:
US CPI data assesses the current level of inflation.
It's time for a DOWN adjustment to create liquidity for the market
⭐️ SET UP GOLD PRICE:
🔥BUY GOLD zone: $2135 - $2137 SL $2130
TP1: $2142
TP2: $2150
TP3: $2160
BREAK OUT price range:
SELL: $2175
BUY: $2185
🔥SELL GOLD zone: $2198 - $2200 SL $2205
TP1: $2190
TP2: $2175
TP3: $2160
⭐️ Technical analysis:
Based on technical indicators EMA 34, EMA89 and support resistance areas to set up a reasonable SELL order.
⭐️ NOTE:
Note: Nova wishes traders to manage their capital well
- take the number of lots that match your capital
- Takeprofit equal to 4-6% of capital account
- Stoplose equal to 2-3% of capital account
- The winner is the one who sticks with the market the longest

#GOLD.. now supporting area ? What's next? #GOLD.. well guys market very well hold your area 2181 as we discussed in our video analysis.
And now market have his immediate supporting area is 2151
Keep close that area because next move will start below 2151 .
Good luck
Trade wisely

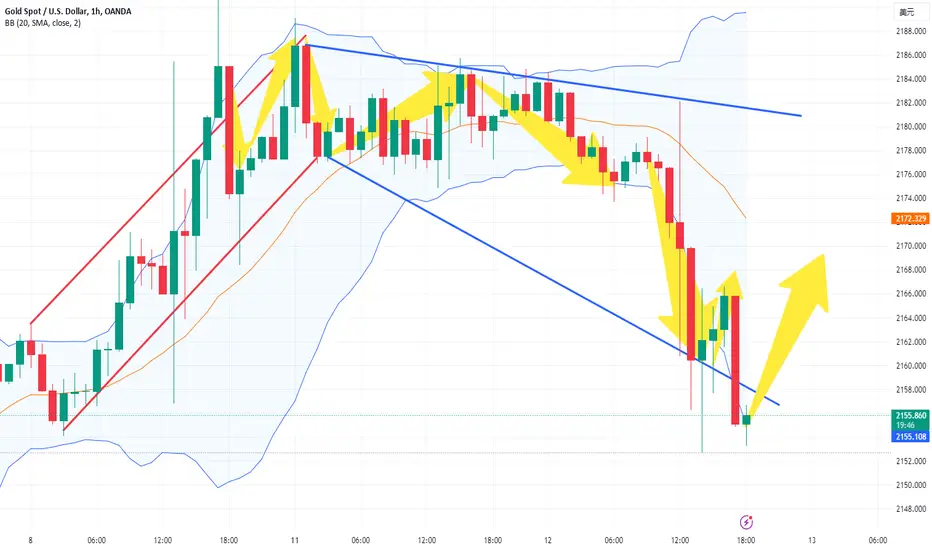
GOLD-Analysis and Strategy
U.S. inflation may have only gradually weakened last month, with retail sales rebounding, which may lead to the Fed not being eager to lower interest rates. The core consumer price index, a measure that excludes food and fuel to better reflect underlying inflation, is expected to rise to 0.3% in February from 0.4% at the start of the year. The Labor Department will release its CPI report on Tuesday (March 12). The price index is expected to rise 3.7% from the same period last year, which would be the smallest annual increase since April 2021. Although the annual figure is well below the peak of 6.6% reached in 2022, the recent pace of progress has been modest. This is consistent with testimony before Congress last week from Fed Chairman Jerome Powell, who said that while a rate cut may be appropriate "sometime this year," he is not ready yet. The unseasonally adjusted CPI annual rate announced today is expected to remain unchanged at 3.1%, which may be negative for gold.
Gold has risen for 9 days in a row. Yesterday was the only time it did not break through the high point and has maintained a narrow range. Therefore, gold is choosing a direction. Today we need to see whether the US CPI data will change the direction in which gold has been rising.
The support point of the daily unilateral moving average is 2170, and then the focus is on the low of 2156 during the non-agricultural data. Only if it falls below this position can we continue to see the downside.
My suggestion is to wait for the CPI to be released, follow the trend, or observe whether it will break through the resistance range of 2190-2195.
If you don’t know how to trade, join me and improve your trading success rate

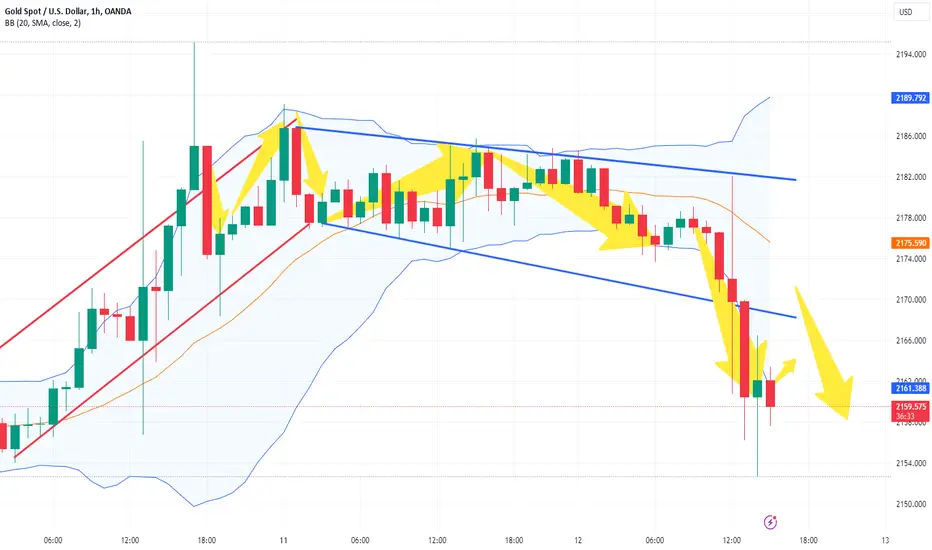
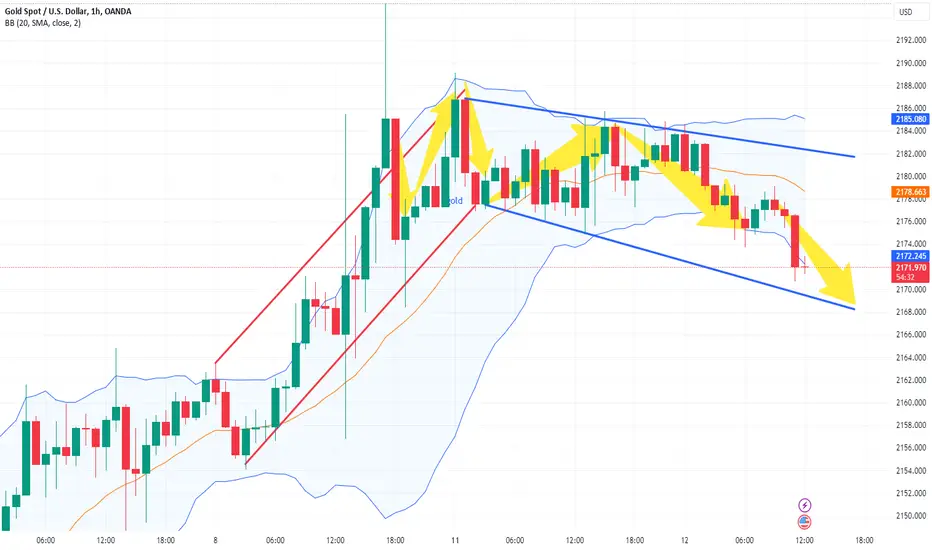
Shorting gold on rallies, circular operation
Gold briefly rose in early trading and fell back to around 2172. The rebound at 2186 last night has lost its strength. The short-term position of No. 4 and No. 5 is still under pressure (2188 and 2195). The downward support point focuses on around 2165. In the short term, you can go short around 2183.
gold:sell2183-2188
TP:2178-2175
SLl:2195
Gavin welcomes everyone here, I will prove myself, join me, and there will be more and more family members in the future

Gold trend analysis or bearish
Friends, under the influence of the negative CPI data, gold fell sharply as I expected, and once fell below the 2160 position. According to the current trend pattern, the gold pattern is developing in the short direction, while the bull pattern is no longer strong. Therefore, in this kind of market, we must pay special attention to the trading rhythm. Relatively speaking, I prefer to wait for gold to rebound to the 2170-2175 area before continuing to short gold.
I will share trading strategies and trading ideas every day. Listen to my signal and advocate seeking victory in stability and not making rash advances.
For those who want to make easy profits, follow me in the channel at the bottom of the article to get detailed trading signals. I hope that with my help, everyone can make huge profits!
GOLD- where is today support? whats next?#GOLD... market very well placed 2173 around low that was our area in our pervious idea,
keep close that area guys 2173 that will be your key level in today,
if market hold it then only that case you can expect again any kind of buying pressure from here, otherwise not..
only buying scenario expected above 2173 otherwise not at all..
good luck
trade wisely

XAUUSD (GOLD) I Let the price come down before going longWelcome back! Let me know your thoughts in the comments!
** GOLD Analysis - Listen to video!
We recommend that you keep this pair on your watchlist and enter when the entry criteria of your strategy is met.
Please support this idea with a LIKE and COMMENT if you find it useful and Click "Follow" on our profile if you'd like these trade ideas delivered straight to your email in the future.
Thanks for your continued support!

Gold analysis signals make you money easily
Hello friends!
According to the current gold trend, the gold price is now blocked at US$2182.0 and then falls. As far as the current trend is concerned, the gold price may fall at US$2160.0 as support. Pay attention to the gold price trend at any time to make the right choice.
I will share trading strategies and trading ideas every day. Listen to my signal and advocate seeking victory in stability and not making rash advances.
For those who want to make easy profits, follow me in the channel at the bottom of the article to get detailed trading signals. I hope that with my help, everyone can make huge profits!
Crude oil analysis signals make you money easily
In the European market on Tuesday (March 12), spot gold maintained its downward trend during the day, with the current price of gold at $2,172 per ounce. On this trading day, gold traders will focus on the U.S. CPI report, which is expected to trigger a big move in the gold market. Analyze and predict gold price trends.
So far, gold prices are consolidating below all-time highs. A weak U.S. CPI report could offset the overbought effects of the Relative Strength Index (RSI), triggering a new rebound in gold prices.
Gold prices need U.S. CPI data to miss expectations in order to break through the $2,200/ounce mark.
The U.S. Bureau of Labor Statistics will release its February Consumer Price Index (CPI) report.
The U.S. CPI year-on-year increase in February is expected to be 3.1%, the same as January, while the year-on-year core inflation rate is expected to fall to 3.7% from 3.9% in January. Mehta said the more important month-on-month CPI data is expected to rise 0.4%, compared with a 0.3% increase in January. The core CPI growth rate in February is expected to be 0.3% month-on-month, compared with 0.4% in the first month of this year.
Unexpected declines in February's overall CPI and core CPI month-on-month data may lead to the Federal Reserve cutting interest rates in June, triggering a new round of dollar selling and pushing gold prices to record highs. With U.S. CPI falling short of expectations, U.S. Treasury yields will face tremendous bearish pressure, triggering a new upward trend in gold prices.
On the other hand, if the inflation data released in the United States are stronger than expected and seriously affect the expectation that the Federal Reserve will turn to dovish policy as early as June, gold prices may experience a sharp correction.
Gold prices are likely to maintain cautious trading momentum ahead of the U.S. CPI release as risk sentiment remains slightly positive.
Gold latest technical analysis
The near-term technical outlook for gold prices remains broadly unchanged, as indicated by the daily chart of the 14-day Relative Strength Index (RSI), which could see a pullback amid overbought conditions.
However, the next move in gold prices still depends on US CPI data.
If the U.S. CPI data unexpectedly drops, it may push the gold price to a historical high of $2,195/ounce. Once it breaks through this level, the gold price will need to continue to break through the $2,200 mark to target the psychological mark of $2,250/ounce.
On the other hand, U.S. inflation data may prolong the correction in gold prices and drop towards the March 8 low of $2,154 per ounce.
The next support for gold prices is expected to be $2,145/ounce, which is the 23.6% Fibonacci of the March 7 low and the rebound from $1,984/ounce (February 14 low) to $2,195/ounce (historical high) The confluence point of the retracement level.
According to the current trend of gold, the price of gold continues to fall. At this stage, the price of gold reached 78.0 US dollars and was unable to break through the resistance, and then continued to fall. Only by paying attention to my signals at any time can you make the right choice.
Gold prices expected to fall
It is recommended to go short in the short term: short around $72.0
I will share trading strategies and trading ideas every day. Listen to my signal and advocate seeking victory in stability and not making rash advances.
For those who want to make easy profits, follow me in the channel at the bottom of the article to get detailed trading signals. I hope that with my help, everyone can make huge profits!
Xauusd confirm buy Gold has been considered a highly valuable commodity for millennia and the gold price is widely followed in financial markets around the world. Mostly quoted in US Dollars (XAU/USD), gold price tends to increase as stocks and bonds decline. The metal holds its value well, making it a reliable safe-haven. It’s traded constantly based on the intra-day spot rate. Improve your technical analysis of live gold prices with the real-time XAU/USD chart, and read our latest gold news, expert analysis and gold price forecast.
From a technical perspective, the Relative Strength Index (RSI) on the daily chart is flashing extremely overbought conditions and prompting some profit-taking. The near-term bias, however, still favours bullish traders in the wake of last week's break through the previous record high, around the $2,144 area. The latter should now act as a key pivotal point, which if broken decisively could drag the Gold price towards the $2,125 intermediate support en route to the $2,100 round figure.
Gold now buy 2175
Target 2185
Target 2195
Target 2210
SL 2160

Gold - Looking To Buy Pullbacks In The Short TermH4 - Bullish trend pattern.
Currently it looks like a pullback is happening.
Until the strong support zone holds I expect the price to move higher further after pullbacks in the short term.

GOLD . near to his today resistance? Hold?#GOLD.. market sharply placed 2193 n dropped on last Friday,
Now on chart we have 2181 82 as important and current resistance area,
Keep close it guys because if market hold it then drop expected from here and downside immediate supporting area will be 2173 ..
2173 will play important role in next move..
Good luck
Trade wisely

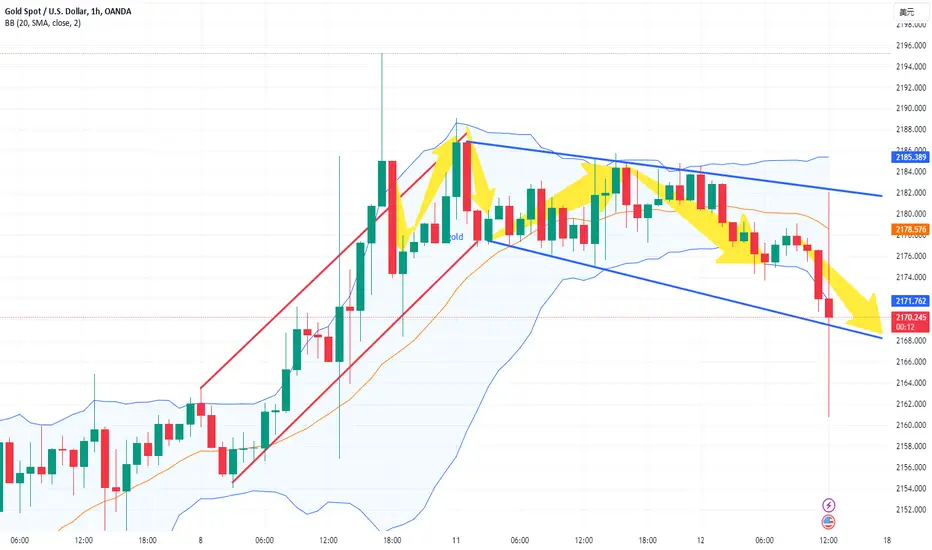
Summary on the evening of March 12th.
Many people always say that trading is either losing or making money. But 98% of people in the market always lose money. So are you one of them?
Monday's market is coming to an end. The gold market is relatively flat today. The highest price reached 2188. The lowest touched 2174. For most of the time, it remained within a narrow range of 2182-2177. Coupled with the lack of major news today, the market as a whole still maintains high vertical development.
The entire market was in an upward trend last week. I announced this trend to everyone before trading started. An attentive friend left me a message saying that my accuracy rate is the highest he has ever seen. Because there was hardly any loss last week. Indeed. Just follow the trading signals I publish. Then there is only one result. Profit.
Next, my personal idea is to continue to buy at lower prices in conjunction with the market to make a profit. There is currently no major news stimulus in the market. Therefore, the market is expected to remain mainly range-bound tomorrow. Combined with the previous leading news, almost all are positive for the rise of gold. So when there is no dominant news, technical indicators are a good standard as a reference for trading.
Combined with the above figure and relying on the market
The price of 2184-2188 sells gold.
Buy gold at a price of 2174-2177.
A look back at the highlights from last Friday.
When your awareness reaches a certain height. When you understand that trading is not gambling but investing. You are one of the 2%.

I have started to try to short gold, what about you?Dear friends, both the technical and fundamental picture of gold are bullish for gold, supported by various factors including increased demand for gold, expectations of a rate cut by the Federal Reserve and a weaker dollar. Last week, gold reached its highest level near 2195. How should the rise and fall of gold be promoted next? Although there is currently strong bullish sentiment on gold, I do not think it is appropriate to be overly bullish on gold in the short term.
For the current gold market, as long as gold remains above the 2155-2150 area, gold is still biased towards a bullish pattern, so there will not be a large decline in the short term. However, gold is gradually showing signs of peaking, and the energy of bulls is relatively weak. From a technical point of view, gold should see a correction after a strong rise. Although no decent correction has been seen so far, it is It is because of the trap caused by the market's positive bullish sentiment, so we should be more cautious. I think whether gold continues its rise or starts a correction, before that, gold will definitely test the support strength of the 2165-2160 area again, and even test the support strength of the long-short dividing line in the 2155-2150 area. Therefore, gold will definitely have a correction rhythm, which is why I insist on shorting gold at high levels in the short term!
Currently, I still maintain short gold positions at 2180 and 2184. Although the overall profit and loss is currently flat, as I said, patience is often the best quality in trading.I believe that I will definitely get satisfactory profits from short gold trading. I have now participated in the market trading rhythm of shorting gold, what about you?
I share detailed trading ideas and trading strategies every day. While we enjoy the trading process, profit is king. I hope that with my help, we can all make continuous profits in the market! And you can follow the channel at the bottom of the article to get detailed trading signals, trading lots, and TP and SL.

Gold Hello traders here is how the gold is doing in the market it broke the resistance level and now I hold and wait for a pullback to that zone then look to add another bullish trades

Gold analysis signals make you money easily
Hello friends!
According to the current gold trend, the gold price is now blocked at $2183.7. As far as the current trend is concerned, the gold price may fall at $2177.8 as support. Pay attention to the gold price trend at any time to make the right choice.
My suggestion: short at high prices. You can go short around $2182.
I will share trading strategies and trading ideas every day. Listen to my signal and advocate seeking victory in stability and not making rash advances.
For those who want to make easy profits, follow me in the channel at the bottom of the article to get detailed trading signals. I hope that with my help, everyone can make huge profits!

Gold analysis signals make you money easily
Hello my friends!
According to the current gold trend, the gold price has bottomed out and rebounded, and is blocked at US$2177.5. According to the current trend, the gold price may fall at US$2177.6 as support. Pay attention to the gold price trend at any time to make the right choice.
It is recommended to go long at low prices at this time
Go long around $2177.5
I will share trading strategies and trading ideas every day. Listen to my signal and advocate seeking victory in stability and not making rash advances.
For those who want to make easy profits, follow me in the channel at the bottom of the article to get detailed trading signals. I hope that with my help, everyone can make huge profits!

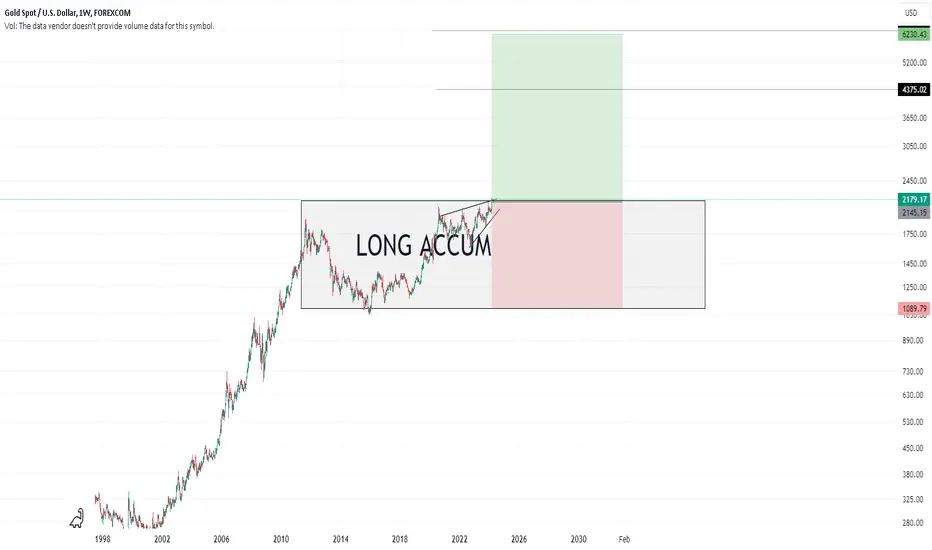
Long idea on $GOLDIf you saw my post about snp500, the best solution would be to buy gold, silver and other precious metals that have been accumulating at the top for quite some time and are trying to get out. I have already started accumulating this position