Xauusd confirm buy Gold has been considered a highly valuable commodity for millennia and the gold price is widely followed in financial markets around the world. Mostly quoted in US Dollars (XAU/USD), gold price tends to increase as stocks and bonds decline. The metal holds its value well, making it a reliable safe-haven. It’s traded constantly based on the intra-day spot rate. Improve your technical analysis of live gold prices with the real-time XAU/USD chart, and read our latest gold news, expert analysis and gold price forecast.
From a technical perspective, the Relative Strength Index (RSI) on the daily chart is flashing extremely overbought conditions and prompting some profit-taking. The near-term bias, however, still favours bullish traders in the wake of last week's break through the previous record high, around the $2,144 area. The latter should now act as a key pivotal point, which if broken decisively could drag the Gold price towards the $2,125 intermediate support en route to the $2,100 round figure.
Gold now buy 2175
Target 2185
Target 2195
Target 2210
SL 2160
Goldtrend

Gold - Looking To Buy Pullbacks In The Short TermH4 - Bullish trend pattern.
Currently it looks like a pullback is happening.
Until the strong support zone holds I expect the price to move higher further after pullbacks in the short term.

GOLD . near to his today resistance? Hold?#GOLD.. market sharply placed 2193 n dropped on last Friday,
Now on chart we have 2181 82 as important and current resistance area,
Keep close it guys because if market hold it then drop expected from here and downside immediate supporting area will be 2173 ..
2173 will play important role in next move..
Good luck
Trade wisely

Summary on the evening of March 12th.
Many people always say that trading is either losing or making money. But 98% of people in the market always lose money. So are you one of them?
Monday's market is coming to an end. The gold market is relatively flat today. The highest price reached 2188. The lowest touched 2174. For most of the time, it remained within a narrow range of 2182-2177. Coupled with the lack of major news today, the market as a whole still maintains high vertical development.
The entire market was in an upward trend last week. I announced this trend to everyone before trading started. An attentive friend left me a message saying that my accuracy rate is the highest he has ever seen. Because there was hardly any loss last week. Indeed. Just follow the trading signals I publish. Then there is only one result. Profit.
Next, my personal idea is to continue to buy at lower prices in conjunction with the market to make a profit. There is currently no major news stimulus in the market. Therefore, the market is expected to remain mainly range-bound tomorrow. Combined with the previous leading news, almost all are positive for the rise of gold. So when there is no dominant news, technical indicators are a good standard as a reference for trading.
Combined with the above figure and relying on the market
The price of 2184-2188 sells gold.
Buy gold at a price of 2174-2177.
A look back at the highlights from last Friday.
When your awareness reaches a certain height. When you understand that trading is not gambling but investing. You are one of the 2%.

I have started to try to short gold, what about you?Dear friends, both the technical and fundamental picture of gold are bullish for gold, supported by various factors including increased demand for gold, expectations of a rate cut by the Federal Reserve and a weaker dollar. Last week, gold reached its highest level near 2195. How should the rise and fall of gold be promoted next? Although there is currently strong bullish sentiment on gold, I do not think it is appropriate to be overly bullish on gold in the short term.
For the current gold market, as long as gold remains above the 2155-2150 area, gold is still biased towards a bullish pattern, so there will not be a large decline in the short term. However, gold is gradually showing signs of peaking, and the energy of bulls is relatively weak. From a technical point of view, gold should see a correction after a strong rise. Although no decent correction has been seen so far, it is It is because of the trap caused by the market's positive bullish sentiment, so we should be more cautious. I think whether gold continues its rise or starts a correction, before that, gold will definitely test the support strength of the 2165-2160 area again, and even test the support strength of the long-short dividing line in the 2155-2150 area. Therefore, gold will definitely have a correction rhythm, which is why I insist on shorting gold at high levels in the short term!
Currently, I still maintain short gold positions at 2180 and 2184. Although the overall profit and loss is currently flat, as I said, patience is often the best quality in trading.I believe that I will definitely get satisfactory profits from short gold trading. I have now participated in the market trading rhythm of shorting gold, what about you?
I share detailed trading ideas and trading strategies every day. While we enjoy the trading process, profit is king. I hope that with my help, we can all make continuous profits in the market! And you can follow the channel at the bottom of the article to get detailed trading signals, trading lots, and TP and SL.

Gold Hello traders here is how the gold is doing in the market it broke the resistance level and now I hold and wait for a pullback to that zone then look to add another bullish trades

Gold analysis signals make you money easily
Hello friends!
According to the current gold trend, the gold price is now blocked at $2183.7. As far as the current trend is concerned, the gold price may fall at $2177.8 as support. Pay attention to the gold price trend at any time to make the right choice.
My suggestion: short at high prices. You can go short around $2182.
I will share trading strategies and trading ideas every day. Listen to my signal and advocate seeking victory in stability and not making rash advances.
For those who want to make easy profits, follow me in the channel at the bottom of the article to get detailed trading signals. I hope that with my help, everyone can make huge profits!

Gold analysis signals make you money easily
Hello my friends!
According to the current gold trend, the gold price has bottomed out and rebounded, and is blocked at US$2177.5. According to the current trend, the gold price may fall at US$2177.6 as support. Pay attention to the gold price trend at any time to make the right choice.
It is recommended to go long at low prices at this time
Go long around $2177.5
I will share trading strategies and trading ideas every day. Listen to my signal and advocate seeking victory in stability and not making rash advances.
For those who want to make easy profits, follow me in the channel at the bottom of the article to get detailed trading signals. I hope that with my help, everyone can make huge profits!

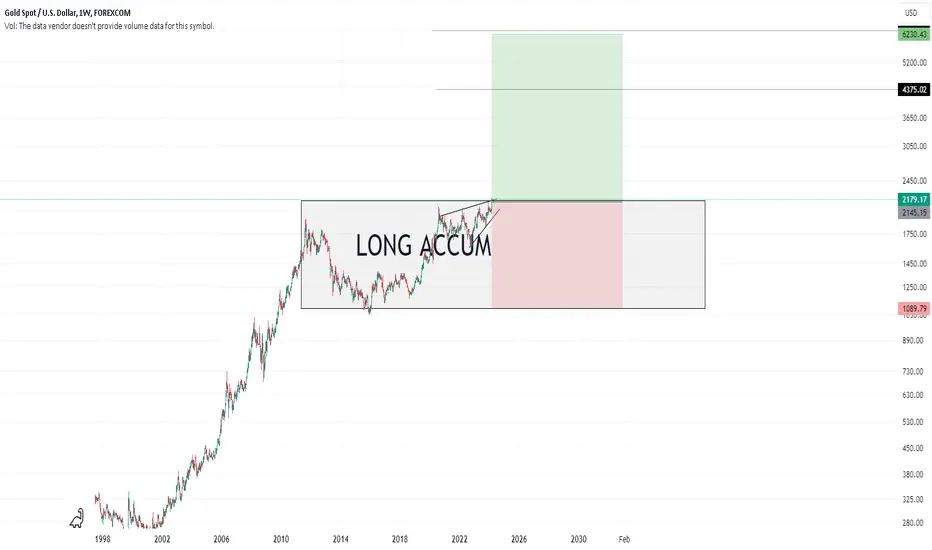
Long idea on $GOLDIf you saw my post about snp500, the best solution would be to buy gold, silver and other precious metals that have been accumulating at the top for quite some time and are trying to get out. I have already started accumulating this position
GOLD-Advice and Strategies
Focus on data this week
On Monday, the New York Fed’s 1-year inflation forecast for February
On Tuesday, the U.S. February NFIB small business confidence index, CPI data, and OPEC released its monthly crude oil market report
On Wednesday, U.S. EIA crude oil inventories for the week, IEA released monthly crude oil market report
Thursday, US February retail sales monthly rate, US February PPI data
On Friday, the U.S. New York Fed manufacturing index in March, import price index monthly rate, industrial output monthly rate, one-year inflation rate expectations
U.S. job growth accelerated in February, but the unemployment rate rose and wage growth slowed. Non-agricultural employment increased by 275,000 in February, and the unemployment rate rose to 3.9% in February after remaining at 3.7% for three consecutive months. This is generally negative for the US dollar and bullish for gold, causing the US dollar to continue to fall, and gold to rise again to a new high. point. Gold's surge is due to three factors: geopolitical conflicts, the Federal Reserve's interest rate decision, and the increase in gold holdings by central banks.
From the technical indicators of gold, we can see that the RSI is overbought from the weekly level to the hourly level, and the rising momentum of 1H and 4H MACD is attenuated.
It can currently be seen that the important support range for gold is strongly supported at 2155-2165.
I suggest that you can sell in the resistance range, or buy in the support range, reasonably control the position according to your own funds, and set SL. There is no important data released today, or you can wait for the trend to be obvious before trading with the trend.
Join me, I will share my strategies every day for your reference to increase your trading success rate

Sideway waits for economic data this week ! XAU⭐️ Smart investment, Strong finance
⭐️ GOLDEN INFORMATION:
Gold price (XAU/USD) is consolidating its recent rally to the $2,200 neighborhood, reaching a fresh record high on Friday. The spike in the US unemployment rate has increased expectations for interest rate cuts by the Federal Reserve (Fed). As a result, US Treasury bond yields remain low, hindering the US Dollar's recovery and providing support for gold.
⭐️ Personal comments NOVA:
Gold price continues its upward trend to create a new peak, Monday trading session shows signs of sideway accumulation waiting for important data during the week, expecting corrections DOWN
⭐️ SET UP GOLD PRICE:
🔥BUY GOLD zone: $2157 - $2155 SL $2150
TP1: $2162
TP2: $2170
TP3: $2180
Maybe scalping BUY zone $2162 - $2164
🔥SELL GOLD zone: $2198 - $2200 SL $2205
TP1: $2190
TP2: $2180
TP3: $2170
⭐️ Technical analysis:
Based on technical indicators EMA 34, EMA89 and support resistance areas to set up a reasonable SELL order.
⭐️ NOTE:
Note: Nova wishes traders to manage their capital well
- take the number of lots that match your capital
- Takeprofit equal to 4-6% of capital account
- Stoplose equal to 2-3% of capital account
- The winner is the one who sticks with the market the longest

Gold trend analysis, easily make money for you
Hello my friends!
According to the current trend of gold, the price of gold has now risen to US$2,185. According to the current trend, the price of gold may rise and be blocked. Pay attention to the trend of gold prices at any time to make the right choice.
I will share trading strategies and trading ideas every day. Listen to my signal and advocate seeking victory in stability and not making rash advances.
For those who want to make easy profits, follow me in the channel at the bottom of the article to get detailed trading signals. I hope that with my help, everyone can make huge profits!

Gold signal sharing for next Monday
Gold has completed an astonishing continuous rise to new highs. Next week there will be CPI data, which may be a factor that promotes gold's continued rise.
Next Monday, I don’t think gold will have major fluctuations. It will be mainly bullish and fall in the short term at 2185 and 2195. So I think Gold Monday is a shock trend
It is recommended that you buy after the gold price corrects slightly at the opening. Try buying from 2165-2175, sell gold when it rises to the two suppression points of 2185 and 2195, and make a profit of 50-80pips.
I will update my trading signals according to the trend of gold. Please join me and continue to receive my updates.

Xauusd confirm buy signal Gold News: Read the Latest Analysis on XAU/USD
Gold has been considered a highly valuable commodity for millennia and the gold price is widely followed in financial markets around the world. Mostly quoted in US Dollars (XAU/USD), gold price tends to increase as stocks and bonds decline. The metal holds its value well, making it a reliable safe-haven. It’s traded constantly based on the intra-day spot rate. Improve your technical analysis of live gold prices with the real-time XAU/USD chart, and read our latest gold news, expert analysis and gold price forecast.
Gold now buy 2178
Tp1 2184
TP2 2190
Tp1 2200
SL 2162

Gold is still strong at the moment, ready to buy againLast Friday, our buy signal at 2160 was a big success. Although it did not reach the target of 2200, it reached a maximum of 2195. The profit margin is very large. Today we are going to prepare to buy again.
The price of gold opened higher on Monday in the short-term. The short-term increase indicates the willingness to rise. Currently, the price of gold is still at a historical high and has yet to form a substantial retracement. From the market point of view, the price of gold is still in a unilateral upward trend. If it retreats to You can continue to buy near the 2170 line!
Technical analysis shows that the price of gold has risen unilaterally, the lows have continued to rise, and the highs have continued to set new historical highs. The golden cross of the moving average below continues to maintain, and the support is at the 2169 line. The current gold price is only one step away from the 2200 mark. , you can reach it within a few days with a little more effort! And we are also mentally prepared for gold prices to break through the 2200 mark!
Good luck to everyone

Gold trend analysis, easily make money for you
Hello friends!
Entering the European market on Monday (March 11), spot gold consolidated at a high level after several consecutive days of sharp gains. It is currently waiting for the next trend near the record high. The market remains cautious before the key US CPI inflation report, etc. New clues for Fed rate cut.
After rising for eight consecutive days, spot gold broke through record highs one after another. It once touched near 2195 last Friday and is currently consolidating at a high of around $2180.
Gold prices hit a record high of $2,194.99 for a fourth straight day on Friday after data showed a cooling in the U.S. job market.
According to the current gold trend, the gold price is currently fluctuating at $2,180. Short selling is still not a wise approach at this stage. As far as the current trend is concerned, the gold price may correct. Pay attention to the gold price trend at any time to make the right choice.
I will share trading strategies and trading ideas every day. Listen to my signal and advocate seeking victory in stability and not making rash advances.
For those who want to make easy profits, follow me in the channel at the bottom of the article to get detailed trading signals. I hope that with my help, everyone can make huge profits!

Gold may experience a correction in the short termDear friends, gold is currently consolidating near the 2078 position, and the highest price of gold last week has reached around the 2095 position. Can gold continue to rise and break through the 2095 position? Can we still go long gold in short-term trading?
Judging from the gold trend, we can find that a long-short dividing point for gold in the short term is in the 2155-2150 area. So judging from the current graphics, I think it is still too early to say that gold is going to start a major correction. At the very least, we have to wait until the 2155-2150 area is broken downwards, then gold may start a correction trend downwards. As for whether the 2195 position is the current highest point, I think it is not sure yet, but judging from the current trend, there is a peaking signal. Judging from the current trend, gold may retreat to around 2160 in the short term.
Therefore, in short-term trading, I will not continue to chase gold above 2180. Based on the current profit-loss ratio, I think it is obviously more appropriate to short gold above. So in terms of trading, I will focus on shorting gold in the short term.
I share detailed trading ideas and trading strategies every day. While we enjoy the trading process, profit is king. Learn from traders who maintain a 95% winning rate, and you will be able to guarantee at least an 80% winning rate. I hope that with my help, we can all make continuous profits in the market! And you can follow the channel at the bottom of the article to get detailed trading signals, trading lots, and TP and SL.

Decoding Gold: Uncovering Weekly Key Supply & Demand Zones!Hello Traders,
Critical Zone Breakout from Supply Zone Indicates Potential Upside Momentum, While Failure to Respect Signals Downside Pressure Ahead.
We have A Supply Zone. If The Price Breaks The Supply Zone, Take Entry While Retesting OR Pullback of The Move Otherwise If It Respects The Supply Area Then Look For The Short Entries!
Please Note That The Only Purpose of The Information On This Page is Purely Educational.
I Would Welcome Your Participation And Support in the Form of Likes, Comments, And Follow us to Offer Some Encouragement.
Thank You.

Gold trend analysis, easily make money for you
Gold trend analysis, easily make money for you
In early trading in the Asian market on Monday (March 11), spot gold fell back after rising to a high of $2,188.88 per ounce, approaching the all-time high of $2,195.07 set last week. It is now back around $2,180.
Gold prices surged to a record high on Friday following U.S. non-farm payrolls data. On the 60-minute chart, gold prices continue to trade within an ascending channel. Gold prices surged to a record high after data showed a rise in U.S. unemployment, boosting expectations that the Federal Reserve may soon begin cutting interest rates.
Data released by the U.S. Bureau of Labor Statistics on Friday showed that the U.S. non-farm payrolls increased by 275,000 in February, higher than the expected 200,000. However, the number of new non-farm payrolls in December last year was revised down from 333,000 to 290,000. people.
The U.S. non-farm unemployment rate unexpectedly rose to 3.9% in February, a new high since January 2022, higher than market expectations of 3.7%, and the value before January was 3.7%.
The average hourly wage in the United States increased by 4.3% year-on-year in February, in line with expectations of 4.3%. The wage growth rate in January was revised down from 4.5% to 4.4%; the average hourly wage growth in February fell to 0.1% month-on-month, which was lower than expected. 0.2%, the previous value was revised down from 0.6% to 0.5%.
Spot gold closed up $19.38, or 0.9%, at $2,178.95 per ounce on Friday, with gold prices hitting an intraday high of $2,195.07 per ounce.
As I said before, the probability of gold rising is very high. In addition, combined with the impact of U.S. dollar interest rate cuts and rising unemployment rates, the negative gold news from the non-agricultural data was revised, and the U.S. dollar showed a weak downward trend. Therefore, the current gold price will continue to rise strongly;
Therefore, the short-term recommendation for gold is to go long on dips. It is still not recommended to go short and wait for the opportunity to go long at low levels.
Recommendation: Go long around $2178
TP 2190
SL 2168
Listen to my signal and advocate seeking victory in stability and not making rash advances.
If you want to make easy profits, please follow me
Comments welcome!

Gold trend analysis, easily make money for you
March 9 News: Market expectations for the Federal Reserve's policy easing may be coming to an end. Expectations for the Federal Reserve's monetary policy to shift to easing are still dominant. The geopolitical situation is still tense. Global central banks continue to purchase gold. Adding to the possibility of the spread of the U.S. banking crisis, the impact on gold Form a mid- to long-term positive impact.
Gold recommendation: Going long at low levels is still the core. It is still not recommended to go short and wait for the opportunity to go long at low levels.
Recommendation: Go long around $2177
TP 2195
SL 2168
Listen to my signal and advocate seeking victory in stability and not making rash advances.
Comments welcome!
have a nice weekend!

GOLD-Advice and Strategies
The U.S. initial jobless claims data performed poorly. The number of jobless claims was slightly higher than expected and the previous value, once again casting a shadow on the recent weak U.S. economy. The U.S. dollar index has weakened and set a recent low. Federal Reserve Chairman Powell has been The views of the testimony were also moderate, which also led to the market beginning to place more bets on interest rate cuts. Today, we will focus on the actual performance of the non-agricultural data in the evening.
Gold has risen for 7 consecutive days. This trend is also rare in history. Judging from the current indicators, overbought signals have been formed at the 1-hour and 4-hour levels. The upward momentum has diminished, and there may be another high point. But the risk of buying now is already high
First focus on the strong support point 2140, and then look at the trend support point 2122. In other words, if gold remains above 2140, it is an absolutely strong upward trend, and if it remains above 2122, it is also an upward trend.
Today’s non-agricultural data should also pay attention to the support of these two points. If it falls below 2122, there may be a lot of room for adjustment.
However, the current rising market environment has not changed, so medium and long-term sell orders cannot be traded. According to the data released today, unemployment benefits remain unchanged at the previous 3.7%. After seasonally adjusted non-agricultural employment, the previous value was 35.30,000. The market forecast is 200,000. It is expected to be negative for the US dollar and bullish for gold. The specifics will depend on the actual released data.
My advice is to wait for the data to be released and trade with the trend, or wait for a clear sell signal before placing a sell order.

Can gold break through 2200 after the NFP data is released?Gold is fluctuating at a high level. At present, the price of gold is still firmly supported above the moving average. If it does not fall for a long time, it will definitely rise! The current price is 2160 and more orders can be entered directly, and we will continue to be optimistic about breaking the historical high during the day!
Looking at the market, the current upper resistance level first refers to the high point of 2164, but the short-term pressure level above is quite small. I think the gold price will definitely break through this level again within the day, while the lower support faces the moving average support of 2156 and the previous inflection point support level of 2148. The price of gold will continue to maintain this volatile upward pattern before major changes occur. If you step back on the support level, be bold and go long!

xauusd(gold) daily outlookxauusd(gold) trading at an all-time high. so with the Dow Theory when a market makes an all-time high it will back to the most recent broken price. of course, you should wait for a reversal point.
note- keep in mind market takes less time to build a pattern when it’s about the bull market to move down. and when the market is bearish then it’s taking much time to build a reversal pattern to move upside.
