GOLD - Short trade opportunity ✅Hello traders!
‼️ This is my perspective on GOLD.
Technical analysis: Here we are in a bearish market structure from 4H timeframe perspective, so I am looking for short. I expect bearish price action from here as price rejected from trendline + resistance zone.
Like, comment and subscribe to be in touch with my content!
Goldtrend

Gold trading signals and analysis for next Monday
Gold rose to the 2037-2041 area on Friday as I judged. My analysis successfully helped traders who saw the analysis win gold trades on Friday
Gold fell to near 2016 on Friday, then began to rebound, and finally rose to 2041, closing at 2035 in the evening. The whole trend fits my judgment perfectly.
Next Monday I think gold will test the 2028-2032 area and then continue to rise. Test the 2048 high again. If it breaks, the possible trend is 2055/2063. I would first recommend everyone to buy. Trading straregy:
BUY:2028-2032 tp2038-2042-2047 sl 2022
SELL:2044-2048 tp2036-2032-2028 sl 2051.5
If you follow my analysis for a long time, you will find that my analysis has always been very accurate. If you like my analysis, please join. I will update my thoughts in real time.

Gold Update Next Week ❤️Hello traders ,what do you think about GOLD? The price of gold is fluctuating between this range. From a technical point of view, there's an anticipation of a potential decline to the designated level of 2030, followed by a subsequent range of 2020-2010. feel free to express your support through likes and comments. ❤️


Gold Price After BREAKING $2030 Gold Price Analysis for the Week of 26/2 - 1/3/2024
• Gold price is expected to end the week positively due to decreasing US Treasury bond yields and lack of significant news.
• The XAU/USD is currently trading at $2,038, showing a 0.70% increase.
• Gold prices unexpectedly increased last week, breaking through the $2030 range and continuing to trade above it.
• Based on technical analysis, NOVA identifies key resistance at $2050 and support at $2030, $2016, and $2000.

Has the recent rise of global gold reached its peak?📌By examining the trend in the four-hour time frame, gold is approaching the resistance of the ceiling of the descending channel in the range of 2047 dollars, and it seems that the price may decrease to the support of the floor of the descending channel in the range of 1973, provided that the resistance of 2047 is maintained. There are dollars.
In another scenario, gold can rise to the previous ceiling resistance in the range of $2089 by crossing the $2047 resistance.🎯❌

GOLD H1 / Short Trade Opportunity / Target Price 1975 ✅💲Hello Traders!
This is my idea related to GOLD H1. I see that we are in a bearish channel and at the moment, I would like to see a retracement from the resistance level. I will look for a short entry if I will see a confirmation of a bearish market structure. I expect that we will reach the PWL and my target is 1975.
Traders, if my proposal resonates with you or if you hold a divergent viewpoint regarding this trade, feel free to share your thoughts in the comments. I welcome the opportunity to hear your perspectives.
____________________________________
Follow, like, and comment to see my content:
www.tradingview.com

Gold Analysis for upcoming weekAs you can see traders Gold has been in a bullish trend in the past weeks and months, you can see now that it has created a pattern that is called the ascending triangle which signals a Bullish market so now we have to wait for the price to break above the triangle zone then I can look for bullish trades.

XAUUSD - possible BuyNow everything is Going well for Gold. No matter there is uncertainty or War or interest rate decisions, Gold is likely to touch higher targets. as I mentioned on my BTC analysis, Today's Core PCE can be the Final Fuel for market to start their final rally in 2023.

( What is your target gold price in FOMC)Hello traders what do you think about Gold)
Technical analysis forecast ✅📈📉📊
Gold price $$$) big bullish candle 1D chart 📉📈 buyers will back market pullback resistance level 2034 2037)
Last level of breakdown pullback short bearish moment US dollar 💵 Short 104.00 support level up trand gold pullback short 2010)📉📈⤵
(What moment bearish level)
📉📈📊⤵⤵
Gold price pullback reset taste resistance level 2034 + 2038 this channel downtrend test
pullback short 2010)📉📈📊⤵
Safe trade 👍🙏 pales like and comment's don't forget next analysis follow me 🙏❤

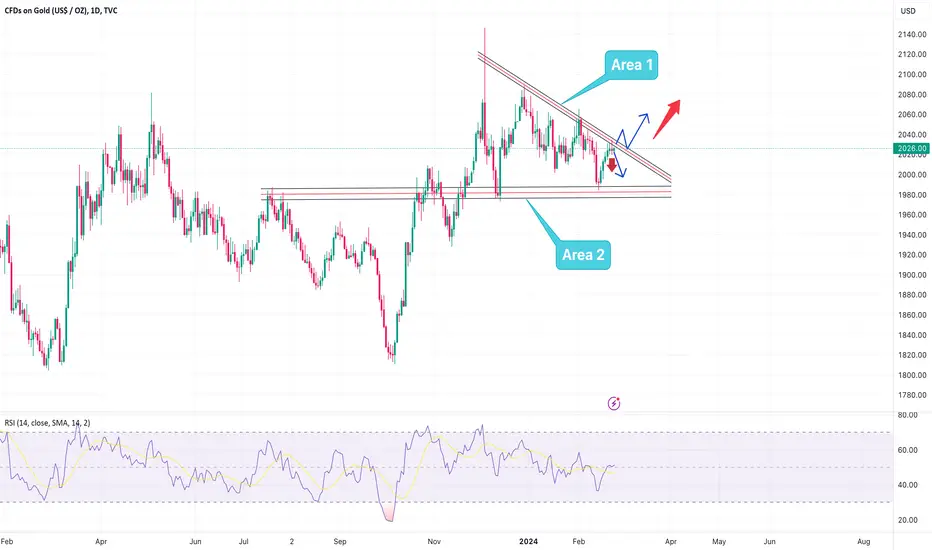
Gold Scalping Analysis scenario 1 : If the price break the area 1 its great opportunity to take long position after retest the area 1 .
scenario 2 : if the price fail to cross the area 1 up that mean we have great opportunity to short position up to area 1
Please follow me to get my analysis notifications
Cheers🥂
🏆 XAUUSD 🏆 ✅Two week high❤️MY FOREX TEAM❤️
INFORMATION
Gold price hangs near multi-day low, downside remains limited amid modest USD weakness.
💲BUY GOLD 2009-2013 💲
SL @ 2003
TP 1 @ 2016
TP 2 @ 2025
TP 3 @ 2030
TP 3 @ 2038
💲SELL GOLD 2035-2040 💲
SL @ 2045
TP 1 @ 2034
TP 2 @ 2025
TP 3 @ 2020
Everyone success..👍👍👍
❤️MY FOREX TEAM - Technical Analysis
Technical indicators SMA | EMA | MACD | SAR | VWAP | RSI | MARKET TREND | NEWS
❤️NOTE
Gold price retreats further from a nearly two-week high amid the Fed's hawkish outlook.
The risk-on mood also undermines the XAU/USD, though geopolitical risks limit losses.
A subdued USD price action also warrants caution before placing aggressive bearish bets.
❤️MONEY CAPITAL MANAGEMENT
⚡️ Only Trade With Risk Capital
⚡️ Cut Losses Short, Let Profits Run On
⚡️ Avoid Using Too Much Leverage
⚡️ Avoid Taking Too Much Heat
⚡️ Do Not Give in to Greed
⚡️ Take profit equal to 4-6% of your capital
⚡️ Stop lose equal to 2-3% of your capital

Sideway, weekend accumulation for Gold⭐️ Smart investment, Strong finance
⭐️ GOLDEN INFORMATION:
Meanwhile, yields on US Treasury bonds are increasing on the shorter end of the yield curve, indicating that investors are still doubtful about the possibility of the Federal Reserve reducing interest rates during either the March or May meetings. The most recent minutes from the Federal Open Market Committee (FOMC) emphasized that the US central bank is strongly committed to addressing inflation, despite the fact that there are more potential risks to the economy. Policymakers stressed that they would make decisions regarding monetary policy based on data analysis.
The FOMC Minutes revealed that Fed officials are still cautious about cutting rates prematurely. They stated that it would not be appropriate to lower interest rates until they have "greater confidence" that core inflation will consistently reach 2%. While policymakers acknowledged that the risks associated with achieving their mandates are becoming more balanced, they remain highly focused on inflationary risks, despite the downward economic risks.
⭐️ Personal comments NOVA:
At the end of the week, Gold price supports a sideways trend and accumulates for the next week
⭐️ SET UP GOLD PRICE:
🔥BUY GOLD zone: $2012 - $2010 SL $2005
TP1: $2016
TP2: $2024
TP3: $2030
Pay attention to the sideway resistance and support areas: $2030 and $2020
🔥SELL GOLD zone: $2038 - $2040 SL $2045
TP1: $2034
TP2: $2028
TP3: $2020
⭐️ Technical analysis:
Based on technical indicators EMA 34, EMA89 and support resistance areas to set up a reasonable SELL order.
⭐️ NOTE:
Note: Nova wishes traders to manage their capital well
- take the number of lots that match your capital
- Takeprofit equal to 4-6% of capital account
- Stoplose equal to 2-3% of capital account
- The winner is the one who sticks with the market the longest

GOLD-where is today support?? #GOLD... well guys market very well hold 2021.80 2 o 3 times, and in morning market break it placed your immediate support 2017 18 around,
that was your immediate support below 2021.80 as we discussed in our last couple of ideas and also in video,
so guys now market have downside next major important supporting area that is 2015 around.
keep close it guys because next ride will star from 2015
it will be your key level in today,
good luck
trade wisely

XAUUSD:23/2 Today’s Analysis and StrategyGold technical analysis
Daily resistance 2037-40, lower support 2000-1966
Four-hour resistance 2033-37, lower support 2020
Gold operation suggestions:
From a four-hour perspective, we will first focus on the short-term support of 2010 today. If 2010 falls below, it may test 2000, and then continue to focus on the suppression of 2025 above. The daily level is 2037-2040. If the daily long-short boundary does not break through 2037, we will continue to be bearish. , continue to rely on this range to sell high and buy low during the day.
SELL:near 2025
SELL:near 2010
BUY:near 2000

XAUUSD GOLD - At this juncton, Gold...Stay vigilant for shifts in market sentiment and be ready to respond promptly. Keep an eye on the local reference point at 2027, which serves as a sell limit order level currently. This level will help assess the presence and strength of any new buyers entering the market.
