The Myth of Gold Reversals – Why Traders Keep Catching the KnifeGold is a master of deception.
It shows a clean wick into a zone, but reacts just enough to pull in early buyers or sellers — then rips straight through their stops like they weren’t even there.
The reversal looked real and the candles seemed perfect.
But the move? It was never meant for them.
This isn’t bad luck, but traders who survive aren’t trying to guess, they are the ones reading the reaction after the trap.
Let’s break down how these traps happen — and how Smart Money actually operates when XAUUSD is loading a real move.
🟥 Sell Trap – The "Instant Short" Mistake
Price pushes up into a clear reaction zone — maybe an OB, maybe an imbalance, a FVG, or a gap.
Structure looks stretched. Traders recognize a premium zone and decide it’s time to short.
The trap? Jumping in immediately on the touch, with no confirmation.
This is where Gold loves to trap sellers.
No M15 CHoCH/ BOS on M5 or real liquidity swept. Just a blind move and hope.
Price often pulls slightly higher — sweeping internal liquidity, triggering SLs — then shows a real rejection.
📌 Here’s what needs to happen before selling:
• First: look for a liquidity sweep (equal highs or engineered inducement)
• Then: price must shift — CHoCH or BOS on M15 or M5
• Finally: confirmation via bearish engulf, imbalance fill, or break + retest
• For experts: M1 can offer refined sniper triggers with minimal drawdown
💡 If none of this appears, it’s not a setup — it’s a trap.
🟩 Buy Trap – The "Wick Bounce" Illusion
Price taps a demand zone — again, a refined OB or imbalance, liquidity zone.
A long bullish wick forms. Some candles pause. It looks like a reversal.
But there’s no shift.Just hovering.
Many jump in long the second they see the wick. And then price breaks straight through.
📌 Here’s how to flip this trap into a real buy:
• Let price sweep liquidity below the zone — signs of a purge - true wick bounce
• Watch for a CHoCH or BOS on M15, M5, or even M1
• Look for a strong bullish engulf from the reactive level
• Confirm via imbalance fill or price reclaiming broken structure
📍 If all that happens — the trap becomes your entry.
If not? Stand down.
📊 What Smart Traders Actually Do Differently
They don’t chase wicks.
And never enter just because price tapped a line.
IT IS ALL ABOUT READING STRUCTURE AND PRICE ACTION.
Here’s how:
• Mark the highest probability reaction zones — above and below current price;
• Set alerts, not blind entries;
• Wait for price to come into their zone and then watch what it does there;
• Look for confirmation: CHoCHs, BOS, engulfing candles, FVG fills, clean rejections;
• And always keep one eye on the news — because Gold reacts fast and violently when volatility hits.
• Repeat this work daily until they learn how to recognize signs faster and more secure.
That’s the difference between chasing the reversal… and trading the move after the trap.
Because in this game, patience isn’t just a virtue — it’s survival.
And Gold? Well, XAUUSD has no mercy for those in a hurry and not studying its moves day by day, month after month and so on. Learn structure and price action even if you join any channel for help if you are serious about trading this amazing metal.
If this lesson helped you today and brought you more clarity:
Drop a 🚀 and follow us✅ for more trading ideas and trading psychology.
Goldtrendanalysis
350pips Secured — Focus Shifts to Dip-Buying StrategyToday's trading was very successful, and the grasp of the long and short rhythm was very accurate. Today's trading situation is as follows:
1. Close the short position with an overnight entry price of around 3386 near 3380, with a loss of 60 pips, and the loss amount exceeded $6K;
2. Directly short gold near 3380, manually close the position near 3366, profit 130pips, profit amount exceeded $12K;
3. Long gold near 3356, hit TP: 3372 and end the transaction, profit 160pips, profit amount exceeded $8K;
4. Long gold near 3362, hit TP; 3375 and end the transaction, profit 120pips, profit amount exceeded $6K.
Intraday trading summary: Today, the long and short sides completed a total of 4 transactions, one of which suffered a loss, but the net profit was 350pips, and the profit amount exceeded $20K. For short-term trading, I think I can submit a satisfactory answer to myself today!
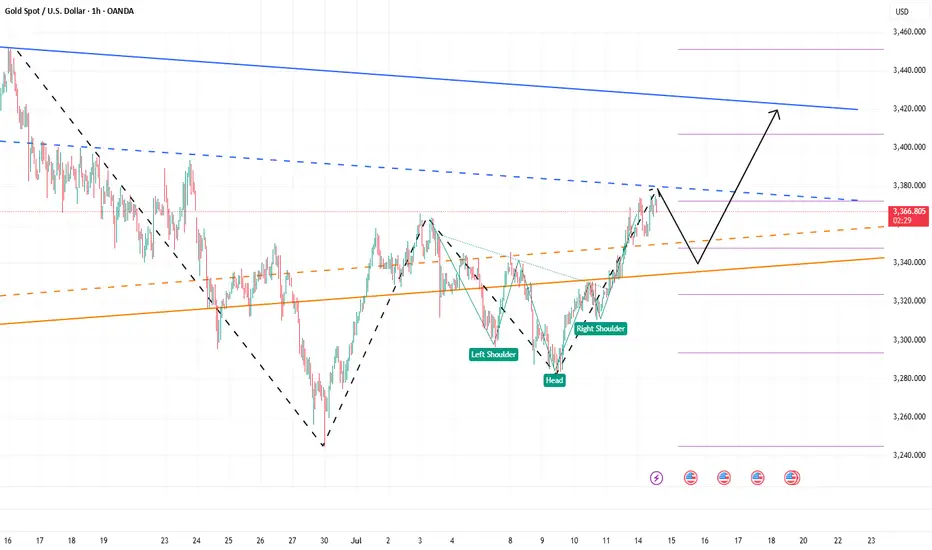
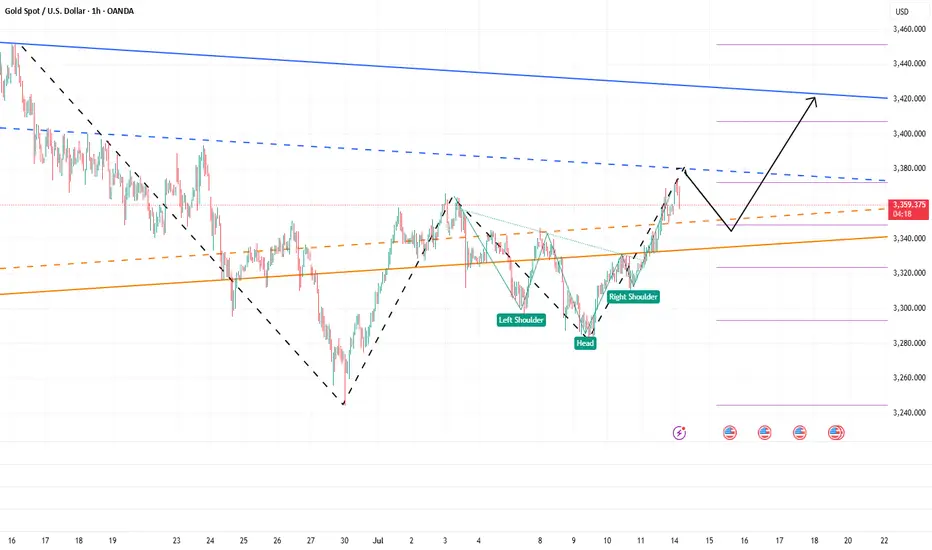
How to execute the transaction next? Gold started to pull back from around 3438 and has now reached a low of around 3351, with a retracement of more than 870pips. The retracement space is not small. However, gold has stabilized above 3350 and has started a technical rebound repair, and the upward force is not weak, so gold may have completed the retracement. Under the support of these two technical conditions, gold may regain its upward momentum and hit 3400 again.
At present, the short-term resistance is obvious, located in the area near 3380. Once gold breaks through 3380, gold will inevitably continue to rise and hit 3400 again; but I think as long as gold stabilizes above 3350, it is not difficult to break through the short-term resistance of 3380, so gold will inevitably test the 3400 mark again; and the short-term support below is in the 3365-3355 area. Gold may still retreat to this area first during the rise in order to increase liquidity and accumulate momentum, helping gold to break through 3380 more easily.
So for the next short-term trading, I think it is feasible to go long on gold in the 3365-3355 area, first looking at the target area of 3380-3390, and then 3400.

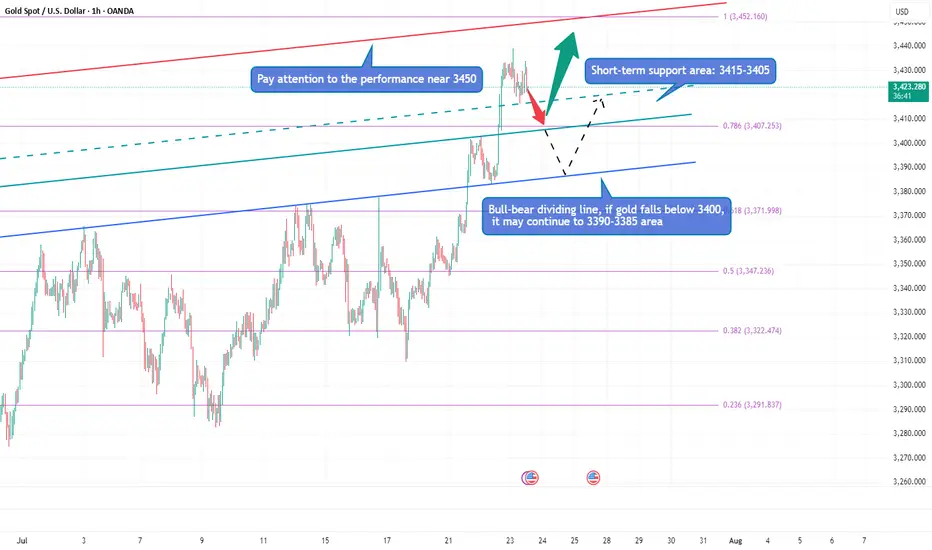
Gold is surging, can it hit 3500?Due to the trade tensions caused by tariffs and the continued conflict between the White House and the Federal Reserve, gold continued to rise, and the current highest has reached around 3438. Obviously, after gold rose strongly and broke through the 3400 and 3420 areas, the bullish sentiment of gold has been ignited. Next, we need to pay attention to whether gold can test and stand firm at 3450.
Gold is currently extremely strong, and there is basically no room for retracement during the rise. As gold rises, the short-term support below has also moved up to the 3415-3405 area; and the upper side needs to pay attention to the breakthrough of the 3450 mark. If gold continues to break through 3450, then gold has the potential to challenge 3500 again; however, if gold still cannot effectively break through when it touches the area near 3500 again, the sentiment of gold cashing out and leaving the market may be stimulated, resulting in gold There may be room for retracement in the short term. If gold falls below 3400 during the retracement, the decline may continue to the 3395-3385 area.
Therefore, for the next short-term trading, we can first wait for the opportunity for gold to pull back, and then consider going long on gold with the 3415-3405 area as support; if gold does not give a chance to pull back, then when gold first touches the area around 3440-3450, we can consider starting to short gold.
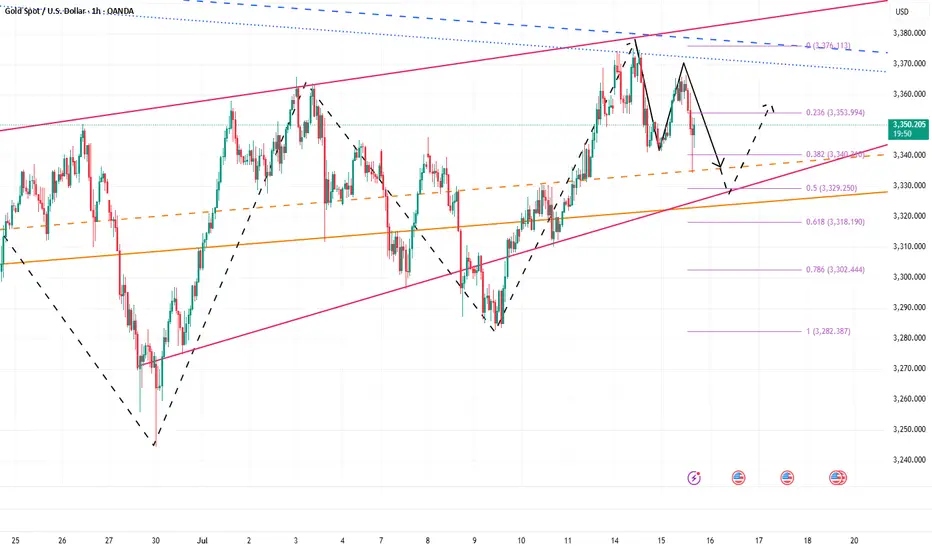
Don’t hesitate, a massive gold move Is brewingRefer to my previous trading idea. Gold retreated as expected. We almost caught the highest point of the day and shorted gold near 3365, and successfully hit TP: 3346, which enabled us to successfully profit 190pips in short-term trading, with a profit of nearly $10K, which is a good result in short-term trading.
Currently, the lowest point of gold in the retracement process has reached around 3335, which has fully released the short energy and vented the bearish sentiment in the market. All the bad news is out, which means good news! Although gold fell from 3375 to 3335, the retracement was as high as $40, but the rising structure has not been completely destroyed. The previous W-shaped double bottom support structure and the resonance effect of the inverted head and shoulder support structure still exist. As long as gold stays above 3325, gold bulls still have the potential to attack.
Moreover, after this round of retracement, the bearish sentiment of gold was vented, and the liquidity was greatly increased, attracting more buyers to actively enter the market. Gold may start a retaliatory rebound, and even touch 3375 again or even break through and continue to the 3380-3390 area.
So for short-term trading, I think we can try to go long on gold in the 3335-3325 area appropriately, first looking forward to gold regaining lost ground: 3350-3360 area, followed by 3380-3390 area.
Gold still has room to pull back, be brave and short gold!Gold continued to rebound today, and we also successfully gained 150pips profit in long gold trading. However, although gold is currently maintaining its upward trend, the rebound strength of gold is not strong during the European session, and it has repeatedly touched 3375 and then fell back, proving that there is still some resistance above. In my previous trading point of view, I also emphasized that gold is under pressure near 3380 in the short term. In addition, from a technical perspective, today's intraday high is limited to 3395.
So in order to dump the bullish momentum so that it can break through 3380 more smoothly, or even continue to above 3340, gold will inevitably have a retracement in the short term. So when most people in the market are still waiting for a retracement to go long on gold, I will definitely not waste the opportunity of gold retracement in vain.
So for short-term trading, I will consider shorting gold appropriately in the 3375-3395 area, with the target looking at 3360-3350. After gold falls back as expected, we might as well consider going long on gold at a low level.
The bulls have started, aiming at 3400!Gold rose as soon as the market opened, and the highest has now reached above 3374. The upward momentum of gold is strong. It can be seen that after breaking through the recent high of 3365, its morphological structure has obviously tended to a bullish structure, and the technical form shows a "W" double bottom structure and an inverted head and shoulder resonance. The resonance of this technical structure will continue to support the continued rise of gold.
At present, gold is under pressure near the 3380 area in the short term, followed by the area near 3405. At present, gold has a technical retracement near 3380, but it is difficult to destroy the already formed rising structure based on the current retracement strength. Once gold rises again, 3380 will definitely be conquered! It will even continue to the 3400-3410 area; and the area with obvious short-term support is concentrated in the 3350-3340-3330 area, so gold may still rebound again with the support of this area after the decline, and continue to rise.
So for short-term trading, I would consider buying gold in batches based on the support of the 3350-3330 area, with the first target looking at 3380, followed by the 3400-3410 area.
Continue to try to find the top of the band to short goldGold maintained a slow and volatile rise structure during the day. The highest has reached 3348, and it is only a step away from 3350. Will gold continue its upward momentum as usual?
In fact, it was beyond my expectation that gold could break through 3345 in the short term. According to my original expectation, the intraday high of gold was almost around 3345. Although the rebound of gold exceeded expectations, it is currently located near the resistance of 3348-3350, so I will definitely not give priority to chasing gold at high levels in short-term transactions.
Moreover, gold is currently in the resistance area of 3348-3350. The volatility of gold has converged, and the upward momentum has declined. As gold continues to rebound and faces the key resistance area again, the bulls are relatively more cautious. In this context, this resistance area may act as a catalyst, and the bears will react, leading the decline in gold. However, as gold rebounds and the support below gradually stabilizes, we can appropriately reduce the expectation of gold's decline and adjust the decline target to the 3330-3320 area.
So for short-term trading, I will still short gold based on the resistance area, trying to find a swing top in the 3340-3350 area, and look at the target area of 3330-3320.

Golden Trap: Bulls Exhausted, Bears Ready to StrikeToday, the gold market is in a stalemate between long and short positions, with the market fluctuating sideways for a long time and maintaining an overall volatile trend. Although the rebound of gold has won a respite for the bulls, the rebound of gold during the day is not enough to completely reverse the decline. I think that before the 3325-3335 area is stabilized, the bears still have spare power to dominate the market!
According to the current structure, although gold rebounded again after touching 3310 during the retracement, it has retreated many times during the rebound. The candle chart is interspersed with obvious negative candle charts, indicating that the rebound strength is weak. In the short term, it is under pressure in the 3330-3340 area, and it is difficult to break through in a short time.
So I think the role of the gold rebound may be to trap more buyers, so we try not to chase gold after the rebound. The area near 3310 is not a key support in the short term. 3305-3300 is the current key support area. Once the bears regain control of the situation, gold may test the 3305-3300 area again. Once it falls below the reformed area, it may test 3280 again, or even refresh the recent low to around 3270.
So the downward potential of gold is not over yet. We can still look for opportunities to short gold in the 3325-3335 area and look at the target 3305-3295 area.
Don’t be too optimistic, gold may change its face at any time!Gold continued to rebound to around 3320, and it seems to have completely stood above 3300. The bulls are recovering. Should we chase gold in a big way? In fact, due to the disruption of news such as the Federal Reserve's interest rate decision and tariffs, the gold market has clearly shown the characteristics of frequent switching between long and short positions and discontinuity between long and short positions. Therefore, even if gold rebounds to a certain extent, it is difficult for the market to stand unilaterally on the bull side.
In the short term, gold began to retreat from around 3366, reaching a minimum of around 3283, with a retracement of $83; and currently it has only rebounded from the low of 3283 to around 3320, and the rebound is even less than 50%. Gold bulls are not as strong as imagined; although gold continues to rebound, before regaining the 3325-3335 area, it can only be regarded as a technical repair of the sharp drop, and cannot be completely regarded as a reversal of the trend. So after the rebound of gold, gold bears may counterattack strongly at any time.
Therefore, in short-term trading, after gold rebounds, you can consider shorting gold with the 3325-3335 area as resistance, and the first entry area worth paying attention to is 3320-3330.

Short gold, the bears will still counterattack after the reboundGold rebounded to the 3305-3315 area as expected, and our gold long position successfully won 360pips profit. So after standing above 3,300 again, will gold resume its bullish trend?
I think that although gold has stood above 3300 again, it cannot be confirmed that the decline has been completely reversed for the time being. Relatively speaking, gold bears still have the upper hand. In the short term, gold is under pressure in the 3325-3335 area, so before recovering this area, gold bears still have repeated fluctuations, and may even test the 3305-3295 area again. So we can't blindly chase gold in trading.
Before gold recovers the 3325-3335 area, gold can only be regarded as a rebound, not a reversal. So gold bears may counterattack at any time, so in short-term trading, we can consider shorting gold with the 3325-3335 area as resistance after gold rebounds. The first entry area that must be paid attention to is 3320-3330.

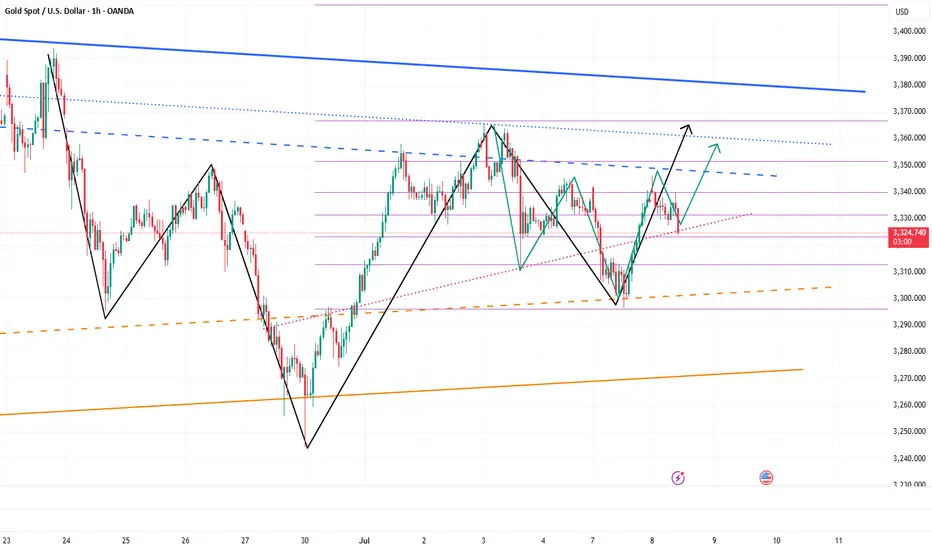
Gold is expected to regain bullish momentum and continue to 3360Yesterday, gold rebounded from 3296 and was able to reach around 3345. Although the process was rather painful, we have to admit that gold bulls still have the energy to wrestle with bears, and the gold market is not one-sidedly dominated by bears. As gold gradually tested and confirmed the effectiveness of support during the retracement process and then rebounded effectively, the short-term structure of gold gradually changed and began to favor bulls.
After gold hit bottom and rebounded yesterday, we can clearly see from the short-term structure that gold has successfully constructed a head and shoulders bottom structure in the three areas of 3295-3244-3296 in the short term, thus playing an absolute supporting role in the structure; and in the process of repeated testing of gold, there are signs of constructing a head and shoulders bottom structure in the three areas of 3310-3296-3325 locally again. Under the effect of the structural support resonance of the head and shoulders bottom, gold may not go below 3320 again, and may even regain the bullish trend and continue to the 3345-3355 area.
So I think there is a lot of profit potential in going long on gold. We can go long on gold with the 3330-3320 area as support and look towards the target area: 3340-3350-3360
Gold may need to retreat to around 3300 againYesterday, the gold rebound stopped at around 3358, and then began to retreat. After that, it even failed to stand above 3350 during the rebound process, which to a certain extent hit the confidence of the bulls;
At present, gold has retreated to the area near 3330 again. Although gold has fallen slowly, the center of gravity of gold is still shifting downward in the short term, and the trading volume of gold is gradually increasing when it is falling, so I think the short position may not be over, and the 3330 area may be broken at any time; and the support area that really deserves our attention is first the 3320-3315 area, followed by the 3300-3295 area;
From the current gold structure, I think gold may still test the area near 3300 again before rising. Only after gold retreats to the area near 3300, it is possible to build an A-B-C head and shoulders bottom structure at the technical level (as shown in the figure), which can also help gold build a complete and effective rising structure, so gold has the need to retreat to the area near 3300 to build a right shoulder structure.
Therefore, I think shorting gold is still the first choice for short-term trading at present; you can consider shorting gold in the 3335-3355 area, looking at the target area of 3320-3310-3300.

Gold may collapse again, don't get buried in it!In the past two trading days, gold began to rebound from a low of around 3245, and has now rebounded to around 3358, with a rebound of up to $113. Moreover, there has been no significant retracement during this rebound, indicating that gold has little intention to fall, and may even continue to rise.
But for me, gold rebounded from 3245. Even if a double bottom structure with 3275 as the secondary low was constructed on the technical level, it should not be enough for gold to rebound more than $113 in just two days as it fell below many supports in the early stage and bullish confidence suffered a serious blow. Moreover, it happened before the uncertain news of the NFP market.
So I have to consider that the market did it deliberately, and its primary purpose was to kill a large number of short chips in the market and lure more attracted long chips; secondly, the sharp rise before the NFP market may be to reserve room for the NFP market to fall in advance; in addition, I have to consider that the US dollar has fallen to a three-year low. If it continues to fall, there may be a global crisis of confidence in the US dollar, and the oversold rebound demand for the US dollar will also suppress gold.
Therefore, I still will not advocate chasing the rise of gold for the time being; on the contrary, I will actively seek opportunities to short gold in the 3350-3370 area; and once gold turns to a downward trend again, it may at least test the 3325-3315-3305 area downward in the short term.

Short gold after reboundGold rebounded after touching 3312, and has now rebounded to 3330, but the rebound strength is far less than the decline strength, so the overall performance of gold is still weak. Because gold fell sharply yesterday, the market bullish confidence suffered a heavy blow, and there are many resistances above after gold fell and broke, and it is under pressure at 3340-3350 in the short term, and there is a technical gap above that suppresses the 3360-3370 area.
Therefore, before gold stabilizes in the 3360-3370 area, the short-selling force still has the upper hand, so we still focus on shorting gold in trading. We can consider shorting gold with the 3340-3350 area as resistance, and look at the target area of 3320-3310.
The Premium privilege of my account will end on June 26, and it will stop updating here from tomorrow. Friends in the channel have already made a lot of money by following my trading strategies. Friends who have not joined yet can join and receive the latest trading strategies and trading signals in the first time to protect your trading!

Start going long on goldAlthough gold is under pressure and weak at present, gold still rebounded near 3295 under the influence of yesterday's major negative news, proving that there is still a large amount of buying funds below, limiting the retracement space of gold; and from 3295 to 3335, there is still a rebound space of $40, proving that gold is not extremely weak. Moreover, there is a gap left above, and there is a technical need to rebound to fill the gap;
In addition, yesterday gold fell sharply due to news, and there should be many longs trapped in the market. If gold is relatively stable, there may be self-rescue behavior of the trapped longs, so gold longs still have the opportunity to rebound to 3340-3350. At present, the main focus is on the short-term support area of 3315-3305, and we can moderately consider going long on gold in this area.

Short gold, it needs to retreat to the area around 3350!Gold is currently testing the support near 3380 again. According to the current trend of gold, gold is likely to break through 3380, and gold has stopped near 3400 many times during the rebound process, and the rebound strength of gold is lacking. If gold really wants to rebound, then after testing near 3380 many times and getting support at 3390, it should have rebounded to the 3410-3420 area, but it is obvious that gold has not yet touched the 3410-3420 area. Therefore, gold's performance is relatively weak and its correction trend should continue for now.
In terms of fundamentals, Iran is not decisive in its retaliatory behavior, so if the conflict in the Middle East does not escalate, gold may find it difficult to continue to rise. So according to the current trend and performance of gold, we should not be stubborn in long gold trading for the time being, and adjust our trading plan reasonably according to the market and price behavior. If gold continues to retreat, the first thing we need to pay attention to below is the 3355-3345 area, followed by the area near 3330. So for the next short-term trading, we can try to short gold in the 3395-3405 area.

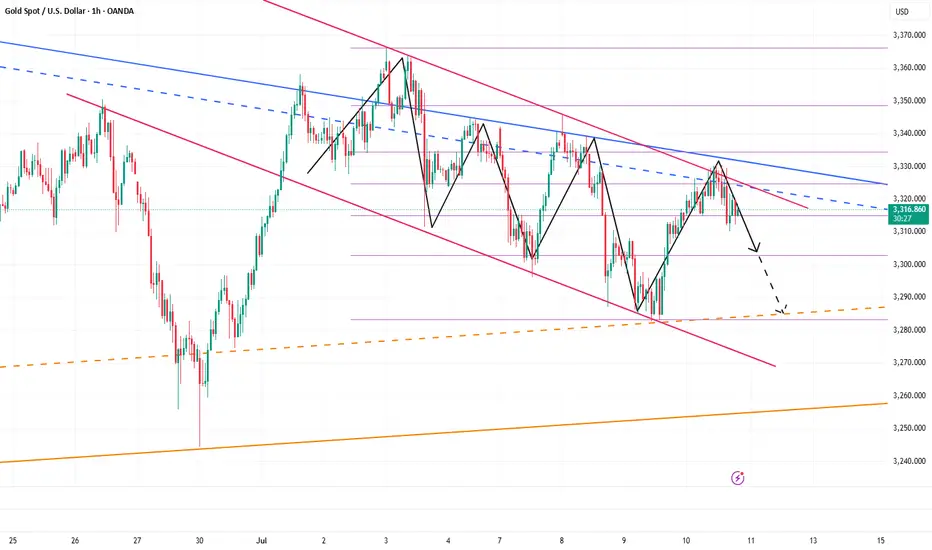
Gold Technicals & FundamentalsThe chart shows gold trading inside a descending channel, with the current price action testing the upper boundary of the channel. The pivot zone around $3,320 is acting as a potential intraday resistance. Despite the recent bounce, the price has not yet broken structure or the descending channel, implying bearish control is still intact unless a breakout above the pivot occurs.
The RSI is near 41, which is moderately bearish and suggests that there is still room for a downside move before oversold conditions. The volume spike during the last bearish candle also indicates strong selling interest near the upper channel boundary.
The black arrow path suggests a probable lower high formation followed by continuation to the downside toward support near $3,260, aligning with the channel’s lower trendline.
Recent hawkish Fed comments and resilient labor market data have strengthened the U.S. dollar, which typically pressures gold lower. As long as Fed rate cut expectations are pushed further out, gold may remain under pressure.

XAUUSD: Buy or Sell?Today's gold market can be said to have the largest intraday volatility since 2025! After experiencing violent fluctuations, the current trend of gold has once again become anxious.
However, from the perspective of range conversion, it is certain that gold is currently operating in a weak position, and after the brutal and violent fluctuations, the market also needs to recuperate. And there will be NFP tomorrow. It is expected that before NFP, it will be difficult for gold to form a new unilateral market again. So in the process of shock, I think both long and short sides have a certain profit space.
First of all, pay attention to the resistance of 3125-3135 area on the top. If gold touches this area during the shock process, we can still short gold;
And the first focus on the 3095-3085 area on the bottom is that if gold touches this area during the shock process, we can still consider going long on gold.
The trading strategy verification accuracy rate is more than 90%; one step ahead, exclusive access to trading strategies and real-time trading settings

GOLD DAILY CHART MID/LONG TERM UPDATEGOLD Daily Chart Update: Precision Analysis for Confident Trading (10th Feb 2024)
Hello Traders,
Here’s the latest update on the GOLD daily chart that we’ve been meticulously tracking and trading. Below, we provide an enhanced breakdown of recent movements, updated key levels, and actionable insights for the days ahead.
Recap of Recent Success in our previous chart:
Our recent analysis delivered remarkable accuracy:
* ENTRY LEVEL 2744: ✅ DONE
* TARGET TP1 (2807): ✅ DONE
* TARGET TP2 (2870): ✅ DONE
* EMA5 crossed and held above both Entry Level (2744) and TP1 (2807), confirming bullish momentum toward TP2 (2870). ✅ DONE
* The FVG zone at 2790 acted as strong support, facilitating upward momentum. ✅ DONE
* EMA5 correction at 2839 was completed successfully. ✅ DONE
* GOLD achieved a new ATH at 2886 after hitting TP2 (2870). ✅DONE
What’s Next for GOLD?
The price is now oscillating between critical weighted levels, with gaps both above and below 2870.
Key Levels to Watch:
Resistance Level: 2870
* A daily candle close above 2870 will confirm bullish momentum, with potential targets toward higher levels.
* Failure to close above this level may trigger a short-term reversal.
EMA5 Behavior:
* Or If EMA5 crosses and locks above 2870, it strengthens the bullish case.
* If EMA5 fails to hold, expect a pullback to key GOLDTURN levels.
Updated Support Levels (GOLDTURN Zones):
2801
2744
2671
2595
Key Scenarios:
* A bullish scenario could see the price retesting 2870 as resistance before pushing higher.
* A bearish scenario may unfold if the price fails to sustain above 2870, leading to a retest of
Recommendations:
* Capitalize on Dip Opportunities: Use smaller timeframes (1H, 4H) to trade around GOLDTURN levels, targeting 30–40 pips per trade.
* Stay focused on shorter trades in this range-bound market to manage volatility effectively.
Long-Term Bias:
Maintain a bullish outlook while viewing pullbacks as buying opportunities.
Accumulate positions near key support levels for a safer approach instead of chasing highs.
Final Note:
Trade with confidence and precision. Our analysis ensures you’re well-prepared to navigate the evolving market landscape. Stay updated with our daily insights across multiple timeframes for deeper clarity.
Thank you for your continued trust! Don’t forget to like, share, and comment to support our work.
Best regards,
The Quantum Trading Mastery Team

GOLD DAILY CHART MID/LONG TERM UPDATEGOLD Daily Chart Update: 17the FEB 2025
Hello Traders,
Here’s the latest update on the GOLD daily chart, which we've been closely monitoring and trading. Below, we break down recent price movements, updated key levels, and provide actionable insights for the days ahead.
Recap of Recent Chart Success!
Our recent analysis has proven highly accurate:
ENTRY LEVEL 2744: ✅ Achieved
TARGET TP1 (2807): ✅ Achieved
TARGET TP2 (2870): ✅ Achieved
TARGET TP3 (2933): ✅ Achieved
What’s Next for GOLD? Bullish or Bearish?
Last week, GOLD reached an all-time high of 2942.59. Currently, the price is fluctuating between the gap above 2933 and the gap below 2870. 2933 is acting as a key resistance level, and an FVG (Fair Value Gap) has formed to reinforce this resistance. As a result, our GoldTurn levels are now activated as key support zones.
KEY LEVEL: 2870
Resistance Levels: 2933, 2990, 3051
Support Levels (GoldTurn Levels): 2870, 2801, 2744, 2671, 2595
EMA5 Behavior:
* Or If EMA5 crosses and locks above 2933, it strengthens the bullish case.
* If EMA5 fails to hold above 2870, cross and lock below this level 2870, expect a pullback to key GOLDTURN levels below.
Recommendations:
* Capitalize on Dip Opportunities: Use smaller timeframes (1H, 4H) to trade around GOLDTURN levels, targeting 30–40 pips per trade.
* Stay focused on shorter trades in this range-bound market to manage volatility effectively.
Long-Term Bias:
Maintain a bullish outlook while viewing pullbacks as buying opportunities.
Accumulate positions near key support levels for a safer approach instead of chasing highs.
Final Note:
Trade with confidence and precision. Our analysis ensures you’re well-prepared to navigate the evolving market landscape. Stay updated with our daily insights across multiple timeframes for deeper clarity.
Thank you for your continued trust! Don’t forget to like, share, and comment to support our work.
Best regards,
The Quantum Trading Mastery Team

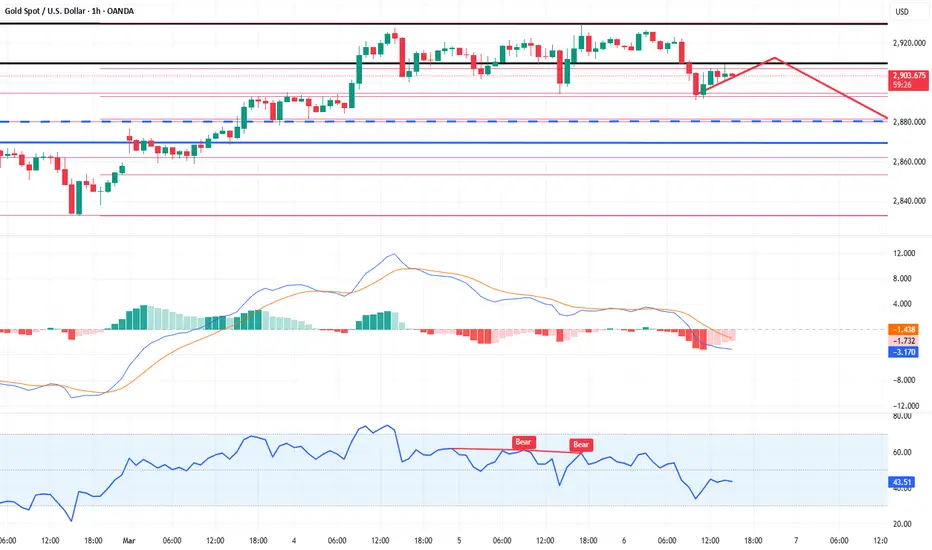
GOLD ROUTE MAP UPDATEHey Everyone,
PIPTASTIC day on the markets today with our chart idea playing out as analysed. Yesterday we had the break below 2901 bearish target, opening the first level of the retracement range at 2878, which just fell short by a few pips. This then provided the support for the bounce all the way into 2922 completing our Bullish target. We were able to take the ride up all the way from the retracement range, inline with our plans to buy dips
We are now looking for a lock above 2922 for a continuation or failure to lock will see price reject into the lower Goldturns for support and bounce, also keeping in mind the small gap left on the retracement range
We will keep the above in mind when taking buys from dips. Our updated levels and weighted levels will allow us to track the movement down and then catch bounces up.
We will continue to buy dips using our support levels taking 30 to 40 pips. As stated before each of our level structures give 20 to 40 pip bounces, which is enough for a nice entry and exit. If you back test the levels we shared every week for the past 24 months, you can see how effectively they were used to trade with or against short/mid term swings and trends.
BULLISH TARGET
2922 - DONE
EMA5 CROSS AND LOCK ABOVE 2922 WILL OPEN THE FOLLOWING BULLISH TARGET
2947
EMA5 CROSS AND LOCK ABOVE 2947 WILL OPEN THE FOLLOWING BULLISH TARGET
2968
BEARISH TARGETS
2901 - DONE
EMA5 CROSS AND LOCK BELOW 2901 WILL OPEN THE FOLLOWING RETRACEMENT RANGE
2878 - 2851
EMA5 CROSS AND LOCK BELOW 2851 WILL OPEN THE SWING RANGE
SWING RANGE
2820 - 2796
As always, we will keep you all updated with regular updates throughout the week and how we manage the active ideas and setups. Thank you all for your likes, comments and follows, we really appreciate it!
Mr Gold
GoldViewFX

Be bold and short gold to reap profitsBros, gold continued to rebound to around 2922, but after touching 2922 several times, gold could not continue to make an effective breakthrough and showed signs of retracement. This proves that the upper pressure is strong. According to the current momentum of gold, it cannot easily break through the resistance of the 2925-2930 zone above.
Then gold must have the need to retrace and accumulate power, so my trading strategy in the above article is still valid. We have shorted gold in the 2915-2925 area according to the trading plan. Now we are patiently waiting for gold to fall deeper and expand our profits. It is expected that gold will retest the 2905-2895 zone again.
Bros, gold is now like a drunken old man, swaying from side to side as he walks. At any moment, he might stumble and fall along the way.
Trading means that everything has results and everything has feedback. I have been committed to market trading and trading strategy sharing, striving to improve the winning rate of trading and maximize profits. If you want to copy trading signals to make a profit, or master independent trading skills and thinking, you can follow the channel at the bottom of the article to copy trading strategies and signals

Gold is about to plummet! Short gold!!!Bros, gold is about to fall sharply. I have shorted gold again. Are you ready? If you don't short gold now, you will completely lose the good opportunity to short gold.
At present, under the pressure of the triple top near 2930 in the technical form, gold has dropped and tested the 2900 mark again. It is only a matter of time before it completely breaks through. As the center of gravity of gold moves down, the upper short-term resistance moves down to the 2910-2920 zone. Under the pressure of the technical form and the fact that gold has just tentatively broken through the 2900 mark, gold still has more room to fall. It is expected that gold will at least retest the 2880-2870 zone in this round of decline, or even lower.
Bros, I have executed the short gold transaction, let us wait and see!Bros, are you optimistic that gold will continue to fall?Wise choices are far greater than hard work. Only by following the right people can we execute the right transactions and accumulate profits that change our lives and destiny. If you want to copy trading signals and make stable profits, or want to learn the correct trading logic and techniques in depth, you can consider joining the channel at the bottom of this article!