XAU/USD 25 June 2025 Intraday AnalysisH4 Analysis:
-> Swing: Bullish.
-> Internal: Bullish.
Analysis and bias remains the same as analysis dated 23 April 2025
Price has now printed a bearish CHoCH according to my analysis yesterday.
Price is now trading within an established internal range.
Intraday Expectation:
Price to trade down to either discount of internal 50% EQ, or H4 demand zone before targeting weak internal high priced at 3,500.200.
Note:
The Federal Reserve’s sustained dovish stance, coupled with ongoing geopolitical uncertainties, is likely to prolong heightened volatility in the gold market. Given this elevated risk environment, traders should exercise caution and recalibrate risk management strategies to navigate potential price fluctuations effectively.
Additionally, gold pricing remains sensitive to broader macroeconomic developments, including policy decisions under President Trump. Shifts in geopolitical strategy and economic directives could further amplify uncertainty, contributing to market repricing dynamics.
H4 Chart:
M15 Analysis:
-> Swing: Bullish.
-> Internal: Bullish.
Following previous high, and printing of bearish CHoCH, price has pulled back to an M15 supply zone, where we are currently seeing a reaction. Therefore, I shall now confirm internal high.
Price is now trading within an established internal range.
The remainder of my analysis shall remain the same as analysis dated 13 June 2025, apart from target price.
As per my analysis dated 22 May 2025 whereby I mentioned price can be seen to be reacting at discount of 50% EQ on H4 timeframe, therefore, it is a viable alternative that price could potentially print a bullish iBOS on M15 timeframe despite internal structure being bearish.
Price has printed a bullish iBOS followed by a bearish CHoCH, which indicates, but does not confirm, bearish pullback phase initiation. I will however continue to monitor, with respect to depth of pullback.
Intraday Expectation:
Price to continue bearish, react at either M15 supply zone, or discount of 50% internal EQ before targeting weak internal high priced at 3,451.375.
Note:
Gold remains highly volatile amid the Federal Reserve's continued dovish stance, persistent and escalating geopolitical uncertainties. Traders should implement robust risk management strategies and remain vigilant, as price swings may become more pronounced in this elevated volatility environment.
Additionally, President Trump’s recent tariff announcements are expected to further amplify market turbulence, potentially triggering sharp price fluctuations and whipsaws.
M15 Chart:
Goldupdate

XAUUSD BULLISH OR BEARISH DETAILED ANALYSISGold (XAUUSD) continues to maintain strong bullish momentum, with current price action sitting around 3,430. We have been holding a bullish outlook since the key accumulation zone between 3,150 and 3,200. Price has consistently formed higher highs and higher lows, and recent consolidation has broken out with conviction. Based on technical structure, my immediate upside target is 3,500, where I expect price to react before potentially extending even higher depending on upcoming macro drivers.
Fundamentally, gold is being fueled by a combination of sticky inflation data and a cautious Fed stance. Even though the FOMC held rates steady in June, market expectations are shifting towards policy easing later in the year due to softening labor data and a cooling economic outlook. Additionally, geopolitical uncertainties and continued central bank gold buying remain strong tailwinds for the metal. The U.S. dollar index has shown minor weakness post-CPI, offering further support to gold bulls.
Technically, the daily chart shows a clean bullish flag breakout that aligns with the trendline support and impulsive wave structure. Price broke above 3,400 with strong volume and minimal resistance, indicating clear bullish dominance. As long as price holds above the 3,380–3,400 zone, continuation toward 3,500 remains highly probable. There is also confluence from previous structure highs and minor Fibonacci extension levels around that mark.
Overall, I remain confidently long on XAUUSD. I’ve been tracking this bullish cycle since the 3,150–3,200 region and continue to favor upside moves backed by macroeconomic and technical alignment. I’ll be watching key reaction zones near 3,500 for potential profit-taking, while holding swing positions with dynamic risk management in place.

BEST XAUUSD M30 BUY SETUP FOR TODAYGold (XAU/USD) is showcasing strong bullish momentum after breaking above the key resistance zone near $3,404, now acting as fresh support. 🔄 The price formed a bullish structure with clean higher highs and higher lows on the 30-minute chart, confirming buying strength. 🟣 The marked demand zone around $3,392–$3,404 is critical—if price retests and holds this level, we can expect a continuation toward $3,420 and beyond. 🚀📌 Traders should watch for bullish confirmations on pullbacks to this zone for potential long setups. 🧠⚡

XAU/USD 12 June 2025 Intraday AnalysisH4 Analysis:
-> Swing: Bullish.
-> Internal: Bullish.
Analysis and bias remains the same as analysis dated 23 April 2025
Price has now printed a bearish CHoCH according to my analysis yesterday.
Price is now trading within an established internal range.
Intraday Expectation:
Price to trade down to either discount of internal 50% EQ, or H4 demand zone before targeting weak internal high priced at 3,500.200.
Note:
The Federal Reserve’s sustained dovish stance, coupled with ongoing geopolitical uncertainties, is likely to prolong heightened volatility in the gold market. Given this elevated risk environment, traders should exercise caution and recalibrate risk management strategies to navigate potential price fluctuations effectively.
Additionally, gold pricing remains sensitive to broader macroeconomic developments, including policy decisions under President Trump. Shifts in geopolitical strategy and economic directives could further amplify uncertainty, contributing to market repricing dynamics.
H4 Chart:
M15 Analysis:
-> Swing: Bullish.
-> Internal: Bearish.
Analysis and bias remains the same as analysis dated 22 May 2025.
In my analysis from 12 May 2025, I noted that price had yet to target the weak internal high, including on the H4 timeframe. This aligns with the ongoing corrective bearish pullback across higher timeframes, so a bearish internal Break of Structure (iBOS) was a likely outcome.
As anticipated, price targeted strong internal low, confirming a bearish iBOS.
Price has remained within the internal range for an extended period and has yet to target the weak internal low. A contributing factor could be the bullish nature of the H4 timeframe's internal range, which has reacted from a discounted level at 50% of the internal equilibrium (EQ).
Intraday Expectation:
Technically price to continue bullish, react at either premium of internal 50% EQ or M15 demand zone before targeting weak internal low priced at 3,120.765.
Alternative scenario:
Price can be seen to be reacting at discount of 50% EQ on H4 timeframe, therefore, it is a viable alternative that price could potentially print a bullish iBOS on M15 timeframe.
Note:
Gold remains highly volatile amid the Federal Reserve's continued dovish stance and persistent geopolitical uncertainties. Traders should implement robust risk management strategies and remain vigilant, as price swings may become more pronounced in this elevated volatility environment.
Additionally, President Trump’s recent tariff announcements are expected to further amplify market turbulence, potentially triggering sharp price fluctuations and whipsaws.
M15 Chart:

XAU/USD 05 June 2025 Intraday AnalysisH4 Analysis:
-> Swing: Bullish.
-> Internal: Bullish.
Analysis and bias remains the same as analysis dated 23 April 2025
Price has now printed a bearish CHoCH according to my analysis yesterday.
Price is now trading within an established internal range.
Intraday Expectation:
Price to trade down to either discount of internal 50% EQ, or H4 demand zone before targeting weak internal high priced at 3,500.200.
Note:
The Federal Reserve’s sustained dovish stance, coupled with ongoing geopolitical uncertainties, is likely to prolong heightened volatility in the gold market. Given this elevated risk environment, traders should exercise caution and recalibrate risk management strategies to navigate potential price fluctuations effectively.
Additionally, gold pricing remains sensitive to broader macroeconomic developments, including policy decisions under President Trump. Shifts in geopolitical strategy and economic directives could further amplify uncertainty, contributing to market repricing dynamics.
H4 Chart:
M15 Analysis:
-> Swing: Bullish.
-> Internal: Bearish.
Analysis and bias remains the same as analysis dated 22 May 2025.
In my analysis from 12 May 2025, I noted that price had yet to target the weak internal high, including on the H4 timeframe. This aligns with the ongoing corrective bearish pullback across higher timeframes, so a bearish internal Break of Structure (iBOS) was a likely outcome.
As anticipated, price targeted strong internal low, confirming a bearish iBOS.
Price has remained within the internal range for an extended period and has yet to target the weak internal low. A contributing factor could be the bullish nature of the H4 timeframe's internal range, which has reacted from a discounted level at 50% of the internal equilibrium (EQ).
Intraday Expectation:
Technically price to continue bullish, react at either premium of internal 50% EQ or M15 demand zone before targeting weak internal low priced at 3,120.765.
Alternative scenario:
Price can be seen to be reacting at discount of 50% EQ on H4 timeframe, therefore, it is a viable alternative that price could potentially print a bullish iBOS on M15 timeframe.
Note:
Gold remains highly volatile amid the Federal Reserve's continued dovish stance and persistent geopolitical uncertainties. Traders should implement robust risk management strategies and remain vigilant, as price swings may become more pronounced in this elevated volatility environment.
Additionally, President Trump’s recent tariff announcements are expected to further amplify market turbulence, potentially triggering sharp price fluctuations and whipsaws.
M15 Chart:

XAU/USD 04 June 2025 Intraday AnalysisH4 Analysis:
-> Swing: Bullish.
-> Internal: Bullish.
Analysis and bias remains the same as analysis dated 23 April 2025
Price has now printed a bearish CHoCH according to my analysis yesterday.
Price is now trading within an established internal range.
Intraday Expectation:
Price to trade down to either discount of internal 50% EQ, or H4 demand zone before targeting weak internal high priced at 3,500.200.
Note:
The Federal Reserve’s sustained dovish stance, coupled with ongoing geopolitical uncertainties, is likely to prolong heightened volatility in the gold market. Given this elevated risk environment, traders should exercise caution and recalibrate risk management strategies to navigate potential price fluctuations effectively.
Additionally, gold pricing remains sensitive to broader macroeconomic developments, including policy decisions under President Trump. Shifts in geopolitical strategy and economic directives could further amplify uncertainty, contributing to market repricing dynamics.
H4 Chart:
M15 Analysis:
-> Swing: Bullish.
-> Internal: Bearish.
Analysis and bias remains the same as analysis dated 22 May 2025.
In my analysis from 12 May 2025, I noted that price had yet to target the weak internal high, including on the H4 timeframe. This aligns with the ongoing corrective bearish pullback across higher timeframes, so a bearish internal Break of Structure (iBOS) was a likely outcome.
As anticipated, price targeted strong internal low, confirming a bearish iBOS.
Price has remained within the internal range for an extended period and has yet to target the weak internal low. A contributing factor could be the bullish nature of the H4 timeframe's internal range, which has reacted from a discounted level at 50% of the internal equilibrium (EQ).
Intraday Expectation:
Technically price to continue bullish, react at either premium of internal 50% EQ or M15 demand zone before targeting weak internal low priced at 3,120.765.
Alternative scenario:
Price can be seen to be reacting at discount of 50% EQ on H4 timeframe, therefore, it is a viable alternative that price could potentially print a bullish iBOS on M15 timeframe.
Note:
Gold remains highly volatile amid the Federal Reserve's continued dovish stance and persistent geopolitical uncertainties. Traders should implement robust risk management strategies and remain vigilant, as price swings may become more pronounced in this elevated volatility environment.
Additionally, President Trump’s recent tariff announcements are expected to further amplify market turbulence, potentially triggering sharp price fluctuations and whipsaws.
M15 Chart:

XAU/USD 30 May 2025 Intraday AnalysisH4 Analysis:
-> Swing: Bullish.
-> Internal: Bullish.
Analysis and bias remains the same as analysis dated 23 April 2025
Price has now printed a bearish CHoCH according to my analysis yesterday.
Price is now trading within an established internal range.
Intraday Expectation:
Price to trade down to either discount of internal 50% EQ, or H4 demand zone before targeting weak internal high priced at 3,500.200.
Note:
The Federal Reserve’s sustained dovish stance, coupled with ongoing geopolitical uncertainties, is likely to prolong heightened volatility in the gold market. Given this elevated risk environment, traders should exercise caution and recalibrate risk management strategies to navigate potential price fluctuations effectively.
Additionally, gold pricing remains sensitive to broader macroeconomic developments, including policy decisions under President Trump. Shifts in geopolitical strategy and economic directives could further amplify uncertainty, contributing to market repricing dynamics.
H4 Chart:
M15 Analysis:
-> Swing: Bullish.
-> Internal: Bearish.
Analysis and bias remains the same as analysis dated 22 May 2025.
In my analysis from 12 May 2025, I noted that price had yet to target the weak internal high, including on the H4 timeframe. This aligns with the ongoing corrective bearish pullback across higher timeframes, so a bearish internal Break of Structure (iBOS) was a likely outcome.
As anticipated, price targeted strong internal low, confirming a bearish iBOS.
Price has remained within the internal range for an extended period and has yet to target the weak internal low. A contributing factor could be the bullish nature of the H4 timeframe's internal range, which has reacted from a discounted level at 50% of the internal equilibrium (EQ).
Intraday Expectation:
Technically price to continue bullish, react at either premium of internal 50% EQ or M15 demand zone before targeting weak internal low priced at 3,120.765.
Alternative scenario:
Price can be seen to be reacting at discount of 50% EQ on H4 timeframe, therefore, it is a viable alternative that price could potentially print a bullish iBOS on M15 timeframe.
Note:
Gold remains highly volatile amid the Federal Reserve's continued dovish stance and persistent geopolitical uncertainties. Traders should implement robust risk management strategies and remain vigilant, as price swings may become more pronounced in this elevated volatility environment.
Additionally, President Trump’s recent tariff announcements are expected to further amplify market turbulence, potentially triggering sharp price fluctuations and whipsaws.
M15 Chart:

XAU/USD 28 May 2025 Intraday AnalysisH4 Analysis:
-> Swing: Bullish.
-> Internal: Bullish.
Analysis and bias remains the same as analysis dated 23 April 2025
Price has now printed a bearish CHoCH according to my analysis yesterday.
Price is now trading within an established internal range.
Intraday Expectation:
Price to trade down to either discount of internal 50% EQ, or H4 demand zone before targeting weak internal high priced at 3,500.200.
Note:
The Federal Reserve’s sustained dovish stance, coupled with ongoing geopolitical uncertainties, is likely to prolong heightened volatility in the gold market. Given this elevated risk environment, traders should exercise caution and recalibrate risk management strategies to navigate potential price fluctuations effectively.
Additionally, gold pricing remains sensitive to broader macroeconomic developments, including policy decisions under President Trump. Shifts in geopolitical strategy and economic directives could further amplify uncertainty, contributing to market repricing dynamics.
H4 Chart:
M15 Analysis:
-> Swing: Bullish.
-> Internal: Bearish.
Analysis and bias remains the same as analysis dated 22 May 2025.
In my analysis from 12 May 2025, I noted that price had yet to target the weak internal high, including on the H4 timeframe. This aligns with the ongoing corrective bearish pullback across higher timeframes, so a bearish internal Break of Structure (iBOS) was a likely outcome.
As anticipated, price targeted strong internal low, confirming a bearish iBOS.
Price has remained within the internal range for an extended period and has yet to target the weak internal low. A contributing factor could be the bullish nature of the H4 timeframe's internal range, which has reacted from a discounted level at 50% of the internal equilibrium (EQ).
Intraday Expectation:
Technically price to continue bullish, react at either premium of internal 50% EQ or M15 demand zone before targeting weak internal low priced at 3,120.765.
Alternative scenario:
Price can be seen to be reacting at discount of 50% EQ on H4 timeframe, therefore, it is a viable alternative that price could potentially print a bullish iBOS on M15 timeframe.
Note:
Gold remains highly volatile amid the Federal Reserve's continued dovish stance and persistent geopolitical uncertainties. Traders should implement robust risk management strategies and remain vigilant, as price swings may become more pronounced in this elevated volatility environment.
Additionally, President Trump’s recent tariff announcements are expected to further amplify market turbulence, potentially triggering sharp price fluctuations and whipsaws.
M15 Chart:

EURAUD BULLISH OR BEARISH DETAILED ANALYSISEURAUD is currently presenting a textbook bullish setup with a well-defined falling wedge formation on the daily chart. After a strong impulsive rally in April, price has been consolidating within this wedge, forming consistent lower highs and lower lows—typical of a corrective pattern. Now, with price testing the upper trendline of the wedge, we are positioned for a potential breakout, supported by increasing bullish momentum and clean structure. With the current price around 1.75, the next leg higher toward the 1.85 resistance zone is well on the radar.
From a fundamental perspective, the euro is gaining strength on the back of improving Eurozone macro data, with recent PMI figures showing resilience and inflation staying moderately sticky—making the ECB cautious about aggressive rate cuts. Meanwhile, the Australian dollar continues to face headwinds amid declining commodity prices and weakening consumer sentiment. The Reserve Bank of Australia remains relatively dovish, especially as wage growth plateaus and inflation expectations cool. This EURAUD divergence sets the stage for a broader move in favor of the euro.
Technically, the breakout from this wedge structure would signify the continuation of the prior bullish trend, and given the size of the previous impulsive move, a breakout target of 1.85 is both conservative and well-aligned with market structure. The bullish divergence forming on oscillators such as RSI and MACD also confirms the slowing momentum in the downward move. A clean break and close above 1.7550 would be the trigger point for long positions, with invalidation below 1.7220.
This is a high-probability breakout setup with strong confluence across technical and fundamental indicators. With euro strength coming into play and AUD fundamentals remaining weak, I’m favoring the long side here. A move toward 1.85 is well-supported, and a break above the wedge could trigger significant upside in the coming sessions. This is a setup worth watching closely.

XAUUSD BULLISH OR BEARISH DETAILED ANALYSISXAUUSD is showing a textbook technical reaction from a well-defined support zone around the 3145–3170 range, which aligns perfectly with previous structure and demand zones. After a sharp retracement from recent highs, gold is now posting a strong bullish bounce, validating this level as a significant area of buyer interest. With today’s push above 3230, this bounce confirms our bullish thesis, and I now expect a continuation move toward the 3500 mark in the coming weeks.
Fundamentally, gold remains one of the most favored assets in 2025 due to ongoing global economic uncertainty, rising geopolitical risks, and persistent central bank demand. With US inflation cooling and the Fed signaling the potential for rate cuts later this year, real yields are slipping, giving gold the macro tailwind it needs to push higher. Moreover, recent data from China shows continued accumulation of gold reserves, reinforcing the long-term bullish case.
Technically, this correction appears to be a healthy retest in a strong uptrend. The market has respected the previous breakout level, and we are seeing early signs of momentum returning. The price action is starting to structure higher lows, and if price clears the 3250 level convincingly, it will likely trigger further momentum-based buying. I’m targeting 3500 as the next major resistance, where we could see some profit-taking.
This setup is one of the cleanest long opportunities on the board. With institutional positioning still net long, and technical and macro alignment pointing higher, I see this as a high-conviction trade. As long as price holds above 3145, the path of least resistance remains up. I’ll be closely watching for further confirmation as we build toward the 3500 target.

XAUUSD BULLISH OR BEARISH DETAILED ANALYSISGold (XAUUSD) is currently trading around the 3170 level after pulling back from its recent highs near 3400. Price action is showing strong signs of bullish resilience as it bounces off a key support zone, suggesting the corrective phase may be nearing completion. The structure on the 2-day chart is shaping up as a healthy retracement within a strong uptrend, and the latest bounce is gaining volume, which indicates renewed buying interest and a potential re-entry point for bulls.
From a macroeconomic perspective, ongoing concerns about persistent inflation, global debt levels, and geopolitical tensions continue to support the bullish narrative for gold. With the latest U.S. CPI data showing inflation remaining above the Fed's comfort zone, the likelihood of prolonged higher interest rates remains in play. However, real yields have not kept pace, making gold an attractive hedge in this environment. Central banks worldwide are still aggressively accumulating gold as a reserve diversification strategy, which reinforces the broader demand.
Technically, the market is reacting precisely from a demand zone around 3120–3150, where historical resistance turned support. Momentum is building for a continuation of the bullish trend, and a push toward the 3500 level looks increasingly likely if price breaks above the minor resistance around 3250 with conviction. The risk-reward here remains favorable, especially with the clear invalidation level just below the recent lows.
As a professional trader, I view this structure as a textbook bullish continuation setup. The strong trend, clean bounce, and increasing volume are aligning for a potential breakout toward 3500. With macro catalysts and technical confirmation supporting the bullish bias, this is a solid opportunity for swing buyers to ride the next leg up in gold.

Gold Updates - XAUUSD May 14 Wednesday🧠 XAUUSD – Market Outlook & Tactical Watchlist (May 14)
GoldMindsFX Chart Update
📉 Bias:
Still bearish on H1–H4. Price structure remains heavy, with compression beneath resistance and weak bullish rejections off demand.
Momentum is stuck between hopeful dips and unforgiving supply.
🧭 Macro Context:
CPI data yesterday gave the market a good shake, but instead of confirming a breakout, Gold has slumped back into a sideways liquidity trap. Every little spike gets slapped down.
Translation? We’re in "mess around and find out" territory.
No clean direction until one of the extremes gets swept with volume and confirmation.
🔎 Zones to Watch – Tactical Map (Wide Ranges Only)
📌 3247–3265
➡️ This is a key compression zone. It was tested overnight and rejected. If price returns here and stalls, watch for signs of absorption. If it rips through → next target is higher (but we don’t chase).
📌 3280–3295
➡️ Untested shelf above CPI drop. Premium supply area that might magnet price — but only if we break clean above 3265.
📌 3205–3180
➡️ Broader demand basin. Price is bouncing here but without real commitment. Still valid for reactive watch — but bulls have no real control.
📌 Below 3174
➡️ The vault. This is the final flush zone. If Gold loses all composure and dives, this is where serious interest may return. No front-running.
⚠️ Notes on Structure:
Price is stuck inside a liquidity funnel between 3235 and 3220.
Rejection wicks = traps. Don’t engage unless structure shifts.
No BOS = No boss. We don’t serve chop.
📸 Summary for the Chart Watchers:
We are inside mid-support territory, but nothing is confirmed yet.
Bulls need to break above 3247 and hold it.
Bears want to crack below 3200 with aggression.
Until then, this is a staring contest between imbalance and indecision.
🧠 Final Note
The zone is never the trade.
The behavior inside is.
Drop a 🚀 Follow, comment, and share with your trading crew — if this helps your trading; let’s build a sharp Gold team
📌 Important Notice!!!
The above analysis is for educational purposes only and does not constitute financial advice. Always compare with your plan and wait for confirmation before taking action.

XAUUSD BULLISH OR BEARISH DETAILED ANALYSISXAUUSD is currently trading around 3250, consolidating within a well-defined bullish flag structure after a strong impulsive rally. This flag pattern on the 12-hour chart reflects healthy profit-taking and reaccumulation after a significant upward move. The current price action is respecting the lower boundary of the flag, and with growing volume on bullish candles, the setup suggests a high probability of a breakout to the upside, targeting the 3650 region.
From a macroeconomic perspective, gold remains in strong demand due to ongoing global uncertainties and persistent inflation concerns. The US CPI print remains sticky above 3%, keeping real yields under pressure and supporting gold's bullish bias. Furthermore, with the Fed expected to hold interest rates steady for longer, the market is starting to price in fewer rate cuts this year. This continues to undermine the USD and supports gold as a store of value. Additionally, rising central bank gold purchases and geopolitical risk premium are adding further tailwinds.
Technically, we are watching for a clean breakout above the upper flag resistance around 3280–3300. A breakout with volume confirmation would open the door toward the psychological 3400 level first, followed by a push toward the 3650 target area. Momentum indicators are turning up, and price is showing signs of basing just above previous support levels, adding confidence to the bullish continuation scenario.
Gold remains one of the strongest trending assets in 2025, and this consolidation is likely just a pause before the next leg higher. As global markets digest the impact of persistent inflation and macro volatility, precious metals like gold are likely to outperform. This flag formation provides a textbook continuation setup for traders looking to position with the broader trend.

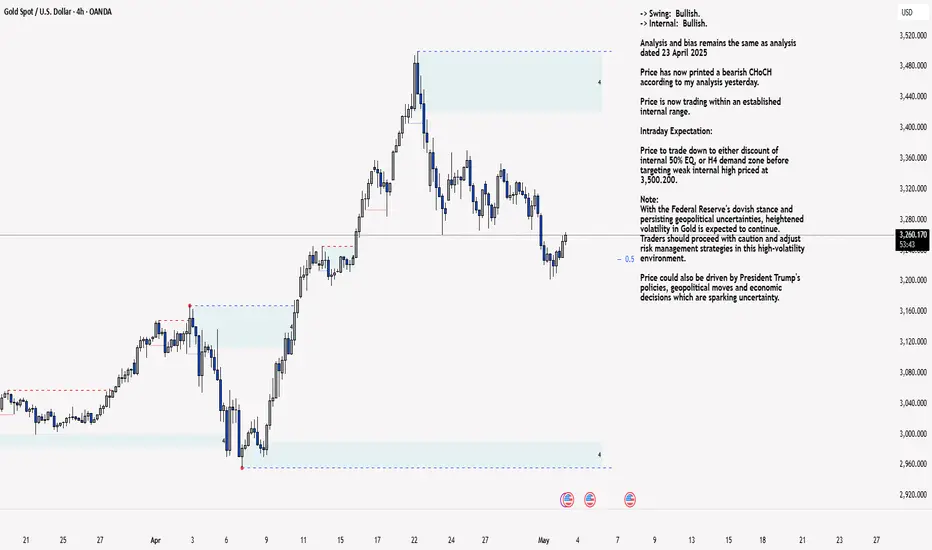
XAU/USD 12 May 2025 Intraday AnalysisH4 Analysis:
-> Swing: Bullish.
-> Internal: Bullish.
Analysis and bias remains the same as analysis dated 23 April 2025
Price has now printed a bearish CHoCH according to my analysis yesterday.
Price is now trading within an established internal range.
Intraday Expectation:
Price to trade down to either discount of internal 50% EQ, or H4 demand zone before targeting weak internal high priced at 3,500.200.
Note:
With the Federal Reserve's dovish stance and persisting geopolitical uncertainties, heightened volatility in Gold is expected to continue. Traders should proceed with caution and adjust risk management strategies in this high-volatility environment.
Price could also be driven by President Trump's policies, geopolitical moves and economic decisions which are sparking uncertainty.
H4 Chart:
M15 Analysis:
-> Swing: Bullish.
-> Internal: Bullish.
As mentioned previously mentioned that I would continue to monitor price and depth of bearish pullback following previous bullish iBOS.
Price did not pull back with any significance, therefore, I will apply discretion and not mark the previous iBOS. I have however marked this in red.
Price continued bullish and subsequently printed a bearish iBOS to indicate, but not confirm bearish pullback phase initiation.
Price is now trading within an established internal range, however, I will continue to monitor depth of pullback.
Intraday Expectation:
Price to trade down to either discount of internal 50% EQ, or M15 supply zones before targeting weak internal high priced at 3,435.055.
Alternative scenario:
Price has this far failed to target to target weak internal high, as has H4 TF. This could be related to the fact that all higher timeframes remain in corrective bearish pullback phase initiation, therefore, it should not come as a surprise if price prints a bearish iBOS.
Note:
Gold price volatility is expected to remain heightened due to the Federal Reserve’s dovish approach and persistent geopolitical uncertainties. Traders should remain vigilant, fine-tune their risk management strategies, and be prepared for potential price fluctuations in this highly volatile market. Additionally, recent tariff announcements by former President Trump are likely to exacerbate market instability, leading to further price swings.
M15 Chart:

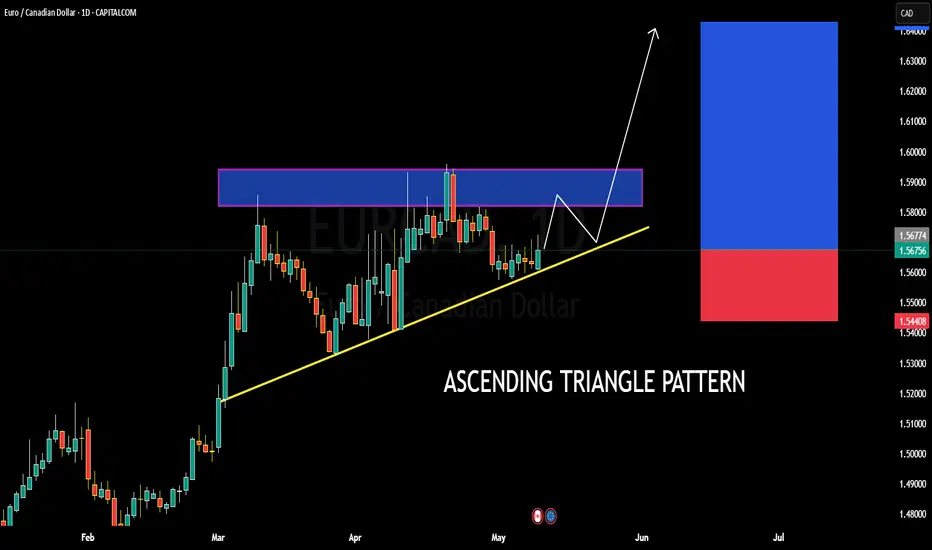
EURCAD BULLISH OR BEARISH DETAILED ANALYSISEURCAD is currently trading around 1.5600 and is consolidating within a textbook ascending triangle pattern on the daily timeframe. This setup signals a strong bullish bias as the pair continues to form higher lows, tightening under a key horizontal resistance zone between 1.5730 and 1.5770. Price is respecting the ascending trendline very well, indicating buyer strength. A breakout above this resistance zone could open the doors for a clean rally toward the 1.6400 psychological level, offering a strong risk-to-reward opportunity.
From a fundamental standpoint, the euro is gaining traction as recent Eurozone economic indicators suggest improving sentiment and a potential shift in ECB tone toward neutral. Meanwhile, the Canadian dollar remains pressured by falling crude oil prices and softening domestic data, including disappointing employment numbers this week. This divergence in fundamentals aligns well with the bullish technical structure for EURCAD, creating a high-probability scenario for buyers.
Looking ahead, a confirmed breakout above 1.5770 with volume could trigger a strong bullish impulse. The measured move from the triangle’s base supports a projection toward the 1.6400 area, making this setup attractive for swing traders aiming to ride the next leg higher. Risk should remain controlled below 1.5440, where the ascending structure would be invalidated.
I’m closely monitoring the price action near the breakout zone. Patience is key, but once we see bullish momentum pushing through the resistance, this trade setup has the potential to deliver a solid upside run. EURCAD remains one of my top bullish forex plays going into mid-May.
EURJPY BULLISH OR BEARISH DETAILED ANALYSIS ??EURJPY is currently trading around 162.800 and showing clear bullish momentum after a clean bounce off a strong support zone. Price has been consolidating above a well-established demand area, and today's candle confirms renewed buyer interest. The reaction from this level highlights a potential shift back to the upside, with 169.000 marked as the next significant target. The rejection wicks and structure suggest accumulation, with the market gearing up for a bullish continuation.
From a fundamental perspective, the euro is gaining strength on the back of better-than-expected economic data across the eurozone, while the Japanese yen continues to face broad pressure due to the Bank of Japan's dovish stance. The BOJ remains committed to ultra-loose monetary policy, which puts the yen at a disadvantage against stronger currencies like the euro, especially when inflation expectations in Europe remain sticky.
Technically, EURJPY has respected this support zone multiple times, creating a solid base of demand. Each test has been met with higher lows, reinforcing the bullish bias. The price action is forming a classic support-retest continuation pattern, and if this structure holds, we could see a swift move toward 169.000. Volume and momentum indicators are also beginning to align in favor of the bulls.
Looking forward, as long as price holds above the 162.200 area, the path of least resistance remains upward. Traders will be watching for continuation signals and breakouts of minor resistance zones to confirm the move. This setup offers a favorable risk-reward structure, and with market sentiment tilting toward euro strength, EURJPY has the potential to deliver solid gains in the coming sessions.

XAUUSD Bullish or bearish Detailed AnalysisXAUUSD is currently trading around 3380, continuing its bullish momentum as previously anticipated. The price action has followed the projected path, delivering substantial profits for those positioned early. The next key resistance level is at 3450, aligning with the upper boundary of the ascending channel.
Fundamentally, gold's rally is supported by heightened safe-haven demand amid ongoing geopolitical tensions and a weakening U.S. dollar. Investors are closely watching the upcoming Federal Reserve meeting, with expectations leaning toward a dovish stance, which could further bolster gold prices .
Technical indicators suggest that the bullish trend remains intact, with the price maintaining its position above key moving averages. However, traders should be cautious of potential pullbacks as the market approaches overbought conditions.
In summary, XAUUSD is on track toward the 3450 target, supported by both technical and fundamental factors. Traders should monitor key resistance levels and macroeconomic developments to manage their positions effectively.

XAU/USD 02 May 2025 Intraday AnalysisH4 Analysis:
-> Swing: Bullish.
-> Internal: Bullish.
Analysis and bias remains the same as analysis dated 23 April 2025
Price has now printed a bearish CHoCH according to my analysis yesterday.
Price is now trading within an established internal range.
Intraday Expectation:
Price to trade down to either discount of internal 50% EQ, or H4 demand zone before targeting weak internal high priced at 3,500.200.
Note:
With the Federal Reserve's dovish stance and persisting geopolitical uncertainties, heightened volatility in Gold is expected to continue. Traders should proceed with caution and adjust risk management strategies in this high-volatility environment.
Price could also be driven by President Trump's policies, geopolitical moves and economic decisions which are sparking uncertainty.
H4 Chart:
M15 Analysis:
-> Swing: Bullish.
-> Internal: Bearish.
As mentioned in yesterday's analysis dated 01 May 2025 whereby I mentioned that I would continue to monitor price and depth of bullish pullback following the printing of a bearish iBOS followed by a bullish CHoCH.
Price did not pullback significantly enough to warrant a further bearish iBOS, therefore, I will apply discretion and not classify this as such, I have however marked in red.
Price has since continued bearish, subsequently printing a bullish CHoCH.
Internal structure is now established, however, I will continue to monitor price regarding depth of pullback as previous.
Intraday Expectation:
Price to trade up to either premium of internal 50% EQ, or M15 supply zone before targeting weak internal low priced at 3,201.955
Note:
With the Federal Reserve maintaining a dovish stance and ongoing geopolitical tensions, volatility in Gold prices is expected to remain elevated. Traders should exercise caution, adjust risk management strategies, and stay prepared for potential price whipsaws in this high-volatility environment.
Trump's tariff announcement will most likely cause considerably increased volatility and whipsaws.
M15 Chart:
XAUUSD DETAILED ANALYSIS TECHNICAL AND FUNDAMENTALS XAUUSD is currently trading around the 3256 level and is clearly respecting a descending channel on the 1-hour timeframe. The price is now pushing higher from the lower boundary of the channel, suggesting short-term bullish momentum. Based on the current technical structure, I am anticipating a clean breakout above the channel resistance, with the next key target at 3300. The marked purple resistance zone around 3310–3320 also acts as a magnet for price once the breakout is confirmed.
On the fundamental side, gold remains supported by ongoing geopolitical uncertainty and speculation around the Fed's next rate decision. With recent U.S. economic data showing mixed signals—strong labor market figures but slowing inflation momentum—the market is pricing in fewer rate hikes, which weakens the USD and favors upside in XAUUSD. Additionally, central bank gold demand remains strong globally, acting as a long-term support for bullion.
Traders are currently reacting to a softening dollar index and treasury yields, which further underpins bullish sentiment in gold. A clear break above the upper boundary of this channel, ideally with strong volume confirmation, could set the stage for a swift move to retest the 3300 psychological level. From a risk-reward perspective, the breakout trade setup here aligns well with institutional strategies that favor trend continuation post-consolidation.
In summary, XAUUSD is trading inside a clean descending channel, with buyers stepping in aggressively near the support zone. A breakout above the structure could trigger a bullish continuation move toward 3300, backed by strong macro tailwinds and technical confirmation. This setup offers an excellent opportunity for swing traders to capitalize on short-term momentum. Are you also tracking gold fundamentals this week?

Gold Price (XAUUSD) Retesting Fibonacci Support ZoneGold (XAUUSD) is currently in a technical phase that aligns with a classic **retesting formation**, where price action returns to previous support levels before resuming its bullish trend. After hitting a recent high near 3,350–3,400, gold has begun a healthy retracement, with key Fibonacci levels acting as potential demand zones. The 3,200–3,150 range appears to be a strong support zone, and if this level holds, it could trigger the next leg up in the bullish trend. Volume remains supportive, suggesting market interest is still intact, and buyers may be preparing for re-entry.
This consolidation phase could offer an excellent opportunity for smart money accumulation, particularly as gold respects major technical levels and Fibonacci retracement zones. From a macro perspective, continued geopolitical tensions, inflationary concerns, and central bank accumulation of gold provide a strong fundamental backdrop that supports a long-term bullish outlook. If gold maintains above the key 0.5 and 0.618 retracement levels, we could soon witness a new wave targeting the 3,350 to 3,400 resistance zone once again.
Market participants should watch for confirmation through bullish candlestick patterns and increasing volume in the coming sessions. A break above 3,275 would further validate bullish continuation and may serve as a trigger point for momentum traders. The broader trend remains intact, and current price action fits the pattern of a technical breather before the next impulsive rally.
✅ Show your support by hitting the like button and
✅ Leaving a comment below! (What is You opinion about this Coin)
Your feedback and engagement keep me inspired to share more insightful market analysis with you!

XAUUSD DAILY PLAN & MARKET UPDATE — APRIL 30, 2025Not predictions. Structure. Logic. Execution.
📍 What Happened:
🔻 3315–3325 SELL → Perfect rejection → Drop of 200+ pips
🔁 Retest at 3314 → Confirmed OB rejection zone
❌ 3284–3288 BUY → Invalidated, BOS clean
✅ 3260–3270 BUY → Real reaction zone. OB + FVG + full discount → Delivered bounce
👁🗨 Eyes On (Into NY Session & May 1):
3315–3325 = Decision zone
→ Break = bullish reversal
→ Rejection = new short trigger
3260–3270 = Key support. If holds = bounce continuation
3252–3244 = Next strong buy zone if 3260 fails
3350 / 3385 = Targets only if bullish breakout occurs post-news
🧠 Current Bias:
🔸 HTF Trend: Consolidation under ATH → bearish-leaning
🔹 LTF Flow: Bearish structure unless 3315 flips
🎯 Bias: Neutral-bearish → shifting bullish only above 3325
📊 KEY LEVELS TO WATCH:
Zone Type Level(s) Commentary
🔻 Resistance 3385 HTF FVG zone / reversal risk
🔻 Resistance 3350 Clean target above breakout
🔻 Resistance 3325 Final barrier before shift
🔻 Flip Zone 3315–3320 Must flip to validate bulls
🔁 Retest 3308–3312 Last OB rejection
⚖️ Mid Zone 3286–3292 Retest structure, weak
✅ Support 3260–3270 Confirmed bounce zone
🟩 Demand 3252–3244 Next high-conviction buy zone
🟢 Discount 3220–3235 Long-term OB zone
🟢 Discount 3192–3205 Extreme discount + FVG
🗓️ MACRO FOR MAY 1:
🗣️ 15:30 Trump Speech
📉 15:30 Unemployment Claims (forecast: 224K)
🏭 15:45 Final Manufacturing PMI
🏭 17:00 ISM Manufacturing PMI + Prices
⚠️ Expect high volatility. Prepare for breakout setups only after structure confirms — not before.
🎯 Final Note:
If 3315–3325 breaks cleanly → we’re heading to 3350 / 3385.
If it holds → we hunt reentry shorts with sniper precision.
This is not a place to guess. It’s where real traders wait.
—
📌 Like plans built on logic, not luck?
Drop a 🧠 if this structure helped you.
🔥 Follow if you're done with signal-chasing and ready to trade like a sniper.

XAU/USD 01 May 2025 Intraday AnalysisH4 Analysis:
-> Swing: Bullish.
-> Internal: Bullish.
Analysis and bias remains the same as analysis dated 23 April 2025
Price has now printed a bearish CHoCH according to my analysis yesterday.
Price is now trading within an established internal range.
Intraday Expectation:
Price to trade down to either discount of internal 50% EQ, or H4 demand zone before targeting weak internal high priced at 3,500.200.
Note:
With the Federal Reserve's dovish stance and persisting geopolitical uncertainties, heightened volatility in Gold is expected to continue. Traders should proceed with caution and adjust risk management strategies in this high-volatility environment.
Price could also be driven by President Trump's policies, geopolitical moves and economic decisions which are sparking uncertainty.
H4 Chart:
M15 Analysis:
-> Swing: Bullish.
-> Internal: Bearish.
Price has printed as per my analysis dated 24 April 2025 by targeting weak internal low and printing a bearish iBOS.
Price has subsequently printed a bullish CHoCH to indicate, but not confirm bullish pullback phase initiation.
Internal structure is now established, however, I will continue to monitor price regarding depth of pullback.
Intraday Expectation:
Price to trade up to either premium of internal 50% EQ, or M15 supply zone before targeting weak internal low priced at 3,221.320
Note:
With the Federal Reserve maintaining a dovish stance and ongoing geopolitical tensions, volatility in Gold prices is expected to remain elevated. Traders should exercise caution, adjust risk management strategies, and stay prepared for potential price whipsaws in this high-volatility environment.
Trump's tariff announcement will most likely cause considerably increased volatility and whipsaws.
M15 Chart:

Gold Trap Zones vs. Bounce Zones — Daily Flow Outlook April 30 Gold Battle Plan – Liquidity Games Reloaded 🎮💥
Gold’s Not Done — Next Move is Loading… You In? ⚔️🧨
No Guessing. No Praying. Just Precision – GoldMindsFX Flow 🔥✨
🧠 Macro & Market Context:
Gold continues to range between 3380–3260, with no clean breakout yet. Price action since yesterday has remained reactive and indecisive — still trapped inside the larger structure.
Today’s USD Events (High Impact):
🗣️ Trump Speech
🟦 ADP Non-Farm Employment
🟧 Advance GDP q/q
🟨 Employment Cost Index
🟧 Core PCE + Pending Home Sales
Expect volatility — especially NY session. Liquidity spikes likely.
🧭 Market Bias:
HTF Bias (Daily, H4): Still bullish overall as long as 3230–3240 is respected.
LTF Flow (M15–H1): Consolidation with small bullish attempts — structure still undecided.
📌 Key Structural Zones (Sniper Focus):
🔺 Sell Zones (Premium Supply)
3372–3376 → Trap Sell OB (M15–H1)
→ Price was previously rejected hard from here
3380–3390 → High-Volume Liquidity Pool
→ Major decision zone if price extends upside
🟩 Buy Zones (Discount Demand)
3284–3288 → Clean H1 Demand Reaction + Internal Liquidity
→ This zone triggered a 500+ pip rally this week
3233–3237 → Deep HTF OB + Untapped Liquidity
→ Must-hold level for HTF bullish bias to remain intact
👀 Eyes On Today:
3317–3325 → Micro structure to monitor. If bulls hold above this area, we may retest 3350–3372.
3284 → First bounce zone for reentry if NY dips.
Rejection below 3280 = eyes on 3233–3237.
🔥 Trading Focus Tip:
It’s a news-driven day. Your job isn’t to predict — it’s to wait, react, and strike with logic.
Snipers don’t rush. We let liquidity come to us.
💬 Final Note:
Goldie's still stuck in the cage — but today might be the breakout tease. Don’t chase, don’t guess — just watch the flow and let price tell you the truth. 🎯
Smart moves only. No fluff, just levels.
Let me know — are you watching the bounce or hunting the trap? Drop your zone bias 💬👇
📢 If this helped map your zones, hit that ❤️, smash follow, and drop your bias in the comments — are you stalking 3285 or sniping the 3370 trap? Let’s trade smart, not loud. 🚀💛
