Gold Analysis and Signals
Updated analysis of the beginning of the week in the form of micro-waves on the 4-hour time frame, important support/resistance areas and possible direction... Orders in the reward of R2 profit and risk-free with the price so that the highest possible reward can be obtained, of course, if there is no stop lol...
Goldusd

XAU/USD 19-23 May 2025 Weekly AnalysisWeekly Analysis:
Swing Structure -> Bullish.
Internal Structure -> Bullish.
Analysis and bias remains the same as analysis dated 16 March 2025.
In my analysis dated 27 October 2024 I mentioned (below) that price could potentially print higher-highs in order to reposition CHoCH. This is exactly how price printed. CHoCH positioning has been brought significantly closer to current price action. CHoCH positioning is denoted with a shortened blue dotted horizontal line.
The remainder of my analysis and bias remains the same as analysis dated 09 February 2025.
Price has printed a further bullish iBOS.
Price is currently trading within an internal low and fractal high. CHoCH positioning is denoted with a blue dashed line.
Price Action Analysis:
In my analysis dated 27 October 2024, it was noted that the first sign of a pullback would be a bearish Change of Character (CHoCH), indicated by a blue dotted line. Price's consistent upward momentum had repositioned previous CHoCH much closer to recent price levels as expected for weeks. Current CHoCH positioning is quite a distance away from price, therefore, it would be viable if price continued bullish to reposition ChOCH.
Note:
It is highly unlikely price will "crash" as many analysts are predicting. My view is this is merely a corrective wave of the primary trend.
Given the Federal Reserve's dovish policy stance alongside heightened geopolitical risks, market volatility is likely to remain elevated, influencing intraday price swings.
Price could also be driven by President Trump's policies, geopolitical moves and economic decisions which are sparking uncertainty and potential repricing of Gold.
Weekly Chart:
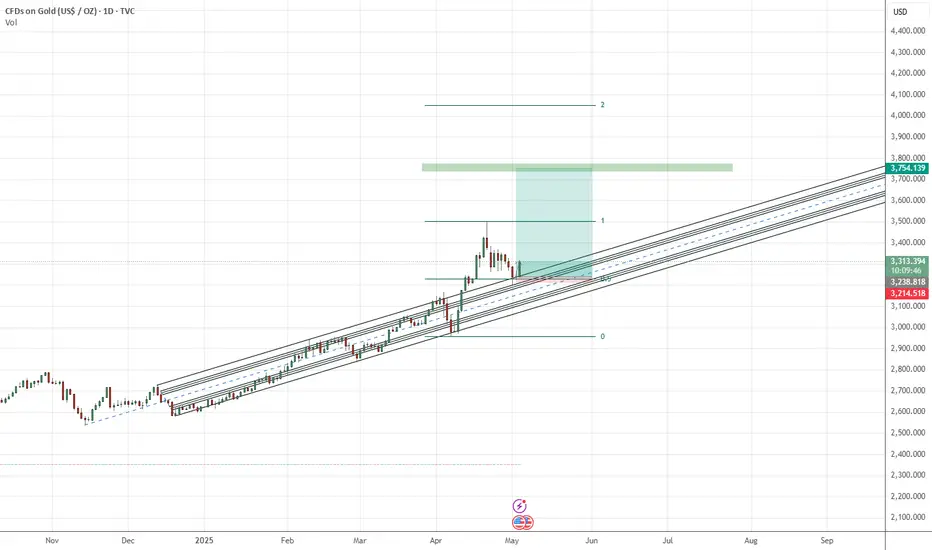
Daily Analysis:
Swing -> Bullish.
Internal -> Bullish.
Analysis and Bias remains the same as Analysis dated 11 May 2025.
Since my last weekly analysis price has finally printed a bearish CHoCH.
This is the first indication, but not confirmation of bearish pullback phase initiation.
Price is now trading within an established internal range.
Price should now technically trade down to either discount of 50% internal EQ, or Daily demand zone before targeting weak internal high, priced at 3,500.200.
Note:
The Federal Reserve’s continued dovish stance, coupled with escalating geopolitical uncertainties, is expected to sustain elevated market volatility, influencing both intraday and broader trend developments.
Additionally, price action may be further shaped by U.S. policy decisions, including measures enacted under President Trump. Shifts in geopolitical strategy and economic policymaking could introduce further uncertainty, contributing to the ongoing repricing dynamics within the gold market.
Daily Chart:
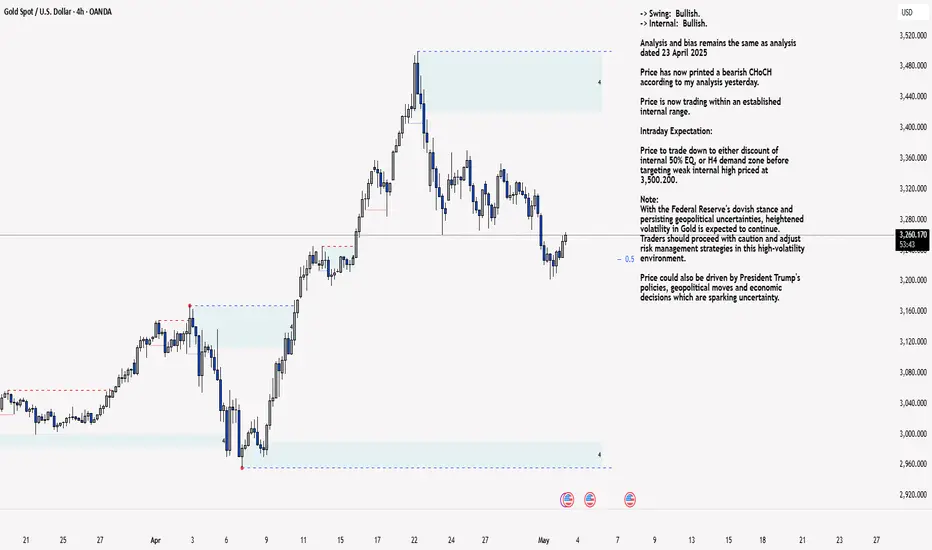
H4 Analysis:
-> Swing: Bullish.
-> Internal: Bullish.
Analysis and bias remains the same as analysis dated 23 April 2025
Price has now printed a bearish CHoCH according to my analysis yesterday.
Price is now trading within an established internal range.
Intraday Expectation:
Price to trade down to either discount of internal 50% EQ, or H4 demand zone before targeting weak internal high priced at 3,500.200.
Note:
The Federal Reserve’s sustained dovish stance, coupled with ongoing geopolitical uncertainties, is likely to prolong heightened volatility in the gold market. Given this elevated risk environment, traders should exercise caution and recalibrate risk management strategies to navigate potential price fluctuations effectively.
Additionally, gold pricing remains sensitive to broader macroeconomic developments, including policy decisions under President Trump. Shifts in geopolitical strategy and economic directives could further amplify uncertainty, contributing to market repricing dynamics.
H4 Chart:

XAU/USD 16 May 2025 Intraday AnalysisH4 Analysis:
-> Swing: Bullish.
-> Internal: Bullish.
Analysis and bias remains the same as analysis dated 23 April 2025
Price has now printed a bearish CHoCH according to my analysis yesterday.
Price is now trading within an established internal range.
Intraday Expectation:
Price to trade down to either discount of internal 50% EQ, or H4 demand zone before targeting weak internal high priced at 3,500.200.
Note:
The Federal Reserve’s sustained dovish stance, coupled with ongoing geopolitical uncertainties, is likely to prolong heightened volatility in the gold market. Given this elevated risk environment, traders should exercise caution and recalibrate risk management strategies to navigate potential price fluctuations effectively.
Additionally, gold pricing remains sensitive to broader macroeconomic developments, including policy decisions under President Trump. Shifts in geopolitical strategy and economic directives could further amplify uncertainty, contributing to market repricing dynamics.
H4 Chart:
M15 Analysis:
-> Swing: Bullish.
-> Internal: Bearish.
Analysis and bias remains the same as yesterday's analysis dated 15 May 2025.
In my analysis from 12 May 2025, I noted that price had yet to target the weak internal high, including on the H4 timeframe. This aligns with the ongoing corrective bearish pullback across higher timeframes, so a bearish internal Break of Structure (iBOS) was a likely outcome.
As anticipated, price targeted strong internal low, confirming a bearish iBOS.
While a bullish Change of Character (CHoCH) has printed, I am exercising discretion and not marking it as such, given the shallow nature of the pullback.
Additionally, another bullish CHoCH has printed, with price now trading within a defined internal range. I will continue monitoring this closely, particularly in relation to the depth of pullback.
Intraday Expectation:
Price to continue bullish, react at either premium of internal 50% EQ or M15 demand level before targeting weak internal low priced at 3,120.765
Note:
Gold remains highly volatile amid the Federal Reserve's continued dovish stance and persistent geopolitical uncertainties. Traders should implement robust risk management strategies and remain vigilant, as price swings may become more pronounced in this elevated volatility environment.
Additionally, President Trump’s recent tariff announcements are expected to further amplify market turbulence, potentially triggering sharp price fluctuations and whipsaws.
M15 Chart:

GOLD/USDit seems Gold is on the big resistant in monthly and i predict price dumping from now to 1700$ till 3 years later . Trump doing this . its time to Sell Gold and Buy BTC

GOLD - Bearish Double TOPHello Traders !
The GOLD failed to create a new higher high !
The price formed a double top pattern.
Currently, The neckline is broken !
So, I expect a bearish move📉
________________
TARGET: 3022🎯

XAU/USD 15 May 2025 Intraday AnalysisHi everyone, thanks for stopping by.
I’m Amin, a London-based technical analyst-in-training, currently preparing for the CMT Level I exam (June 2025) and building towards a career as a Market Strategist/Analyst.
I post daily/weekly analysis using Smart Money Concepts (SMC) soon to be blended with CMT-aligned tools like RSI, Moving Averages, trend structure, and market phase models.
My Goal: To secure a strategist or analyst role in London.
Recent highlight: One of my TradingView ideas was featured by an editor.
If you're in the industry, a fellow learner, or hiring, feel free to reach out — I’m open to opportunities and connections.
Let’s keep growing and learning!
Amin.
H4 Analysis:
-> Swing: Bullish.
-> Internal: Bullish.
Analysis and bias remains the same as analysis dated 23 April 2025
Price has now printed a bearish CHoCH according to my analysis yesterday.
Price is now trading within an established internal range.
Intraday Expectation:
Price to trade down to either discount of internal 50% EQ, or H4 demand zone before targeting weak internal high priced at 3,500.200.
Note:
The Federal Reserve’s sustained dovish stance, coupled with ongoing geopolitical uncertainties, is likely to prolong heightened volatility in the gold market. Given this elevated risk environment, traders should exercise caution and recalibrate risk management strategies to navigate potential price fluctuations effectively.
Additionally, gold pricing remains sensitive to broader macroeconomic developments, including policy decisions under President Trump. Shifts in geopolitical strategy and economic directives could further amplify uncertainty, contributing to market repricing dynamics.
H4 Chart:
M15 Analysis:
-> Swing: Bullish.
-> Internal: Bearish.
In my analysis from 12 May 2025, I noted that price had yet to target the weak internal high, including on the H4 timeframe. This aligns with the ongoing corrective bearish pullback across higher timeframes, so a bearish internal Break of Structure (iBOS) was a likely outcome.
As anticipated, price targeted strong internal low, confirming a bearish iBOS.
While a bullish Change of Character (CHoCH) has printed, I am exercising discretion and not marking it as such, given the shallow nature of the pullback.
Additionally, another bullish CHoCH has printed, with price now trading within a defined internal range. I will continue monitoring this closely, particularly in relation to the depth of pullback.
Intraday Expectation:
Price to continue bullish, react at either premium of internal 50% EQ or M15 demand level before targeting weak internal low priced at 3,120.765
Note:
Gold remains highly volatile amid the Federal Reserve's continued dovish stance and persistent geopolitical uncertainties. Traders should implement robust risk management strategies and remain vigilant, as price swings may become more pronounced in this elevated volatility environment.
Additionally, President Trump’s recent tariff announcements are expected to further amplify market turbulence, potentially triggering sharp price fluctuations and whipsaws.
M15 Chart:

XAU/USD 14 May 2025 Intraday AnalysisHi everyone — thanks for stopping by.
I’m Amin, a London-based technical analyst-in-training, currently preparing for the CMT Level I exam (June 2025) and building towards a career as a Market Strategist/Analyst.
I post daily/weekly analysis using Smart Money Concepts (SMC) soon to be blended with CMT-aligned tools like RSI, Moving Averages, trend structure, and market phase models.
My Goal: To secure a strategist or analyst role in London.
Recent highlight: One of my TradingView ideas was featured by an editor.
If you're in the industry, a fellow learner, or hiring, feel free to reach out — I’m open to opportunities and connections.
Let’s keep growing and learning!
Amin.
H4 Analysis:
-> Swing: Bullish.
-> Internal: Bullish.
Analysis and bias remains the same as analysis dated 23 April 2025
Price has now printed a bearish CHoCH according to my analysis yesterday.
Price is now trading within an established internal range.
Intraday Expectation:
Price to trade down to either discount of internal 50% EQ, or H4 demand zone before targeting weak internal high priced at 3,500.200.
Note:
The Federal Reserve’s sustained dovish stance, coupled with ongoing geopolitical uncertainties, is likely to prolong heightened volatility in the gold market. Given this elevated risk environment, traders should exercise caution and recalibrate risk management strategies to navigate potential price fluctuations effectively.
Additionally, gold pricing remains sensitive to broader macroeconomic developments, including policy decisions under President Trump. Shifts in geopolitical strategy and economic directives could further amplify uncertainty, contributing to market repricing dynamics.
H4 Chart:
M15 Analysis:
-> Swing: Bullish.
-> Internal: Bullish.
Analysis and bias remains remains the same as analysis dated 07 May 2025.
As mentioned in yesterday's analysis that I would continue to monitor price and depth of bearish pullback following previous bullish iBOS.
Price did not pull back with any significance, therefore, I will apply discretion and not mark the previous iBOS. I have however marked this in red.
Price continued bullish and subsequently printed a bearish iBOS to indicate, but not confirm bearish pullback phase initiation.
Price is now trading within an established internal range, however, I will continue to monitor depth of pullback.
Intraday Expectation:
Price to trade down to either discount of internal 50% EQ, or M15 supply zones before targeting weak internal high priced at 3,435.055
Note:
Gold remains highly volatile amid the Federal Reserve's continued dovish stance and persistent geopolitical uncertainties. Traders should implement robust risk management strategies and remain vigilant, as price swings may become more pronounced in this elevated volatility environment.
Additionally, President Trump’s recent tariff announcements are expected to further amplify market turbulence, potentially triggering sharp price fluctuations and whipsaws.
M15 Chart:

XAU/USD 13 May 2025 Intraday AnalysisH4 Analysis:
-> Swing: Bullish.
-> Internal: Bullish.
Analysis and bias remains the same as analysis dated 23 April 2025
Price has now printed a bearish CHoCH according to my analysis yesterday.
Price is now trading within an established internal range.
Intraday Expectation:
Price to trade down to either discount of internal 50% EQ, or H4 demand zone before targeting weak internal high priced at 3,500.200.
Note:
The Federal Reserve’s sustained dovish stance, coupled with ongoing geopolitical uncertainties, is likely to prolong heightened volatility in the gold market. Given this elevated risk environment, traders should exercise caution and recalibrate risk management strategies to navigate potential price fluctuations effectively.
Additionally, gold pricing remains sensitive to broader macroeconomic developments, including policy decisions under President Trump. Shifts in geopolitical strategy and economic directives could further amplify uncertainty, contributing to market repricing dynamics.
H4 Chart:
M15 Analysis:
-> Swing: Bullish.
-> Internal: Bullish.
Analysis and bias remains remains the same as analysis dated 07 May 2025.
As mentioned in yesterday's analysis that I would continue to monitor price and depth of bearish pullback following previous bullish iBOS.
Price did not pull back with any significance, therefore, I will apply discretion and not mark the previous iBOS. I have however marked this in red.
Price continued bullish and subsequently printed a bearish iBOS to indicate, but not confirm bearish pullback phase initiation.
Price is now trading within an established internal range, however, I will continue to monitor depth of pullback.
Intraday Expectation:
Price to trade down to either discount of internal 50% EQ, or M15 supply zones before targeting weak internal high priced at 3,435.055
Note:
With the Federal Reserve maintaining a dovish stance and ongoing geopolitical tensions, volatility in Gold prices is expected to remain elevated. Traders should exercise caution, adjust risk management strategies, and stay prepared for potential price whipsaws in this high-volatility environment.
Trump's tariff announcement will most likely cause considerably increased volatility and whipsaws.
M15 Chart:

XAU/USD 12 May 2025 Intraday AnalysisH4 Analysis:
-> Swing: Bullish.
-> Internal: Bullish.
Analysis and bias remains the same as analysis dated 23 April 2025
Price has now printed a bearish CHoCH according to my analysis yesterday.
Price is now trading within an established internal range.
Intraday Expectation:
Price to trade down to either discount of internal 50% EQ, or H4 demand zone before targeting weak internal high priced at 3,500.200.
Note:
With the Federal Reserve's dovish stance and persisting geopolitical uncertainties, heightened volatility in Gold is expected to continue. Traders should proceed with caution and adjust risk management strategies in this high-volatility environment.
Price could also be driven by President Trump's policies, geopolitical moves and economic decisions which are sparking uncertainty.
H4 Chart:
M15 Analysis:
-> Swing: Bullish.
-> Internal: Bullish.
As mentioned previously mentioned that I would continue to monitor price and depth of bearish pullback following previous bullish iBOS.
Price did not pull back with any significance, therefore, I will apply discretion and not mark the previous iBOS. I have however marked this in red.
Price continued bullish and subsequently printed a bearish iBOS to indicate, but not confirm bearish pullback phase initiation.
Price is now trading within an established internal range, however, I will continue to monitor depth of pullback.
Intraday Expectation:
Price to trade down to either discount of internal 50% EQ, or M15 supply zones before targeting weak internal high priced at 3,435.055.
Alternative scenario:
Price has this far failed to target to target weak internal high, as has H4 TF. This could be related to the fact that all higher timeframes remain in corrective bearish pullback phase initiation, therefore, it should not come as a surprise if price prints a bearish iBOS.
Note:
Gold price volatility is expected to remain heightened due to the Federal Reserve’s dovish approach and persistent geopolitical uncertainties. Traders should remain vigilant, fine-tune their risk management strategies, and be prepared for potential price fluctuations in this highly volatile market. Additionally, recent tariff announcements by former President Trump are likely to exacerbate market instability, leading to further price swings.
M15 Chart:

XAU/USD 12-16 May 2025 Weekly AnalysisWeekly Analysis:
Swing Structure -> Bullish.
Internal Structure -> Bullish.
Analysis and bias remains the same as analysis dated 16 March 2025.
In my analysis dated 27 October 2024 I mentioned (below) that price could potentially print higher-highs in order to reposition CHoCH. This is exactly how price printed. CHoCH positioning has been brought significantly closer to current price action. CHoCH positioning is denoted with a shortened blue dotted horizontal line.
The remainder of my analysis and bias remains the same as analysis dated 09 February 2025.
Price has printed a further bullish iBOS.
Price is currently trading within an internal low and fractal high. CHoCH positioning is denoted with a blue dashed line.
Price Action Analysis:
In my analysis dated 27 October 2024, it was noted that the first sign of a pullback would be a bearish Change of Character (CHoCH), indicated by a blue dotted line. Price's consistent upward momentum had repositioned previous CHoCH much closer to recent price levels as expected for weeks. Current CHoCH positioning is quite a distance away from price, therefore, it would be viable if price continued bullish to reposition ChOCH.
Note:
It is highly unlikely price will "crash" as many analysts are predicting. My view is this is merely a corrective wave of the primary trend.
Given the Federal Reserve's dovish policy stance alongside heightened geopolitical risks, market volatility is likely to remain elevated, influencing intraday price swings.
Price could also be driven by President Trump's policies, geopolitical moves and economic decisions which are sparking uncertainty and potential repricing of Gold.
Weekly Chart:
Daily Analysis:
Swing -> Bullish.
Internal -> Bullish.
Since my last weekly analysis price has finally printed a bearish CHoCH.
This is the first indication, but not confirmation of bearish pullback phase initiation.
Price is now trading within an established internal range.
Price should now technically trade down to either discount of 50% internal EQ, or Daily demand zone before targeting weak internal high, priced at 3,500.200.
Note:
The Federal Reserve’s continued dovish stance, coupled with escalating geopolitical uncertainties, is expected to sustain elevated market volatility, influencing both intraday and broader trend developments.
Additionally, price action may be further shaped by U.S. policy decisions, including measures enacted under President Trump. Shifts in geopolitical strategy and economic policymaking could introduce further uncertainty, contributing to the ongoing repricing dynamics within the gold market.
Daily Chart:
H4 Analysis:
-> Swing: Bullish.
-> Internal: Bullish.
Analysis and bias remains the same as analysis dated 23 April 2025
Price has now printed a bearish CHoCH according to my analysis yesterday.
Price is now trading within an established internal range.
Intraday Expectation:
Price to trade down to either discount of internal 50% EQ, or H4 demand zone before targeting weak internal high priced at 3,500.200.
Note:
The Federal Reserve’s sustained dovish stance, coupled with ongoing geopolitical uncertainties, is likely to prolong heightened volatility in the gold market. Given this elevated risk environment, traders should exercise caution and recalibrate risk management strategies to navigate potential price fluctuations effectively.
Additionally, gold pricing remains sensitive to broader macroeconomic developments, including policy decisions under President Trump. Shifts in geopolitical strategy and economic directives could further amplify uncertainty, contributing to market repricing dynamics.
H4 Chart:


XAU/USD 09 May 2025 Intraday AnalysisH4 Analysis:
-> Swing: Bullish.
-> Internal: Bullish.
Analysis and bias remains the same as analysis dated 23 April 2025
Price has now printed a bearish CHoCH according to my analysis yesterday.
Price is now trading within an established internal range.
Intraday Expectation:
Price to trade down to either discount of internal 50% EQ, or H4 demand zone before targeting weak internal high priced at 3,500.200.
Note:
With the Federal Reserve's dovish stance and persisting geopolitical uncertainties, heightened volatility in Gold is expected to continue. Traders should proceed with caution and adjust risk management strategies in this high-volatility environment.
Price could also be driven by President Trump's policies, geopolitical moves and economic decisions which are sparking uncertainty.
H4 Chart:
M15 Analysis:
-> Swing: Bullish.
-> Internal: Bullish.
Analysis and bias remains remains the same as analysis dated 07 May 2025.
As mentioned in yesterday's analysis that I would continue to monitor price and depth of bearish pullback following previous bullish iBOS.
Price did not pull back with any significance, therefore, I will apply discretion and not mark the previous iBOS. I have however marked this in red.
Price continued bullish and subsequently printed a bearish iBOS to indicate, but not confirm bearish pullback phase initiation.
Price is now trading within an established internal range, however, I will continue to monitor depth of pullback.
Intraday Expectation:
Price to trade down to either discount of internal 50% EQ, or M15 supply zones before targeting weak internal high priced at 3,435.055
Note:
With the Federal Reserve maintaining a dovish stance and ongoing geopolitical tensions, volatility in Gold prices is expected to remain elevated. Traders should exercise caution, adjust risk management strategies, and stay prepared for potential price whipsaws in this high-volatility environment.
Trump's tariff announcement will most likely cause considerably increased volatility and whipsaws.
M15 Chart:

XAU/USD 08 May 2025 Intraday AnalysisH4 Analysis:
-> Swing: Bullish.
-> Internal: Bullish.
Analysis and bias remains the same as analysis dated 23 April 2025
Price has now printed a bearish CHoCH according to my analysis yesterday.
Price is now trading within an established internal range.
Intraday Expectation:
Price to trade down to either discount of internal 50% EQ, or H4 demand zone before targeting weak internal high priced at 3,500.200.
Note:
With the Federal Reserve's dovish stance and persisting geopolitical uncertainties, heightened volatility in Gold is expected to continue. Traders should proceed with caution and adjust risk management strategies in this high-volatility environment.
Price could also be driven by President Trump's policies, geopolitical moves and economic decisions which are sparking uncertainty.
H4 Chart:
M15 Analysis:
-> Swing: Bullish.
-> Internal: Bullish.
analysis and bias remains remains the same as yesterday's analysis dated 07 May 2025.
As mentioned in yesterday's analysis that I would continue to monitor price and depth of bearish pullback following previous bullish iBOS.
Price did not pull back with any significance, therefore, I will apply discretion and not mark the previous iBOS. I have however marked this in red.
Price continued bullish and subsequently printed a bearish iBOS to indicate, but not confirm bearish pullback phase initiation.
Price is now trading within an established internal range, however, I will continue to monitor depth of pullback.
Intraday Expectation:
Price to trade down to either discount of internal 50% EQ, or M15 supply zones before targeting weak internal high priced at 3,435.055
Note:
With the Federal Reserve maintaining a dovish stance and ongoing geopolitical tensions, volatility in Gold prices is expected to remain elevated. Traders should exercise caution, adjust risk management strategies, and stay prepared for potential price whipsaws in this high-volatility environment.
Trump's tariff announcement will most likely cause considerably increased volatility and whipsaws.
M15 Chart:

XAU/USD 07 May 2025 Intraday AnalysisH4 Analysis:
-> Swing: Bullish.
-> Internal: Bullish.
Analysis and bias remains the same as analysis dated 23 April 2025
Price has now printed a bearish CHoCH according to my analysis yesterday.
Price is now trading within an established internal range.
Intraday Expectation:
Price to trade down to either discount of internal 50% EQ, or H4 demand zone before targeting weak internal high priced at 3,500.200.
Note:
With the Federal Reserve's dovish stance and persisting geopolitical uncertainties, heightened volatility in Gold is expected to continue. Traders should proceed with caution and adjust risk management strategies in this high-volatility environment.
Price could also be driven by President Trump's policies, geopolitical moves and economic decisions which are sparking uncertainty.
H4 Chart:
M15 Analysis:
-> Swing: Bullish.
-> Internal: Bullish.
As mentioned in yesterday's analysis that I would continue to monitor price and depth of bearish pullback following previous bullish iBOS.
Price did not pull back with any significance, therefore, I will apply discretion and not mark the previous iBOS. I have however marked this in red.
Price continued bullish and subsequently printed a bearish iBOS to indicate, but not confirm bearish pullback phase initiation.
Price is now trading within an established internal range, however, I will continue to monitor depth of pullback.
Intraday Expectation:
Price to trade down to either discount of internal 50% EQ, or M15 supply zones before targeting weak internal high priced at 3,435.055
Note:
With the Federal Reserve maintaining a dovish stance and ongoing geopolitical tensions, volatility in Gold prices is expected to remain elevated. Traders should exercise caution, adjust risk management strategies, and stay prepared for potential price whipsaws in this high-volatility environment.
Trump's tariff announcement will most likely cause considerably increased volatility and whipsaws.
M15 Chart:

XAU/USD 06 May 2025 Intraday AnalysisH4 Analysis:
-> Swing: Bullish.
-> Internal: Bullish.
Analysis and bias remains the same as analysis dated 23 April 2025
Price has now printed a bearish CHoCH according to my analysis yesterday.
Price is now trading within an established internal range.
Intraday Expectation:
Price to trade down to either discount of internal 50% EQ, or H4 demand zone before targeting weak internal high priced at 3,500.200.
Note:
With the Federal Reserve's dovish stance and persisting geopolitical uncertainties, heightened volatility in Gold is expected to continue. Traders should proceed with caution and adjust risk management strategies in this high-volatility environment.
Price could also be driven by President Trump's policies, geopolitical moves and economic decisions which are sparking uncertainty.
H4 Chart:
M15 Analysis:
-> Swing: Bullish.
-> Internal: Bearish.
Price did not print according to previous analysis by failing to target weak internal low.
Price has now printed a bullish iBOS. This is potentially due to the fact that H4 TF was in a bearish pullback phase and reacted at discount of 50% internal EQ which could mean that H4 TF bearish pullback phase is now over and targeting the weak internal high, which is mentioned in H4 analysis.
Price has also printed a bearish CHoCH which indicates, but not confirms bearish pullback phase initiation.
Price is now trading within an established internal range, however, I will continue to monitor depth of pullback.
Intraday Expectation:
Price to trade down to either discount of internal 50% EQ, or M15 supply zones before targeting weak internal high priced at
Note:
With the Federal Reserve maintaining a dovish stance and ongoing geopolitical tensions, volatility in Gold prices is expected to remain elevated. Traders should exercise caution, adjust risk management strategies, and stay prepared for potential price whipsaws in this high-volatility environment.
Trump's tariff announcement will most likely cause considerably increased volatility and whipsaws.
M15 Chart:

GOLD - NEW BREAKOUT !Hello Traders !
The Gold price failed to create a new lower low.
The Last lower high is broken (change of character).
So, I expect a bullish move🚀
______________
TARGET: 3340.000🎯

Dollar Decline Against All Major CurrenciesThe Dollar’s decline didn’t start with the recent ‘Liberation Day’ tariffs. In fact, it has been gradually weakening since the 1970s.
More recently, however, the Dollar has lost value against many currencies since January. Why is that?
Why have the USD/CHF and USD/SGD strengthened against the US Dollar over the past few decades? One reason is that both countries have managed their money supply with discipline. For example, as of end-2024, Switzerland’s net federal debt stood at 141 billion Swiss franc, their debt to GDP ratio at 17.2%.
In contrast, the United States has expanded its national debt at an alarming rate. Some might point out that Japan’s debt-to-GDP ratio is even higher—around 230%. That is why the Japanese Yen has also been in decline for decades.
Why does printing more money through QE and increasing the money supply weaken a currency?
Just imagine in a close economy with 10 people and 1 central bank. If the central bank printed $100 and distributed equally to the 10, each of them will receive $10 to buy 10 available cheesecakes.
But now the central bank decided to print $1,000 and each person will have $100 to buy 10 available cheesecakes.
The global economy is not a close, but an open system.
When the US and other major economies printed massive amounts of money, they didn’t just inflate their own economies—they exported inflation worldwide. This contributes to rising cost of living not all around the world.
In my view, Gold is also a currency pair against the US at the start of 1971. The moment dollar unpeg itself from gold, gold appreciates. With each QE, we can see how the currencies have diluted with gold and inflation appreciating over these years.
Why different currencies have started to appreciate against the USD since January this year?
We can see all the currencies have either reached its bottomed in January and started moving higher or it formed a reversal pattern like the Aussie dollar and the Dollar Yuan, in this case with this inverted hammer, it is indicating Dollar Yuan to reverse downward, meaning dollar coming off and yuan to appreciate.
January was President Trump inauguration and February was when he rolled out tariffs against Canada, Mexico and China, and the market do not like that and has been selling the USD against the rest of the currencies?
If US has printed the so much money, but why other than Swiss franc and Singapore Dollar, many other currencies have been depreciating against dollars over the past decades?
I’d like to hear your thoughts on this.
Euro FX Futures & Options
Ticker: 6E
Minimum fluctuation:
0.000050 per Euro increment = $6.25
Disclaimer:
• What presented here is not a recommendation, please consult your licensed broker.
• Our mission is to create lateral thinking skills for every investor and trader, knowing when to take a calculated risk with market uncertainty and a bolder risk when opportunity arises.
CME Real-time Market Data help identify trading set-ups in real-time and express my market views. If you have futures in your trading portfolio, you can check out on CME Group data plans available that suit your trading needs www.tradingview.com
Trading the Micro: www.cmegroup.com

XAU/USD 02 May 2025 Intraday AnalysisH4 Analysis:
-> Swing: Bullish.
-> Internal: Bullish.
Analysis and bias remains the same as analysis dated 23 April 2025
Price has now printed a bearish CHoCH according to my analysis yesterday.
Price is now trading within an established internal range.
Intraday Expectation:
Price to trade down to either discount of internal 50% EQ, or H4 demand zone before targeting weak internal high priced at 3,500.200.
Note:
With the Federal Reserve's dovish stance and persisting geopolitical uncertainties, heightened volatility in Gold is expected to continue. Traders should proceed with caution and adjust risk management strategies in this high-volatility environment.
Price could also be driven by President Trump's policies, geopolitical moves and economic decisions which are sparking uncertainty.
H4 Chart:
M15 Analysis:
-> Swing: Bullish.
-> Internal: Bearish.
As mentioned in yesterday's analysis dated 01 May 2025 whereby I mentioned that I would continue to monitor price and depth of bullish pullback following the printing of a bearish iBOS followed by a bullish CHoCH.
Price did not pullback significantly enough to warrant a further bearish iBOS, therefore, I will apply discretion and not classify this as such, I have however marked in red.
Price has since continued bearish, subsequently printing a bullish CHoCH.
Internal structure is now established, however, I will continue to monitor price regarding depth of pullback as previous.
Intraday Expectation:
Price to trade up to either premium of internal 50% EQ, or M15 supply zone before targeting weak internal low priced at 3,201.955
Note:
With the Federal Reserve maintaining a dovish stance and ongoing geopolitical tensions, volatility in Gold prices is expected to remain elevated. Traders should exercise caution, adjust risk management strategies, and stay prepared for potential price whipsaws in this high-volatility environment.
Trump's tariff announcement will most likely cause considerably increased volatility and whipsaws.
M15 Chart:
XAU/USD 01 May 2025 Intraday AnalysisH4 Analysis:
-> Swing: Bullish.
-> Internal: Bullish.
Analysis and bias remains the same as analysis dated 23 April 2025
Price has now printed a bearish CHoCH according to my analysis yesterday.
Price is now trading within an established internal range.
Intraday Expectation:
Price to trade down to either discount of internal 50% EQ, or H4 demand zone before targeting weak internal high priced at 3,500.200.
Note:
With the Federal Reserve's dovish stance and persisting geopolitical uncertainties, heightened volatility in Gold is expected to continue. Traders should proceed with caution and adjust risk management strategies in this high-volatility environment.
Price could also be driven by President Trump's policies, geopolitical moves and economic decisions which are sparking uncertainty.
H4 Chart:
M15 Analysis:
-> Swing: Bullish.
-> Internal: Bearish.
Price has printed as per my analysis dated 24 April 2025 by targeting weak internal low and printing a bearish iBOS.
Price has subsequently printed a bullish CHoCH to indicate, but not confirm bullish pullback phase initiation.
Internal structure is now established, however, I will continue to monitor price regarding depth of pullback.
Intraday Expectation:
Price to trade up to either premium of internal 50% EQ, or M15 supply zone before targeting weak internal low priced at 3,221.320
Note:
With the Federal Reserve maintaining a dovish stance and ongoing geopolitical tensions, volatility in Gold prices is expected to remain elevated. Traders should exercise caution, adjust risk management strategies, and stay prepared for potential price whipsaws in this high-volatility environment.
Trump's tariff announcement will most likely cause considerably increased volatility and whipsaws.
M15 Chart:

XAU/USD 30 April 2025 Intraday AnalysisH4 Analysis:
-> Swing: Bullish.
-> Internal: Bullish.
Analysis and bias remains the same as analysis dated 23 April 2025
Price has now printed a bearish CHoCH according to my analysis yesterday.
Price is now trading within an established internal range.
Intraday Expectation:
Price to trade down to either discount of internal 50% EQ, or H4 demand zone before targeting weak internal high priced at 3,500.200.
Note:
With the Federal Reserve's dovish stance and persisting geopolitical uncertainties, heightened volatility in Gold is expected to continue. Traders should proceed with caution and adjust risk management strategies in this high-volatility environment.
Price could also be driven by President Trump's policies, geopolitical moves and economic decisions which are sparking uncertainty.
H4 Chart:
M15 Analysis:
-> Swing: Bullish.
-> Internal: Bearish.
Analysis and Bias remains the same as analysis dated 24 April 2025.
Price printed as per my note yesterday whereby I mentioned that we should be surprised if price printed a bearish iBOS as all HTF's require a pullback.
Price subsequently printed a bearish iBOS which confirms internal structure.
Intraday Expectation:
Price has traded up to just short of premium of internal 50% EQ where we are seeing a reaction. Price could potentially trade further into premium of 50%, or H4/M15 nested supply zone before targeting weak internal low priced at 3,260.190.
Note:
With the Federal Reserve maintaining a dovish stance and ongoing geopolitical tensions, volatility in Gold prices is expected to remain elevated. Traders should exercise caution, adjust risk management strategies, and stay prepared for potential price whipsaws in this high-volatility environment.
Trump's tariff announcement will most likely cause considerably increased volatility and whipsaws.
M15 Chart:

Doubletop suppressionVS multi-bottom support Entry at key pointsGold rose sharply in the U.S. market yesterday, and the daily line finally closed the Yang cross star, approaching the end of the monthly line. Recently, it has been a yin-yang cycle sweep pattern. Therefore, today we need to be careful to prevent the market from falling back and then closing in the negative range. The wide sweeping range remains at 3370-3270. If the position is broken, look at the unilateral direction. In the 4H cycle, the continuous positive pattern breaks through the mid-track, and the short-term trend is stronger. , but Bollinger has not opened his mouth, and is not optimistic about the breakthrough range. The short-term support is around 3315, which is also yesterday's low point. If it falls below, it will go to 3302. Therefore, today's operation will continue to grasp the key positions. The upper pressure will focus on 3354 and 3370, and the lower support will focus on 3315 and 3300. Go high and low in the range! Do high-altitude and low-multiple in the range!
Operation suggestion: Buy gold near 3305-3300, look at 3320 and 3345!

XAU/USD 28 April - 02 May 2025 Weekly AnalysisWeekly Analysis:
Swing Structure -> Bullish.
Internal Structure -> Bullish.
Analysis and bias remains the same as analysis dated 16 March 2025.
In my analysis dated 27 October 2024 I mentioned (below) that price could potentially print higher-highs in order to reposition CHoCH. This is exactly how price printed. CHoCH positioning has been brought significantly closer to current price action. CHoCH positioning is denoted with a shortened blue dotted horizontal line.
The remainder of my analysis and bias remains the same as analysis dated 09 February 2025.
Price has printed a further bullish iBOS.
Price is currently trading within an internal low and fractal high. CHoCH positioning is denoted with a blue dashed line.
Price Action Analysis:
In my analysis dated 27 October 2024, it was noted that the first sign of a pullback would be a bearish Change of Character (CHoCH), indicated by a blue dotted line. Price's consistent upward momentum had repositioned previous CHoCH much closer to recent price levels as expected for weeks. Current CHoCH positioning is quite a distance away from price, therefore, it would be viable if price continued bullish to reposition ChOCH.
Note:
It is highly unlikely price will "crash" as many analysts are predicting. My view is this is merely a corrective wave of the primary trend.
Given the Federal Reserve's dovish policy stance alongside heightened geopolitical risks, market volatility is likely to remain elevated, influencing intraday price swings.
Price could also be driven by President Trump's policies, geopolitical moves and economic decisions which are sparking uncertainty and potential repricing of Gold.
Weekly Chart:
Daily Analysis:
Swing -> Bullish.
Internal -> Bullish.
Since my last weekly analysis price has printed a
further bullish iBOS.
Price is now trading within an internal low and fractal high.
CHoCH positioning is denoted with a shortened blue horizontal dotted line.
First indication, but not confirmation of bearish pullback phase initiation is for price to print bearish CHoCH.
Note:
With the Fed maintaining a dovish policy stance and the continued rise in geopolitical tensions, we should anticipate elevated market volatility, which may impact both intraday and longer-term price action.
Price could also be driven by President Trump's policies, geopolitical moves and economic decisions which are sparking uncertainty and the repricing of Gold.
Daily Chart:
H4 Analysis:
-> Swing: Bullish.
-> Internal: Bullish.
Analysis and bias remains the same as analysis dated 23 April 2025
Price has now printed a bearish CHoCH according to my analysis yesterday.
Price is now trading within an established internal range.
Intraday Expectation:
Price to trade down to either discount of internal 50% EQ, or H4 demand zone before targeting weak internal high priced at 3,500.200.
Note:
With the Federal Reserve's dovish stance and persisting geopolitical uncertainties, heightened volatility in Gold is expected to continue. Traders should proceed with caution and adjust risk management strategies in this high-volatility environment.
Price could also be driven by President Trump's policies, geopolitical moves and economic decisions which are sparking uncertainty.
H4 Chart:
