XAUUSD , we encounter to the trendlineHello everyone
According to the the chart and the time , if the candle stick is closing to complete the candle stick pattern and cannot go up to the trendline you can take short position, BE AWARE .
if you have any question and need help send us messages
Thank you
AA
Goldusd

XAU/USD 24-28 March 2025 Weekly AnalysisWeekly Analysis:
Swing Structure -> Bullish.
Internal Structure -> Bullish.
Analysis and bias remains the same as analysis dated 16 March 2025.
In my analysis dated 27 October 2024 I mentioned (below) that price could potentially print higher in order to reposition CHoCH. This is exactly how price printed. CHoCH positioning has been brought significantly closer to current price action.
The remainder of my analysis and bias remains the same as analysis dated 09 February 2025.
Price has printed a further bullish iBOS.
Price is currently trading within an internal low and fractal high. CHoCH positioning is denoted with a blue dashed line.
Price Action Analysis:
In my analysis dated 27 October 2024, it was noted that the first sign of a pullback would be a bearish Change of Character (CHoCH), indicated by a blue dotted line. Price's consistent upward momentum had repositioned previous CHoCH much closer to recent price levels as expected for weeks. Current CHoCH positioning is quite a distance away from price, therefore, it would be viable if price continued bullish to reposition CHOCH.
Note:
It is highly unlikely price will "crash" as many analysts are predicting. My view is this is merely a corrective wave of the primary trend.
Given the Federal Reserve's dovish policy stance alongside heightened geopolitical risks, market volatility is likely to remain elevated, influencing intraday price swings.
Price could also be driven by President Trump's policies, geopolitical moves and economic decisions which are sparking uncertainty.
Weekly Chart:
Daily Analysis:
Swing -> Bullish.
Internal -> Bullish.
Price continued bullish repositioning bearish CHoCH positioning closer to current price action.
Price is now trading within an internal low and fractal high.
Expectation is for price to print bearish CHoCH to indicate, but not confirm bearish pullback phase initiation. CHoCH positioning is denoted with a blue dotted line.
Note:
With the Fed maintaining a dovish policy stance and the continued rise in geopolitical tensions, we should anticipate elevated market volatility, which may impact both intraday and longer-term price action.
Price could also be driven by President Trump's policies, geopolitical moves and economic decisions which are sparking uncertainty and the repricing of Gold.
Daily Chart:
H4 Analysis:
-> Swing: Bullish.
-> Internal: Bullish.
Analysis and bias remains the same as analysis dated 21 March 2025.
Price has printed a bearish CHoCH following printing further all time highs.
Price is now trading within an established internal range. I will however continue to monitor price.
Intraday Expectation:
Price to trade down to either discount of internal 50% EQ, or nested Daily and H4 demand levels before targeting weak internal high priced at 3,057.590.
Note:
With the Federal Reserve's dovish stance and persisting geopolitical uncertainties, heightened volatility in Gold is expected to continue. Traders should proceed with caution and adjust risk management strategies in this high-volatility environment.
Price could also be driven by President Trump's policies, geopolitical moves and economic decisions which are sparking uncertainty.
H4 Chart:

Gold Falls from Peak, but Rate Cut Hopes Keep Outlook Positive● Gold prices fell after hitting a high at $3057.59 due to a stronger US dollar, making it more expensive for overseas buyers.
● Despite this, gold is set for its third consecutive weekly gain, up 0.7% this week.
● Market participants expect at least two US Federal Reserve rate cuts this year, supporting gold's long-term bullish outlook.
◉ Technical Observations
● While moving through the rising parallel channel, the price has just faced resistance from the upper boundary and is expected to have a pullback towards $2,950.
● If the price slips below this level, the next strong support is expected near $2,790.

XAU/USD 13 March 2025 Intraday AnalysisH4 Analysis:
-> Swing: Bullish.
-> Internal: Bearish.
Analysis/Bias remains the same as analysis dated 07 March 2024.
Price has printed a bullish CHoCH according to analysis and bias dated 28 February 2025.
Price is currently trading within an established internal range.
Intraday Expectation:
Price is now trading in premium of 50% internal EQ where we could see a reaction at any point. Price could also target H4 supply zone before targeting weak internal low, priced at 2,832.720
Note:
With the Federal Reserve's dovish stance and persisting geopolitical uncertainties, heightened volatility in Gold is expected to continue. Traders should proceed with caution and adjust risk management strategies in this high-volatility environment.
Price could also be driven by President Trump's policies, geopolitical moves and economic decisions which are sparking uncertainty.
H4 Chart:
M15 Analysis:
-> Swing: Bullish.
-> Internal: Bullish.
Analysis and bias has not been met, largely due macroeconomic events, particularly the Trump trade tariff war, which is causing uncertainty within the markets which is supporting Gold price.
Price has printed a bullish iBOS.
Within the structure following the iBOS, price has printed a several bearish CHoCH's with very minimal pullbacks before continuing bullish.
In order not to distort internal structure range I will apply discretion and not classify bearish CHoCH without considerable pullback.
Intraday Expectation:
Await for price to print Bearish CHoCH which is supported by a pullback relative to recent price action.
Note:
With the Federal Reserve maintaining a dovish stance and ongoing geopolitical tensions, volatility in Gold prices is expected to remain elevated. Traders should exercise caution, adjust risk management strategies, and stay prepared for potential price whipsaws in this high-volatility environment.
M15 Chart:

Gold Prices Rise as Inflation Fears Subside◉ Fundamental Rationale
● Gold prices remain steady despite a strong US dollar, supported by a softer-than-expected US CPI report.
● The US CPI report showed a 0.4% rise, lower than the forecasted 0.5%, easing inflation concerns.
● Weaker US inflation data reduces the likelihood of a rate hike, making gold more attractive to investors.
● The strong US dollar, fueled by a surge in US Treasury yields, failed to dent gold's appeal.
● Prices are expected to remain supported as investors seek safe-haven assets amid economic uncertainty.
◉ Technical Observations
● Gold prices have broken free from a Symmetrical Triangle pattern and surged upward.
● Currently trading near all-time highs, the rally is expected to continue, propelling prices beyond the previous high.

Big drop coming for Gold ?There will be a possible drop to the 2870 level first where it will consolidate for a while before starting the big drop to 2600 area.

XAU/USD 07 March 2025 Intraday AnalysisH4 Analysis:
-> Swing: Bullish.
-> Internal: Bearish.
Price has printed a bullish CHoCH according to analysis and bias dated 28 February 2025.
Price is currently trading within an established internal range.
Intraday Expectation:
Price is now trading in premium of 50% internal EQ where we could see a reaction at any point. Price could also target H4 supply zone before targeting weak internal low, priced at 2,832.720
Note:
With the Federal Reserve's dovish stance and persisting geopolitical uncertainties, heightened volatility in Gold is expected to continue. Traders should proceed with caution and adjust risk management strategies in this high-volatility environment.
Price could also be driven by President Trump's policies, geopolitical moves and economic decisions which are sparking uncertainty.
H4 Chart:
M15 Analysis:
-> Swing: Bullish.
-> Internal: Bearish.
Analysis and bias remains the same as analysis dated 03 March 2023.
As mentioned in my analysis dated 28 February 2025, whereby price printed a bullish CHoCH but stated I would continue to monitor price.
On this occasion I have marked the previous bullish CHoCH in red as price did not pull back deeply enough to warrant internal structure breaks, additionally, there was minimal time spent.
Price has printed a further bullish CHoCH which is now confirmed. Price is not trading within an established internal range.
Intraday Expectation:
Price to continue bullish, react at either premium of internal 50% EQ, or M15 supply zone before targeting weak internal low priced at 2,832.720.
Note:
With the Federal Reserve maintaining a dovish stance and ongoing geopolitical tensions, volatility in Gold prices is expected to remain elevated. Traders should exercise caution, adjust risk management strategies, and stay prepared for potential price whipsaws in this high-volatility environment.
M15 Chart:

Gold bullish to 2950 ?Gold is at the support of the channel
I expect a bullish move to 2950
Stop loss: 2895

Gold, An upward movement incoming ?Hello traders, I hope you are great. our latest analysis on Gold hit all its targets and we gained a profit of around 800 pips; but what's next ? Will the price continue its downward correction or not ? Let's clarify things a bit to make decision making easier for ourselves:
With the delayed possibility of a ceasefire in the war between Ukraine and Russia, as well as existing tensions between the USA and other countries, the likelihood of a continued correction in gold has diminished at least in the short term.
We should also keep in mind that there is a possibility of renewed conflict between Hamas and Israel in the upcoming Days.
If we have consider these factors together, it seems to me there is at least a chance of another upward movement in Gold. Targets have determined by Blue dashed lines.
And finally Tell me What are your thoughts about GOLD ? UP or DOWN ? comment your opinion below this post.

XAU/USD 04 March 2025 Intraday AnalysisH4 Analysis:
-> Swing: Bullish.
-> Internal: Bearish.
Price has printed a bullish CHoCH according to analysis and bias dated 28 February 2025.
Price is currently trading within an established internal range.
Intraday Expectation:
Price is now trading in premium of 50% internal EQ where we could see a reaction at any point. Price could also target H4 supply zone before targeting weak internal low, priced at 2,832.720
Note:
With the Federal Reserve's dovish stance and persisting geopolitical uncertainties, heightened volatility in Gold is expected to continue. Traders should proceed with caution and adjust risk management strategies in this high-volatility environment.
Price could also be driven by President Trump's policies, geopolitical moves and economic decisions which are sparking uncertainty.
H4 Chart:
M15 Analysis:
-> Swing: Bullish.
-> Internal: Bearish.
Analysis and bias remains the same as analysis dated 03 March 2023.
As mentioned in my analysis dated 28 February 2025, whereby price printed a bullish CHoCH but stated I would continue to monitor price.
On this occasion I have marked the previous bullish CHoCH in red as price did not pull back deeply enough to warrant internal structure breaks, additionally, there was minimal time spent .
Price has printed a further bullish CHoCH which is now confirmed. Price is not trading within an established internal range.
Intraday Expectation:
Price to continue bullish, react at either premium of internal 50% EQ, or M15 supply zone before targeting weak internal low priced at 2,832.720.
Note:
With the Federal Reserve maintaining a dovish stance and ongoing geopolitical tensions, volatility in Gold prices is expected to remain elevated. Traders should exercise caution, adjust risk management strategies, and stay prepared for potential price whipsaws in this high-volatility environment.
M15 Chart:

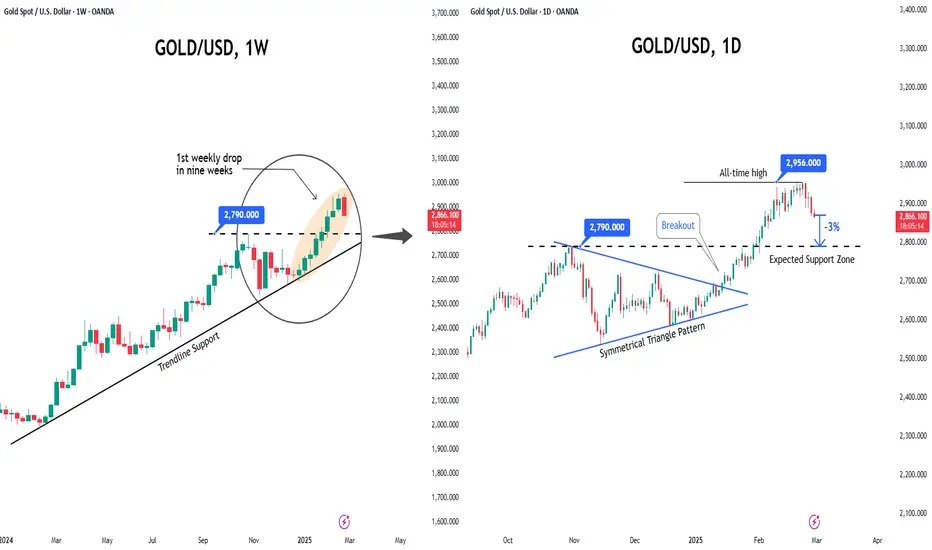
Gold Prices Take a Breather: First Weekly Decline in Nine Weeks◉ Overview
● Gold prices have risen for eight consecutive weeks, driven by safe-haven demand and a weaker US dollar.
● However, with US inflation data scheduled for release, investors are becoming cautious, leading to a decline in gold prices.
● The US inflation data will provide insight into the Federal Reserve's future monetary policy decisions.
◉ Technical Observations
● After hitting an all-time high near $2,956, the prices are now declining.
● In the weekly chart, a Bearish Engulfing candlestick pattern could be observed, indicating negative market sentiments.
● A support level is expected at $2,790, which is nearly 3% below the current market price.
Gold (XAU/USD) – Bullish Breakout Ahead? 🔍 Technical Breakdown:
Gold has respected the key demand zone at 2,911 – 2,916, forming a strong base for a potential bullish continuation.
The recent correction followed a complex wave pattern, completing an ABCDE structure before bouncing.
The price is now moving towards the 161.8% Fibonacci extension at 2,992, a key upside target.
📊 Momentum Indicators:
The Stochastic Oscillator is recovering from lower levels, signaling renewed bullish momentum.
A break above recent highs could accelerate upside movement toward the psychological $3,000 mark.
🔥 Trading Outlook:
Bullish Bias: As long as Gold holds above 2,911, the upside structure remains intact.
Upside Target: 2,992 – 3,000 based on Fibonacci confluence.
Invalidation: A sustained break below 2,911 could shift momentum bearish.
📢 Are You Bullish on Gold? Comment below & hit Boost if you’re riding this move! 🚀✨
🔔 Follow for More Precision Trading Insights!

Gold Short Daily Chart on strong resistanceGold Short Daily Chart on strong resistance, price after ab=cd=cd + fibo e level and BB and more tools

Gold/USD Monthly Elliott Wave & Fibonacci ProjectionsPEPPERSTONE:XAUUSD
This analysis presents a detailed Elliott Wave count on the monthly chart of Gold/USD with Fibonacci extension levels for key price targets.
Wave Structure:
The chart follows a classical 5-wave impulse structure (I to V).
Wave V is currently forming with possible subwave developments marked (1, 2, 3, 4, 5).
Fibonacci Key Levels:
100% ($2,529) — initial projection target
127.2% ($2,778) — intermediate resistance
161.8% ($3,095) — dominant bullish extension target
261.8% ($3,019) — extended bullish zone
Potential Price Movement:
A correction near $2,550 aligns with the Fibonacci 161.8% retracement, followed by a rally to complete wave V.
Long-term resistance and liquidity zones highlighted around $3,095.
Use this projection for long-term trading strategies. Fibonacci and wave alignments may guide stop-loss placements or profit-taking points. Keep an eye on corrections near wave 4 zones for confirmation before further bullish continuation
Disclaimer:
This analysis is for informational and educational purposes only. It does not constitute financial advice, investment recommendations, or a solicitation to trade any securities or assets. Trading in financial markets involves substantial risk and may not be suitable for all investors. Past performance is not indicative of future results. Always conduct your own research and consult with a certified financial advisor before making trading decisions.

XAU/USD 29 January 2025 Intraday AnalysisH4 Analysis:
-> Swing: Bearish.
-> Internal: Bullish.
Analysis/bias remains the same as yesterday's analysis dated 27/01/2025
Price has now printed a bearish CHoCH according to analysis dated 21 January 2025.
Price is now trading within an established internal range.
Intraday Expectation:
Price to trade continue bearish to complete it's pullback phase. Technically price should trade down to either discount of internal 50% EQ or M15 demand zone before targeting weak internal high priced at 2,786.060.
It would be useful to remember that Daily TF swing and internal range are bullish.
Note:
With the Federal Reserve's dovish stance and persisting geopolitical uncertainties, heightened volatility in Gold is expected to continue. Traders should proceed with caution and adjust risk management strategies in this high-volatility environment.
H4 Chart:
M15 Analysis:
-> Swing: Bearish.
-> Internal: Bearish.
Analysis/Bias remains the same as yesterday's analysis dated 28 January 2025.
As mentioned in yesterday's analysis and alternative scenario that as H4 timeframe has printed a bearish CHoCH, it would come at no surprise if price printed a bearish iBOS to assist H4 TF in it's pullback phase.
This is how price printed. Strong internal low was targeted with price printing a bearish iBOS.
Price has subsequently printed a bullish CHoCH to indicate, but not confirm bullish pullback phase initiation.
Price is now trading within an established internal range.
Intraday Expectation:
Price to continue bullish, show reaction at either premium of 50% EQ, or M15/H4 supply zone before targeting weak internal low priced at 2,730.560.
Note:
With the Federal Reserve maintaining a dovish stance and ongoing geopolitical tensions, volatility in Gold prices is expected to remain elevated. Traders should exercise caution, adjust risk management strategies, and stay prepared for potential price whipsaws in this high-volatility environment.
M15 Chart:

GOLD IS GOING BULLISH ALLOW IT TO TOUCH LINE 2719.730✅Smart Money Concept
Gold price (XAU/USD) reached a fresh one-month high during Thursday’s Asian session but struggled to sustain momentum above the $2,700 mark. Diminished worries over U.S. President-elect Donald Trump's proposed trade tariffs and the anticipation of two potential Federal Reserve rate cuts this year have fueled positive market sentiment. However, a slight uptick in the U.S. Dollar (USD) has constrained further gains for the safe-haven asset.
SET UP GOLD PRICE:
BUY GOLD zone: $2678.479 - $2673.696 SL $2668.682
TP1: $2684.471
TP2: $2690.235
TP3: $2696.253
SELL GOLD zone: $2719.730 - $2723.622 SL $2729.470
TP1: $2713.175
TP2: $2706.151
TP3: $2699.870
Note:
FrankFx advises traders to manage their capital wisely:
- Adjust the number of lots to match your capital.
- Set Take Profit at 3-6% of your account balance.
- Set Stop Loss at 2-3% of your account balance.

XAU/USD 14 January 2025 Intraday AnalysisH4 Analysis:
-> Swing: Bearish.
-> Internal: Bullish.
Analysis/Intraday expectation remains the same as analysis dated 16 December 2024.
Price is clearly unable to target weak internal. This is due to the fact that Daily and Weekly Timeframe remain in bearish pullback phase.
Price Action Analysis:
Technically price is to target weak internal priced at 2,721.420. Price has sweeped liquidity,
for two possible reasons.
1. To assist price to complete bearish pullback phase, react at either discount of internal 50% or H4 demand zone before targeting weak internal high.
2. To assist Daily and H4 TF's to complete bearish pullback phase with price to print a bearish iBOS and target strong internal low priced at 2,536.855.
Intraday Expectation:
Intraday expectation and alternative scenario as per points 1 and 2.
Note:
With the Federal Reserve's dovish stance and persisting geopolitical uncertainties, heightened volatility in Gold is expected to continue. Traders should proceed with caution and adjust risk management strategies in this high-volatility environment.
H4 Chart:
M15 Analysis:
-> Swing: Bearish.
-> Internal: Bearish.
Price Action Analysis:
Yesterday's Intraday expectation was not met with price failing to target weak internal high, printing a bearish iBOS. Internal structure has now aligned itself with swing structure.
This could potentially be an early indication that both Daily and H4 pullback phases are incomplete. It would also be useful to remember that Weekly TF remains in its bearish pullback phase.
Price subsequently printed a bullish CHoCH thereby confirming internal range and indication of bullish pullback phase initiation.
Intraday Expectation:
Price has yet to trade in to premium of internal 50% EQ or M15 supply zone. Expectation is for price to target weak internal low, priced at 2,656.880.
Note:
With the Federal Reserve maintaining a dovish stance and ongoing geopolitical tensions, volatility in Gold prices is expected to remain elevated. Traders should exercise caution, adjust risk management strategies, and stay prepared for potential price whipsaws in this high-volatility environment.
M15 Chart:

XAU/USD 10 December 2025 Intraday AnalysisH4 Analysis:
-> Swing: Bearish.
-> Internal: Bullish.
Analysis/Intraday expectation remains the same as analysis dated 16 December 2024.
Price is clearly unable to target weak internal. This is due to the fact that Daily and Weekly Timeframe remain in bearish pullback phase.
Price Action Analysis:
Technically price is to target weak internal priced at 2,721.420. Price has sweeped liquidity,
for two possible reasons.
1. To assist price to complete bearish pullback phase, react at either discount of internal 50% or H4 demand zone before targeting weak internal high.
2. To assist Daily and H4 TF's to complete bearish pullback phase with price to print a bearish iBOS and target strong internal low priced at 2,536.855.
Intraday Expectation:
Intraday expectation and alternative scenario as per points 1 and 2.
Note:
With the Federal Reserve's dovish stance and persisting geopolitical uncertainties, heightened volatility in Gold is expected to continue. Traders should proceed with caution and adjust risk management strategies in this high-volatility environment.
H4 Chart:
M15 Analysis:
-> Swing: Bearish.
-> Internal: Bullish.
Price Action Analysis:
Yesterday's intraday expectation was met with price successfully targeting weak internal high priced at 2,667.150.
Price has yet to print a bearish CHoCH to indicate, but not confirm bearish pullback phase initiation. Bearish CHoCH positioning is denoted with a blue dotted line.
We are currently trading within an internal low and fractal high.
Price has traded in to discount of internal 50% EQ.
Intraday Expectation:
Price to indicate bearish pullback phase initiation by printing a bearish CHoCH. Technically price to then trade down to discount of internal 50% EQ, or M15 demand zone before targeting weak internal high.
Note:
With the Federal Reserve maintaining a dovish stance and ongoing geopolitical tensions, volatility in Gold prices is expected to remain elevated. Traders should exercise caution, adjust risk management strategies, and stay prepared for potential price whipsaws in this high-volatility environment.
M15 Chart:

XAUUSD IS READY TO FLYING MUST READ THE CAPTION This chart displays an hourly analysis of Gold (XAU/USD) with a potential bullish setup. Here's a breakdown:
1. Trend and Price Channel:
A rising parallel channel is drawn, suggesting a short-term uptrend.
The price has respected the channel boundaries, bouncing off the lower and upper limits.
2. Key Levels:
Support: Around 2,635 (stop-loss level).
Resistance: Around 2,680-2,685 (target area).
3. Trade Idea:
The chart indicates a buy setup:
Entry: Around the current price (2,653).
Stop Loss: Below the channel at 2,635, providing a buffer against downside risk.
Target: 2,680-2,685, just above the channel's upper resistance.
4. Projection:
The white arrows suggest a predicted price movement:
A potential retracement before moving higher to the target zone (2,680-2,685).
5. Risk-Reward:
The setup offers a favorable risk-reward ratio if the price continues to follow the channel's trajectory.
Analysis: The chart anticipates a continuation of the uptrend as long as the price remains within the channel. If the price breaks below 2,635, it may invalidate the bullish outlook.

GOLD BUY | Idea Trading AnalysisGOLD is moving in an UP trend channel and is creating symmetrical triangle and is moving in a descending AND is moving in an Ascending channel.
We expect a decline in the channel after testing the current level.
The chart broke through the dynamic Resistance area, which now acts as support.
We expect a decline in the channel after testing the current level which suggests that the price will continue to rise
Hello Traders, here is the full analysis.
I think we can soon see more fall from this range! GOOD LUCK! Great BUY opportunity GOLD
I still did my best and this is the most likely count for me at the moment.
-------------------
Traders, if you liked this idea or if you have your own opinion about it, write in the comments. I will be glad

XAUUSD Forecast: The Bulls Are Gaining Momentum!
We're seeing some impressive price action on XAUUSD! 📈 The market is currently respecting a strong 4H trendline, showcasing the power of the ongoing bullish momentum. The technicals are aligning, and the market seems poised to continue its upward push.
Keep an eye on this setup—it’s looking like an excellent opportunity for those riding the trend! Don't miss the chance to capitalize on the next move. 💰

XAU/USD 20 December 2024 Intraday AnalysisH4 Analysis:
-> Swing: Bearish.
-> Internal: Bullish.
FINAL ANALYSIS OF 2024! WISHING YOU ALL VERY HAPPY FESTIVITES. MAY 2025 AND OWNARDS BRING YOU ALL SUCCESS!!
ANALYSIS WILL RESUME SECOND WEEK OF 2025 (DATE TO BE CONFIRMED)
Analysis/Intraday expectation remains the same as analysis dated 16 December 2024.
Price is clearly unable to target weak internal. This is due to the fact that Daily and Weekly Timeframe remain in bearish pullback phase.
Price Action Analysis:
Technically price is to target weak internal priced at 2,721.420. Price has sweeped liquidity,
for two possible reasons.
1. To assist price to complete bearish pullback phase, react at either discount of internal 50% or H4 demand zone before targeting weak internal high.
2. To assist Daily and H4 TF's to complete bearish pullback phase with price to print a bearish iBOS and target strong internal low priced at 2,536.855.
Intraday Expectation:
Intraday expectation and alternative scenario as per points 1 and 2.
Note:
With the Federal Reserve's dovish stance and persisting geopolitical uncertainties, heightened volatility in Gold is expected to continue. Traders should proceed with caution and adjust risk management strategies in this high-volatility environment.
H4 Chart:
M15 Analysis:
-> Swing: Bearish.
-> Internal: Bearish.
FINAL ANALYSIS OF 2024! WISHING YOU ALL VERY HAPPY FESTIVITES. MAY 2025 AND OWNARDS BRING YOU ALL SUCCESS!!
ANALYSIS WILL RESUME SECOND WEEK OF 2025 (DATE TO BE CONFIRMED)
Analysis/bias remains the same as yesterday's analysis dated 19 December 2024.
Price Action Analysis:
Yesterday's analysis played out as expected with price targeting weak internal low, printing a bearish iBOS.
Price has printed a bullish CHoCH, indicating, but not confirming bullish pullback phase initiation. We are now trading within an established internal range.
Intraday Expectation:
Price is currently trading at premium of internal 50% EQ where we could see a reaction. Price could potentially trade up to M15 supply level before targeting weak internal low priced at 2,583.915
Note:
With the Federal Reserve maintaining a dovish stance and ongoing geopolitical tensions, volatility in Gold prices is expected to remain elevated. Traders should exercise caution, adjust risk management strategies, and stay prepared for potential price whipsaws in this high-volatility environment.
M15 Chart:

GOLD BUY | Idea Trading AnalysisGOLD is creating symmetrical triangle and is moving in a descending AND is moving in an UPWARD channel.
We expect a decline in the channel after testing the current level.
Hello Traders, here is the full analysis.
I think we can soon see more fall from this range! GOOD LUCK! Great BUY opportunity GOLD
I still did my best and this is the most likely count for me at the moment.
-------------------
Traders, if you liked this idea or if you have your own opinion about it, write in the comments. I will be glad
