DOT Stoch RSI cross on Weekly (happens once or twice in a year)There is a very bullish setup occurring in DOT atm with the Stoch RSI crossing into bull momentum for the first time since July 2021... these weekly crosses don't happen often in a year.
Knowing that alt-season is likely about to progress and develop at a much quicker pace as it usually does in Q1-Q2 of any given bull year, DOT is probably one of the most undervalued pickups here since they have already fully launched Parachains. Expect more bullishness as projects continue to develop and as DOT ramps up transaction speeds. If you needed any clue on how fast DOT is even at these very early stages, it sends pretty much instantaneously already... much faster than about a year ago when I tested the speeds. They are capping the speed for now but soon we will see scaling as Dr. Wood and the dev team become more confident in their interoperability. KSM will do well too but DOT is severely undervalued here compared to larger cap coins. DOT could very well be $150-200B market cap by Feb/March 2022.
Google (Alphabet)

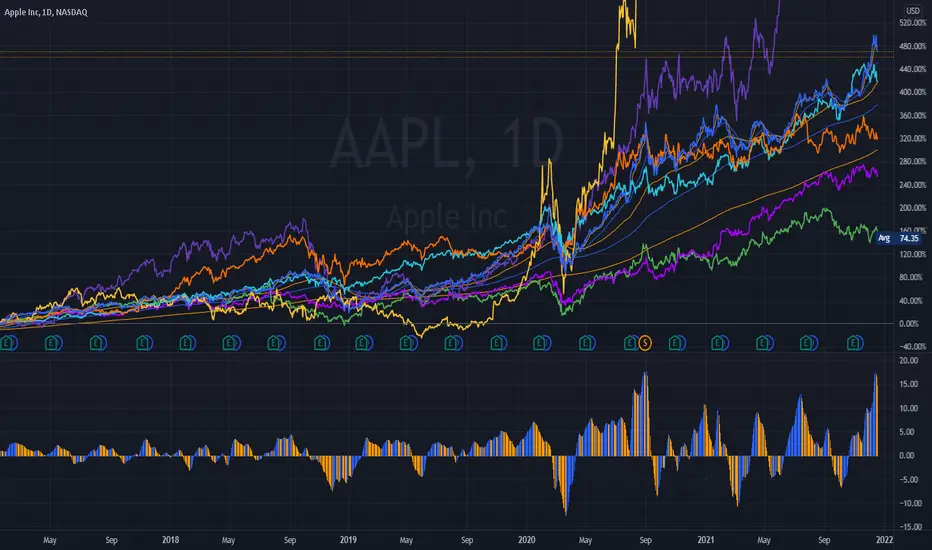
711 - Desperados: Momentum/Trend Cloud @ 7 - 12% correction to well over 23% on Trend... extremes.
Notice how Momentum has fallen below Trend.
A Picture of health or dysfunction.
IV
AAPL @ 61%
TSLA @ 63%
NVDA @ 77%
AMD @ 88%
and Beacon of Safety PFE @ 85%
Baba is now 90%
Pfizer is extreme as is Baba.
These are all later stage readings for Implied VX.
_____________________________________________________
All signs of a Shorter Term process of carving out a High prior
to the Ice Bucket challenge from the Federal Reserve.

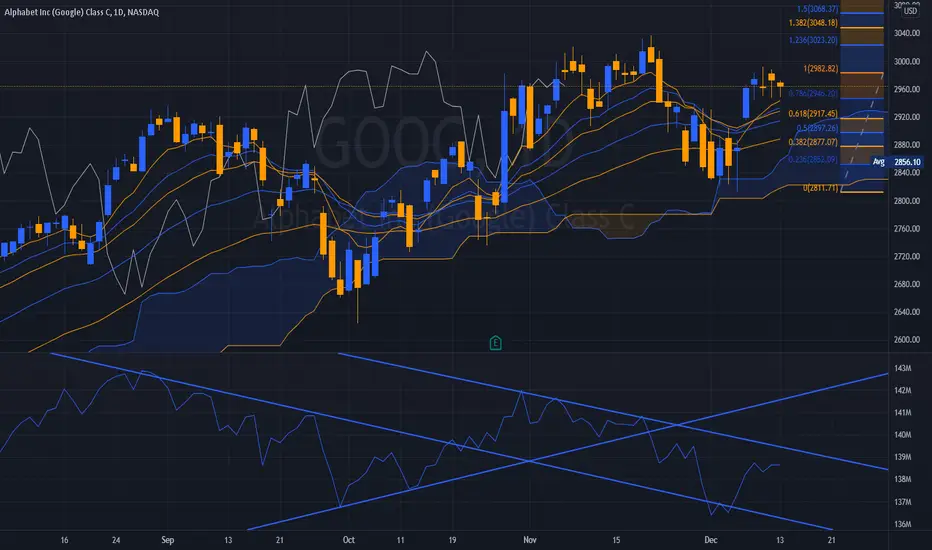
Still in the neutral zone!Google has made a flat bottom triangle!
Fluctuating between 2800-3040 is the most probable situation for the next few weeks!
You can see the most important support (green lines) and resistance (red lines) to watch in the coming days in these charts!
Enjoy the holiday season,
Moshkelgosha
DISCLAIMER
I’m not a certified financial planner/advisor, a certified financial analyst, an economist, a CPA , an accountant, or a lawyer. I’m not a finance professional through formal education. The contents on this site are for informational purposes only and do not constitute financial, accounting, or legal advice. I can’t promise that the information shared on my posts is appropriate for you or anyone else. By using this site, you agree to hold me harmless from any ramifications, financial or otherwise, that occur to you as a result of acting on information found on this site.

Google stock price will jump ? Or downward correction?Google's stock price rebounded near the downtrend line and began to consolidate.
I think there is a high probability that it will breakout the downward trend.

7/11Uber Eats...
Distro Patterns remain into Year End.
AAPL
AMZN
MSFT
NVDA
GOOG
GOOGL
FB
And the SMH
Very Red this AM
GOOG - Cloud TapDipped into Momentum, but holding Trending Cloud.
Alphabet Soup trade for now...
Waiting on the break for the Pelican.
Gamma @ present undecided Probability.
Best to keep an eye on GOOGA & GOOGL Calls.
NQ - MSFT GOOG APPL TSLA NVDA57.41% of NQ's gains during 2021
- a result from 5 companies.
Keep it simple - the Big 7, in
excess of 63%
While the Median Equities collapse
by 50 - 60% / the "7" rampage the NQ
Landscape.
________________________________
During the late stages of the Roaring 20's
RCA was bought up from $1.50 to $549.
1925 to 1929.
$547.50 in appreciation. the largest holders
were the wealthiest people.
They were looking for suckers then as now.
_________________________________
There is truly nothing new under the Sun.
New paradigms, Metaverse... blah blah blah.
No there is not, there is a Fully formed Technocracy
seeking to wreck everything.
They tried in the 1920s, the Technocracy Movement,
simply lacked the tools of controlling the chattel.
join the Cult of Inequity or perish?
Choice / Consequence.
__________________________________
Enjoy the rest of your Saturday.

Weekly charts peovide important information!In these charts, you see weekly candlestick patterns are Identical for the 7 biggest tech companies:
AAPL, MSFT, GOOG, AMZN, TSLA, FB, and NVDA have made a bearish candlestick pattern last week.
MSFT, GOOG, AMZN, and TSLA made Bearish engulfing pattern or Brarish outside bar! after a bullish rally in the past 6-8 weeks!
S&P 500 and NASDAQ 100 also made the same pattern:
Short interest for these tickers is between 0.55-1% except for TSLA which is 2.56% and AMD 6.25%.
And, Put/Call Open Interest for the next 30 days is between 0.74 to 1.8, which is relatively high for these tickers..!
Having said that,
In December 2021, the stock market will face challenges such as Omicron, Fiscal year budget, Debt Ceiling, and Quadruple witching!
I am confident that we are going to see a very volatile December and possibly a correction!
You can see the most important support (green lines) and resistance (red lines) to watch in the coming days in these charts!
Best,
Moshkelgosha
DISCLAIMER
I’m not a certified financial planner/advisor, a certified financial analyst, an economist, a CPA, an accountant, or a lawyer. I’m not a finance professional through formal education. The contents on this site are for informational purposes only and do not constitute financial, accounting, or legal advice. I can’t promise that the information shared on my posts is appropriate for you or anyone else. By using this site, you agree to hold me harmless from any ramifications, financial or otherwise, that occur to you as a result of acting on information found on this site.

My Apple analysis is failed, but...Before this trading week, I published my target price analysis for AAPL, MSFT, GOOG, AMZN, TSLA, FB, NVDA, AMD, LCID, and the major indexes!
I was bearish on all of them..!
While my apple analysis failed, others became right! and the statistics show 1 in 12, which is 91.5% correctness!
I know people tend to lean toward those who are writing about "Going to Moon", but I do not like Deception!
Best,
Moshkelgosha
DISCLAIMER
I’m not a certified financial planner/advisor, a certified financial analyst, an economist, a CPA, an accountant, or a lawyer. I’m not a finance professional through formal education. The contents on this site are for informational purposes only and do not constitute financial, accounting, or legal advice. I can’t promise that the information shared on my posts is appropriate for you or anyone else. By using this site, you agree to hold me harmless from any ramifications, financial or otherwise, that occur to you as a result of acting on information found on this site.

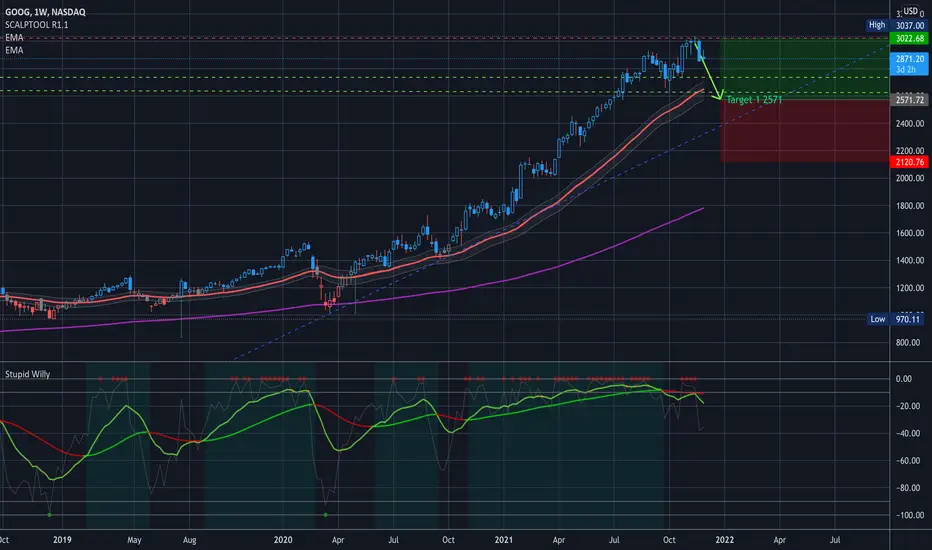
$GOOG Still on track for 2571 $GOOG Still on track for 2571
——————
I am not your financial advisor, but I will happily answer questions and analyze to the best of my ability but ultimately the risk is on you. Check out my ideas, but also do your own due diligence.
I am not a bull. I am not a bear. I just see what I see in the charts and I don’t pay too much attention to the noise in the news.
Very often you have to look at my charts from the perspective of where I’m looking to sell puts. But I also do open positions still once in a while.
If you want me to analyze any stock or ETF just leave me a comment and I’ll do it if I can.
Have fun, y’all!!
(\_/)
( •_•)
/ >🚀
GOOG - STOCKS - 18. OCT. 2021Welcome to our Weekly V2-Trade Setup ( GOOG ) !
-
4 HOUR
Great technical structure..
DAILY
Expecting more bullish price action.
WEEKLY
Market still underpriced!
-
STOCK SETUP
BUY GOOG
ENTRY LEVEL @ 2840.56
SL @ 2724.25
TP @ Open
Max Risk: 0.5% - 1%!
(Remember to add a few pips to all levels - different Brokers!)
Leave us a comment or like to keep our content for free and alive.
Have a great week everyone!
ALAN

Google possible price target for the coming week!GOOG could move toward 2750 once again and this means put options have high return potentials this week!
Important price patterns in the Multi-Timeframe Analysis:
You can see the most important support (green lines) and resistance (red lines) to watch in the coming days in these charts!
Best,
Moshkelgosha
DISCLAIMER
I’m not a certified financial planner/advisor, a certified financial analyst, an economist, a CPA, an accountant, or a lawyer. I’m not a finance professional through formal education. The contents on this site are for informational purposes only and do not constitute financial, accounting, or legal advice. I can’t promise that the information shared on my posts is appropriate for you or anyone else. By using this site, you agree to hold me harmless from any ramifications, financial or otherwise, that occur to you as a result of acting on information found on this site

This is not a good sign!looking at the charts, most big techs have long upper shadows or a long red candle! Apple is an exception!
Today smaller tech companies are hammered so hard which is not a good sign as well!
Taking profit or raising stop loss could be a good strategy!

WATCHING $GOOG Key levels & AnalysisWATCHING $GOOG Key levels & Analysis
Watching for 2571
——————
I am not your financial advisor, but I will happily answer questions and analyze to the best of my ability but ultimately the risk is on you. Check out my ideas, but also do your own due diligence.
If you want me to analyze any stock or ETF just leave me a comment and I’ll do it if I can.
Have fun, y’all!!
(\_/)
( •_•)
/ >🚀

GOOGL, still another 30% to be had!GOOGL is a mature stock and tends to be very respectful of fibs, previously it was able to run up to the 5.618 fib of the 2009 crash (pretty much to the dollar) prior to the COVID crash. Assuming a similar outcome GOOGL still has room to run up to $3937 before a correction back to its current levels around the 3.618 fib.

Sign of weakness and correction!You can see the most important support (green lines) and resistance (red lines) to watch in the coming days in these charts!
They all have 1 thing in common, price advanced at a lower volume in the past week (except AMZN), while this pattern of behavior could last for a while, in most cases, it leads to a correction!
Tesla also suffers from the same problem!
Best,
Moshkelgosha
DISCLAIMER
I’m not a certified financial planner/a certified financial analyst, an economist, a CPA, an accountant, or a lawyer. I’m not a finance professional through formal education. The contents on this site are for informational purposes only and do not constitute financial, accounting, or legal advice. I can’t promise that the information shared on my posts is appropriate for you or anyone else. By using this site, you agree to hold me harmless from any ramifications, financial or otherwise, that occur to you as a result of acting on information found on this site.

Google Bullflag to the upsideGoogle has been severely underperforming compared to the rest of the qqq. If we can see strength within facebook and xlc tomorrow along with google and the rest of the market, i believe this flag to break to the upside. 3000+ can be seen end of week Imo.


10/31/21 GOOGLAlphabet Inc (Google) Class A ( NASDAQ:GOOGL )
Sector: Technology Services (Internet Software/Services)
Current Price: $2960.92
Breakout price trigger: $2925.00 (hold above)
Buy Zone (Top/Bottom Range): $2900.00-$2815.00
Price Target: $3100.00-$3122.00 (1st), $3390.00-$3425.00 (2nd)
Estimated Duration to Target: 10-11d (1st), 32-35d (2nd)
Contract of Interest: $GOOGL 11/12/21 3000c, $GOOGL 12/17/21 3200c
Trade price as of publish date: $33.50/contract, $24.90/contract

fang breaking trend??fang have been in a ascending wedge, now looking to break it, now with earning season i see no crazy perspective to accomplish it's 161%fib objective

GOOG - The HillsSpencer and Heidi are back at it.
Spencer - Putting on some Puts:
2,850.00 @ 1,249
2,800.00 @ 1,775
Heidi - Spreading Calls
The better 1/2 of the Duo
has bought Calls, in large Q's
to 3.000.
______________________________________________________
Someone is going to lose Biggly this week.

FXCM FAANG Basket Moves Into Bullish Stack On the DailyThe above chart show's the daily time frame of FXCM's FAANG Basket. We are using a triple EMA system to assess trend. The short-term green EMA > intermediate orange EMA and the intermediate orange EMA> the slow red EMA (blue rectangle). We note that NFLX reported last week and that the rest of the FAANGs (FB, AAPL, AMZN, GOOG) will report this week. Following their respective releases we will assess the basket's EMAs and their angle and separation. If these develop, it will be regarded as bullish, suggesting that a possible bullish momentum push may be underway.

GOOG sold by ARK InvestOn October 20, ARKQ, part of the Ark invest fund lead be Cathie Wood sold 1,858 shares of GOOG, for a total value of 0.2031 of its portfolio.
Most of the time, when Ark starts a sell, it tends to continue it for multiple days.
Was this the top for Alphabet?
My price target is the 2700usd support.
I`m looking forward to read your opinion about it.
