Google - Tech - 10 Year NoteVolatility in the notes (10Y @ 1.66) showed-up as a pause day for growth tech. With earnings one week away, a melt-up would benefit from resistance in the bonds.
Google (Alphabet)

Higher volatility expected in the coming days!A good analyst always has at least 2 scenarios..!
A temporary pullback or a reversal?
The answer to this question is waiting for the coming days!
What is a Pullback?
A pullback is a pause or moderate drop in a stock or commodities pricing chart from recent peaks that occur within a continuing uptrend. A pullback is very similar to retracement or consolidation, and the terms are sometimes used interchangeably. The term pullback is usually applied to pricing drops that are relatively short in duration - for example, a few consecutive sessions - before the uptrend resumes.
A pullback is a temporary reversal in the price action of an asset or security.
The duration of a pullback is usually only a few consecutive sessions. A longer pause before the uptrend resumes is generally referred to as consolidation.
Pullbacks can provide an entry point for traders looking to enter a position when other technical indicators remain bullish.
What Is an Outside Reversal?
An outside reversal is a price pattern that indicates a potential change in trend on a price chart. The two-day pattern is observed when a security’s high and low prices for the day exceed the high and low of the previous day’s trading session. Outside reversal is also known as either a bullish engulfing (after a downward price move) or a bearish engulfing pattern (after an upward price move) when observed on candlestick charts.
Outside reversal is a two-day price pattern that implies a reversal if it runs counter to the existing trend.
The first day is typically a small range day and the second is a larger range day.
This pattern is known as an engulfing pattern in candlestick studies.
A bearish outside reversal also called a bearish engulfing, transpires when the second candle is moved lower. For instance, a stock may have a small move higher on the first day, climb even higher the second day, but then sharply decline by the second day’s end. This demonstrates that the bulls had control over the market before the bears took the reins in a meaningful way, signaling a shift in the overall trend.
Reference Article:
www.investopedia.com
www.investopedia.com

These 10 stocks just cleared the cloud out of 100+ stockswww.tradingview.com
This is the Watch List for all 10.
They all have cleared the cloud and closed Green. Some have the potential to dip to find support. However , some like this one MP looks ready from right here. All have Green Clouds that are moving up. Some however have some deep slopes of previous Red Clouds that they just worked there way through. I marked every stock on where I found it crossing out of the cloud. This way we can track its movements from the point of interest to better tailor what to expect once it pops the cloud.
AMZN
GOOG
NFLX
COST
BBY
SPOT
MP
OCGN
XPOA
TWTR


Google - Inverse ConfirmedFound resistance above the .236 Break Target. Setting up a Doji above support as the market takes a moment to regroup.
*Correction" Earnings for Google is Tuesday October 26th.

GOOG - Neckline Back TestGOOG found support at the pattern break level and held stable after yesterday's push-up.


Google - DailyIf the 61.8% retracement holds up at the support, a good chance that this will continue upwards.
Will be watching this stock in case this does hold.
We have an interesting week next week for fundamentals / news.

GOOGLE - Monthly ChartEngulfing candle on the previous close, any significance will be confirmed on the weekly.

A weak recovery..!In the past 3 days, we see higher closes in the market and most tickers have finished the past 3 days greenish!
But looking at volume and compare it to the past week's average clearly shows the weakness on the buyer's side!
More neutral days could be the most probable scenario in the coming days!
AAPL, MSFT, GOOG, AMZN, and FB have seen higher prices at lower volumes..! which is not a bullish sign!
Waiting for better entries could be a good choice!
DISCLAIMER
I’m not a certified financial planner/advisor nor a certified financial analyst nor an economist nor a CPA nor an accountant nor a lawyer. I’m not a finance professional through formal education. The contents on this site are for informational purposes only and do not constitute financial, accounting, or legal advice. I can’t promise that the information shared on my posts is appropriate for you or anyone else. By using this site, you agree to hold me harmless from any ramifications, financial or otherwise, that occur to you as a result of acting on information found on this site.

Google, 7 OCT - Elliott waves | Gann | Astrology $GOOGAlphabet, as expected, bounced off the 20 week MA (in red), and we closed longs at Gann level 2651. But the count hints at more downside in the mid-term.
Since the ATH, price declined in ABC patterns, so that we can assume a WXY or a complex ABC is unfolding.
If correct, sellers may step in at the 20D MA again. A possible area is the blue box (.618 to .786 Fib).
Ascendant conjuncts natal Jupiter on 9 OCT. The following trading days 11-12 OCT have higher probability for bearish price action. We may watch out for an expansion of volatility again. A short idea could be interesting at that point, however needs further confirmation.
______________
www.constellations.trade
In my analyses I combine Elliott waves, Gann theory, and planetary aspects to identify turning points in the markets & derive high-probability trading ideas. The strategy is to build leveraged exposure when markets are likely to expand, and to use options premium decay for consistent income when markets may contract and range.
Open an account here if you'd like to support my work:
TastyTrade
America's best Options, Futures and Crypto broker
start.tastyworks.com
Deribit
The world's most liquid Bitcoin options platform
www.deribit.com
Binance
10% off trading fees with this link:
accounts.binance.me
These abbreviations in the chart describe ideas that are provided as educational information and do not constitute financial advice:
STO = sell to open
BTC = buy to close
BTO = buy to open
STC = sell to close
TD = Theta Decay (for example a strangle or iron condor)
Disclaimer:
The views and ideas expressed in this analysis are that of the maker. They are provided as educational information and do not constitute financial or trading advice.

GOOG - Google buy zones ... long term.Global long Term
Green zone - BUY IN1
Green zone - BUY IN2
Red Line - Stop Loss ( Trigger ! )

Google, 1 OCT - Elliott waves | Gann | Astrology $GOOGAlphabet approaches Gann level 2651 and we can count 5 waves to the downside (green count).
The 20 week MA (red) is located below at 2630.
An idea would be to reduce short exposure on Gann level and further observe if buyers step in.
Ascendent conjuncts natal Mercury today, however it stands in trine to natal North Node. Mars squares natal Venus on 2 OCT. Overall rather mixes signals.
Alphabet’s Waymo received a license to offer self-driving rides in California, an important development for the company. Until 8 OCT the Irish govt. is to decide on joining OECD corporate tax proposals, which may impact Alphabet’s margins so that we need to be careful with long positions.
______________
www.constellations.trade
In my analyses I combine Elliott waves, Gann theory, and planetary aspects to identify turning points in the markets & derive high-probability trading ideas. The strategy is to build leveraged exposure when markets are likely to expand, and to use options premium decay for consistent income when markets may contract and range.
Open an account here if you'd like to support my work:
TastyTrade
America's best Options, Futures and Crypto broker
start.tastyworks.com
Deribit
The world's most liquid Bitcoin options platform
www.deribit.com
Binance
10% off trading fees with this link:
accounts.binance.me
These abbreviations in the chart describe ideas that are provided as educational information and do not constitute financial advice:
STO = sell to open
BTC = buy to close
BTO = buy to open
STC = sell to close
TD = Theta Decay (for example a strangle or iron condor)
Disclaimer:
The views and ideas expressed in this analysis are that of the maker. They are provided as educational information and do not constitute financial or trading advice.

Warning Signs in Google Price Pattern1- Closing below 50 EMA for 2 consecutive days after 1 year ..!
2- Lower-High Lower -Low pattern: with higher Volume price in down Swings in comparison to positive days and crossing below an important support level.
3- closing below the Uptrend regression channel after 1 Year:
4- This will become more important when you know Google is the champion between Trillion dollar companies in the market..!
5- A breakaway gap occurs when the price gaps above a support or resistance area, like those established during a trading range. When the price breaks out of a well-established trading range via a gap, that is a breakaway gap. A breakaway gap could also occur out of another type of chart pattern, such as a triangle, wedge, cup and handle rounded bottom or top, or head and shoulders pattern.
A breakaway gap occurs when the price gaps are above resistance or gaps below support.
Support or resistance, in this case, is often associated with a chart pattern, such as a trading range, triangle, wedge, or other patterns.
Breakaway gaps often occur early in a trend and show conviction in the new trend direction.
Other gap types include runaway, exhaustion, and common gaps.
Reference Article:
www.investopedia.com
www.investopedia.com

Google, 29 SEP - Elliott waves | Gann | Astrology $GOOGAlphabet hit resistance at Gann level 2861 and began to lead the market in yesterday’s selloff. As expected from the Nasdaq analysis we can recognise an unfolding wave (c), which is reflected in GOOG as well.
If the green count is accurate, GOOG may have completed wave iii, so that we can look for a potential wave iv with a retrace to the .382 Fib level (blue box).
Waves 4 are hard to trade but due to their choppiness we may profit from a brief contraction of implied volatility when selling premium.
If wave C continues to unfold we may look at the next levels for potential supports:
- 2699, wave (a)=(c) equality
- 2651 Gann level
- 2549 and 2559, Gann level & 1.618 Fib level
On 29 SEP three minor Mars/Moon constellations occur.
Correlations: DXY continues its exceptional strength as yield spiked, but Gold and Bitcoin has started to rise again, which could potentially be an early indicator that USD may begin to slow. EURUSD is at support level as well. A declining USD would help the yield-sensitive tech sector.
______________
www.constellations.trade
In my analyses I combine Elliott waves, Gann theory, and planetary aspects to identify turning points in the markets & derive high-probability trading ideas. The strategy is to build leveraged exposure when markets are likely to expand, and to use options premium decay for consistent income when markets may contract and range.
Open an account here if you'd like to support my work:
TastyTrade
America's best Options, Futures and Crypto broker
start.tastyworks.com
Deribit
The world's most liquid Bitcoin options platform
www.deribit.com
Binance
10% off trading fees with this link:
accounts.binance.me
These abbreviations in the chart describe ideas that are provided as educational information and do not constitute financial advice:
STO = sell to open
BTC = buy to close
BTO = buy to open
STC = sell to close
TD = Theta Decay (for example a strangle or iron condor)
Disclaimer:
The views and ideas expressed in this analysis are that of the maker. They are provided as educational information and do not constitute financial or trading advice.

Alphabet Analysis 26.09.2021Hello Traders,
welcome to this free and educational analysis.
I am going to explain where I think this asset is going to go over the next days/weeks and where I would look for trading opportunities.
If you have any questions or suggestions which asset I should analyse tomorrow, please leave a comment below.
I would also appreciate, if you would smash that like button and help me to create more free analysis like that.
Thank you for watching and I will see you tomorrow!

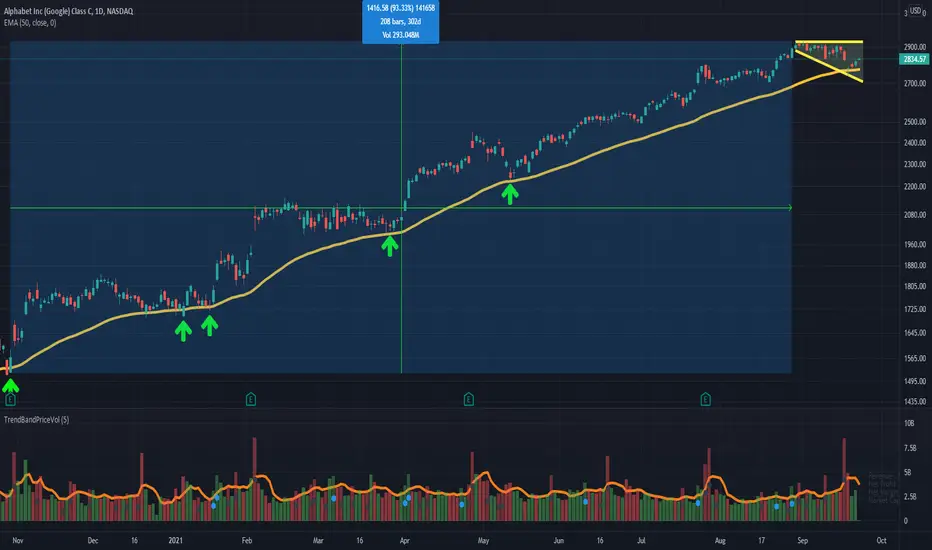
The best support level for GoogleGoogle has never closed below 50 EMA since October 2020..! and after a 93.33% gain, it took over Amazon and become the 3rd biggest company in the world.
It crossed below 50 EMA on September 20, 2021, but bounced backed and finished the day above it. It could stagnates for a while
$AAPL / APPLE going down after bouncing off from upper channelApple has been trading in a nice looking price channel for a while now. Every time it hits the upper channel line, it gets smacked down.

Third day below 50 DMA. $SPY #SP500Third day below 50 DMA. It's clear that breakout has happened. It will take some time before the ship turns.
As long as S&P stays below 50 DMA, I am bearish.

SPY / S&P 500 10-20% correction.after 540 days of S&P 500 going basically straight up there is a crack in "smooth market functioning". Breakout from the rising wedge and breakout below 50 DMA. This will cause a major correction between 10-20%.

Google - Bearish Doji Star & Toppy RSITitle is self-explanatory.
A bearish doji-looking candlestick formation.
Combined with very toppy RSI metrics.
All taking place on the weekly chart.

Market OverviewApple, Facebook, Google, S&P 500, and Nasdaq lost their support!
They all crossing below 50 EMA which used to be important support levels.
AAPL
NASDAQ:FB
GOOG
Question:
what are the signs of reversal?
Is more correction possible or not?

The Magical 50 days Exponential Moving Average (50EMA)In 2021, we should take the price reaction to 50EMA very seriously! Especially if you like to buy the dips!
I believe it could be single best tool to help you find the best entry and exit point in many tickers..!
Let's review few examples:
1- NASDAQ:NVDA
2- NASDAQ:MSFT
3- NASDAQ:AAPL
4- NASDAQ:GOOG
5- NASDAQ:FB
6- NYSE:CRM
7- NASDAQ:CSCO
8- NYSE:SNOW
9- NYSE:BAC
10- NYSE:XOM
and major indexes:
SP:SPX
TVC:NDX
TVC:DJI
What is Price Action?
Price action is the movement of a security's price plotted over time. Price action forms the basis for all technical analysis of a stock, commodity, or other asset charts. Many short-term traders rely exclusively on price action and the formations and trends extrapolated from it to make trading decisions. Technical analysis as a practice is a derivative of price action since it uses past prices in calculations that can then be used to inform trading decisions.
Price action generally refers to the up and down movement of a security's price when it is plotted over time.
Different looks can be applied to a chart to make trends in price action more obvious for traders.
Technical analysis formations and chart patterns are derived from price action. Technical analysis tools like moving averages are calculated from price action and projected into the future to inform trades.
How to Use Price Action
Price action is not generally seen as a trading tool like an indicator, but rather the data source off which all the tools are built. Swing traders and trend traders tend to work most closely with price action, eschewing any fundamental analysis in favor of focusing solely on support and resistance levels to predict breakouts and consolidation. Even these traders must pay some attention to additional factors beyond the current price, as the volume of trading and the time periods being used to establish levels all have an impact on the likelihood of their interpretations being accurate.
Limitations of Price Action
Interpreting price action is very subjective. It's common for two traders to arrive at different conclusions when analyzing the same price action. One trader may see a bearish downtrend and another might believe that the price action shows a potential near-term turnaround. Of course, the time period being used also has a huge influence on what traders see as a stock can have many intraday downtrends while maintaining a month-over-month uptrend. The important thing to remember is that trading predictions made using price action on any time scale are speculative. The more tools you can apply to your trading prediction to confirm it, the better. In the end, however, the past price action of a security is no guarantee of future price action. High probability trades are still speculative trades, which means traders take on the risks to get access to the potential rewards.
Conclusion:
Monitor asset reaction to 50EMA and define your entry and exit strategy based on this simple tool!
Reference Article::
www.investopedia.com
