$GOOG: Reversing off top of 22% range$GOOG, reversing off the top of the range for the 3rd time in past 12 months. Google is an ad machine and ads revenues are cyclical like the economy.
Google (Alphabet)

ALPHABET: GOOGL - Buy on dips continue to pay wellThreats of regulation and fears of lofty valuations, and yet Google is testing the highs yet again. Buy on dips continue to pay well.

Google Potential 10% Return on Buy Google has confirmation on 1 hour 180 day EMA for an upward trend with no break in pattern. Has potential for an easy 3-10% return in the next couple weeks.

"Joe's earning season preview" EP03 --V, BA, FB, GOOG, AMZN! It's the 3rd week and maybe start to feel a little bit improvement in my English speaking lol.
We got the following important names that I mentioned in this episode:
Mon: HAL, AMTD
Tue: BIIB, CMG, KO, V
Wed: T, BA, CAT, FB, PYPL
Thur: GOOG, AMZN (no time for MMM, INTC and SBUX )
Fri: MCD
So many want to talk about but I only got 20 minute in this video, hope everyone a great trading week yo!
Let's see how they go!

Today's Tutorial : How to filter good content in TradingViewHope this idea will inspire some of you !
Don't forget to hit the like/follow button if you feel like this post deserves it ;)
That's the best way to support me and help pushing this content to other users.
Kindly,
Phil


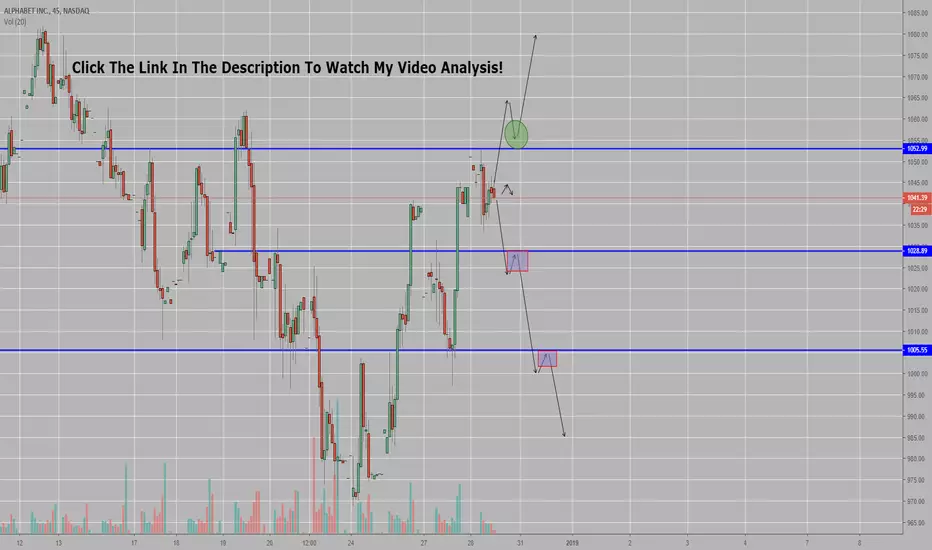
GOOG Put Credit spreadSince the market is making huge gains after googles recent shortfall
I put on a 1090/1100 Credit put spread.
Max gain is $220 max loss is $440
Target is $140 gain and $280 loss max.


Expecting $GOOGL to break up higher - Bullish TrendPlaying off the 1hr trendline here for $GOOGL. Hoping for a bullish close above $1100 6/18 or 6/19 but keeping a stop close. 1.5 R:R here.

Expecting $GOOGL to break up higher - Bullish TrendPlaying off the 1hr trendline here for $GOOGL. Hoping for a bullish close above $1100 6/18 or 6/19 but keeping a stop close. 1.5 R:R here.


Google Now is Fall , But have a new Good Idea ¡possibly now google is not at its best, but let's not forget that google is mister google ¡, and very recently they made a great announcement to create a new way of playing gaming which will practically create a before and after in the gaming industry ¡. well simply if this comes to REal would be a raise for the company at well.

Google/Alphabet Levels To Watch $1,180 and $1,094NASDAQ:GOOG Hi Guys if it breaks the $1,180 level then it would not surprise me to see it fall to $1,094 and re-test.

Google (GOOG)(NASDAQ) Buy Stop Limit $1203.61 >> Target $1217.96NASDAQ:GOOG
Google - Alpabet Inc. (GOOG)
Two days we closed upstairs main volume, today April 11, 2019 i believe price go in higher.
Gold is down right now, we have good idea for up S&P 500 today.
---
Buy Stop Limit - $1203.61
Take Profit - $1217.96
Stop Loss - $1196.44
------
Take Profit = +1.20%
Stop Loss = -0.60%


Bears Put On Notice As Stock Market Finds Fresh SupportAbove the 40 (March 11, 2019) – Bears Put On Notice As Stock Market Finds Fresh Support
March 11, 2019 by Dr. Duru
AT40 = 63.0% of stocks are trading above their respective 40-day moving averages (DMAs)
AT200 = 41.8% of stocks are trading above their respective 200DMAs
VIX = 14.3 (10.7% drop)
Short-term Trading Call: bearish
Stock Market Commentary
The stock market’s scramble for support worked bigtime today.
In my last Above the 40 post, I described the dilemma facing my flip from cautiously bearish to bearish for my short-term trading call. The stock market wasted no time in forcing me to stay my hand right in the middle of the rule I established to guide bearish trades: wait for a breakdown or a test of key resistance. Bears like me were clearly put on notice with today’s trading action. It looks like my next bearish trade will be at a test of resistance. If THAT resistance gives way, then I will be forced to flip neutral and watch the stock market go right back into an extended overbought trading spree.
The S&P 500 (SPY) soared 1.5% as it leaped over its 200-day moving average (DMA) in picture-perfect form.
{The S&P 500 (SPY) gained 1.5% as it reached for its last high which is now the next resistance level.}
The NASDAQ (NDX) did the S&P 500 one better by gapping up and through its 200DMA and closing with a 2.0% gain. The tech-laden index tapped the lower bound of its upper Bollinger Band (BB).
{The NASDAQ (NDX) gapped up strongly enough to put it within a day's rally of testing its last high.}
The volatility index, the VIX, underlined the rush back into the market with a 10.7% plunge well below the 15.35 pivot. The move was a perfect continuation of Friday’s fade. My only new bearish trade on the day was to triple down on my Pro Shares Ultra VIX Short-Term Futures ETF (UVXY) call option (needless to say I cycled through some other call options which are accompanying short shares!). These UVXY calls expire on Friday, so they are even more speculative than usual.
{The volatility index, the VIX, headed straight toward its recent lows in a sharp extension of the previous trading day's fade.}
AT40 (T2108), the percentage of stocks trading above their respective 40-day moving averages (DMAs), confirmed the rush back to “risk-on” trading by leaping from 54.1% to 63.0%. Suddenly, my favorite technical indicator is within sniffing distance of overbought levels (above 70%) all over again. In my last post, I noted how AT40’s rapid drop the previous 3-5 days generated a condition that “felt” oversold. I never even thought about trying to trade that “quasi-oversold” condition from the long side. If I had, I would have taken profits as quickly as I took last week’s profits from new bearish trades.
Now, as bears sit up straight and take notice, I will be watching to see how the S&P 500 (SPY) challenges its 2019 high, a high that was set on the first day of the month.
Stock Chart Reviews
Apple (AAPL)
My bearishness restricted my weekly play on Apple (AAPL) call options to a single call. My very optimistic profit target of a double was exceeded with a close with a triple….and AAPL was just getting started. The stock made a definitive statement with a close on its high of the day and a new 3-month high. As I like to say, it is hard to stay bearish when AAPL is in rally mode. So, AAPL has put me on notice that the S&P 500 is likely to soon, and easily, challenge its 2019 high!
{Apple (AAPL) jumped 3.5% to close at a 3-month high.}
Alphabet (GOOG)
Alphabet (GOOG) gained less than AAPL did, but the stock looks more impressive. GOOG broke out to a 5-month high and confirmed 200DMA support. The stock looks like it built a strong base from the wide consolidation underneath the 200DMA. GOOG is a buy-the-dip stock now, so it will NOT be on my list of stocks to short unless it drops below its 200DMA again.
{Alphabet (GOOG) soared 2.9% and closed at a 5-month high.}


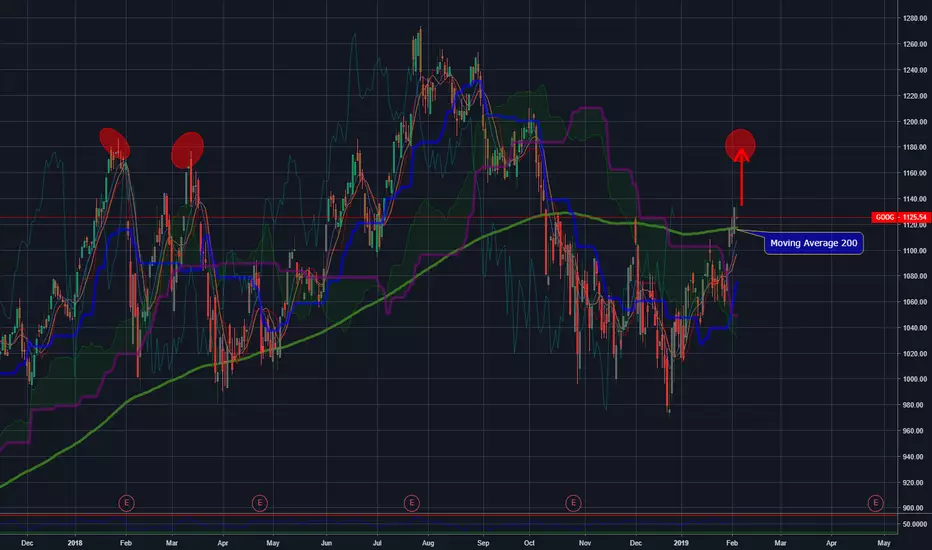
#GOOGLE,GOOG (Alphabet Inc.) Analysis+SignalAs we can see in the graph, we have returned to the buying trend for several days already! We recommend entering a Buy position for several reasons with a very specific target:
1. The price crossed the moving average 200 (Buy Signal) In the daily graph
2. The price crossed the Kijun Sen In the weekly graph
3. The price will seek to reach a psychological goal to test the power of buyers found in 1180 see the graph above
Buy Google
Entry Price:1123
Take Profit: 1180