Alphabet's Stellar Performance Steals the Spotlight...Investor Enthusiasm Ignites as Alphabet's Stellar Performance Steals the Spotlight
Alphabet, the technological powerhouse, has ignited a blaze of excitement among investors with its latest financial report, revealing a striking showcase of accomplishments. With an impressive revenue tally of $74.6 billion and a robust $1.44 in diluted earnings per share, Alphabet has confidently outpaced Wall Street's predictions, sending its stock soaring in the aftermath of this announcement.
This surge in positive momentum isn't an isolated event but rather a continuation of a larger trend. Throughout the initial seven months of 2023, Alphabet's shares have outshone the Nasdaq Composite Index by an astonishing 50%, positioning the company as a beacon of success in the tech arena.
Amidst these resounding triumphs and bolstered by its trillion-dollar valuation, the pertinent query arises: Is this an opportune juncture to delve into an investment with this tech titan?
In the early reaches of 2022, as the Federal Reserve embarked on an assertive campaign of interest rate hikes to combat the burgeoning inflation threat, economists sounded the alarm for an impending recession. This climate of economic uncertainty prompted cautious corporate strategies, leading to curtailed marketing expenditures. The prevailing concern was that dwindling consumer demand might prompt individuals to prioritize essential essentials over discretionary splurges, rendering amplified advertising endeavors seemingly redundant.
In alignment with these cautious corporate maneuvers, Alphabet faced a dip in advertising revenue during the fourth quarter of 2022, with a slight residual dip spilling into the first quarter. However, the most recent quarter's records unveiled a promising uptick of 3% year-over-year in digital ad revenue. This resurgence paints a picture of Alphabet's prime driver – advertising – gaining momentum and veering towards a path of more normalized growth trajectories.
As economic pundits recalibrate their forecasts, lessening the odds of a 2023 recession, the burgeoning trend of escalating ad expenditures could potentially sustain its course across forthcoming quarters. Bearing in mind that ad revenue contributes a substantial 78% to Alphabet's overall company-wide earnings in Q2, this favorable development could undoubtedly bode well for the conglomerate's financial performance.
While Alphabet's advertising revenue strides modestly within single-digit percentages, a radiant star on its horizon is the Google Cloud Platform (GCP). This segment, responsible for a gamut of cloud services spanning computation, data storage, and AI tools, achieved a resplendent $8 billion in sales during the latest quarter – a robust surge of 28% in contrast to Q2 2022. This progression maintains a consistent rhythm from the preceding quarter.
A noteworthy watershed for stakeholders emerges in the form of GCP's burgeoning financial prowess. For the first time in its history, this segment garnered positive operating income within the initial quarter of the current year. Furthermore, the operating margin extended its boundaries to 5% during this latest three-month phase. Should GCP persevere along this trajectory and ultimately reach the commendable 28% operating margin precedent set by Amazon Web Services in 2022, Alphabet's holistic profitability stands poised for substantial amplification across forthcoming years.
With global cloud market forecasts predicting a staggering $2.4 trillion opportunity by 2030, GCP stands at a vantage point to steadfastly wield its leadership in this burgeoning industry. Presently positioned third in market ranking according to Statista, GCP finds itself ideally positioned to continually invest in fortifying its service portfolio for both present and future clientele, armed with a wealth of financial resources and access to top-tier technological talent at Alphabet's disposal.
Despite a meteoric ascent in the annals of 2023, Alphabet's stock remains alluringly valued. Currently, shares are traded at a trailing price-to-earnings (P/E) ratio of 28, situated beneath the 10-year average P/E multiple of 30.6. Amplifying this appeal, with a projected increase in net income, the forward P/E ratio emerges even more enticing at 23.9. These valuation metrics inherently furnish compelling rationales for contemplative investment in this reigning corporate giant.
Augmenting its charm, Alphabet showcases a robust financial stance as of June 30, boasting an impressive $118 billion in a confluence of cash, cash equivalents, and marketable securities, all resting snugly within its balance sheet. Moreover, its long-term debt strikes a modest chord at $14 billion. The company's consistent generation of substantial free cash flow further solidifies its stance as a stalwart stock suitable for the discerning investor to embrace and maintain in their portfolio.
Amidst a landscape characterized by its tantalizing valuation, robust financial posture, and an unwavering stream of cash flow, Alphabet emerges as an enticing prospect for those seeking a stable and propitious addition to their investment repertoire.
Google (Alphabet)

AAPL Buy Long on Pullback?AAPL has been rock solid this year as illustrated by the daily chart. It is no
surprise that AAPL is Warren Buffets's biggest holding. The earnings were a
top line beat with revenue flat. New iPhone sales are off. The TSLA idea
of dropping price to boost demand and trying to maintain margins will
come into effect. The dip this week is remarkable given the range of those
red candles. Based on VWAP bands, AAPL is overbought and overvalued but
not badly so. Price has dropped under the longest moving average (HMA140)/
This is a small pullback I will use the opportunity to purchase a call option
striking over the money at $205 for mid-November as an intermediate
term veto that AAPL will march consistently higher. Because of this pullback
the options contract will be a bit cheaper and easier from which to achieve
a realized profit.

Some Technical Areas For Tesla, Apple & AlphabetHi,
A little guide for you about Tesla, Apple, and Alphabet. Pointed out some key areas from where to take out some profits or if you are interested in some sort of stocks then a couple of scarious from where you can jump in. Not an idea post, more like an analysis but still, it should give you a little picture about them.
Tesla (TSLA)
Recently the Tesla stock has been respected by technical analysis quite nicely. Several calls have worked almost perfectly and short-term targets are reached fairly easily.
Currently, for me, the Tesla stock is in the middle of nowhere. My previous short-term target was around $300 and it has been reached, so I will wait for further price action. If the price goes above $300 then I will consider it as a breakout and I need to see a price action above that to make a decision.
The sweet spot for me is the $190-$220. If the price reaches there then I'm ready to take it but we need to see a quite good selloff - let's see.
So, if you are not in Tesla then wait for a breakout above $300 which can confirm further growth, or wait for a pullback/selloff to the mentioned lower price zone.
Apple (AAPL)
This year has been quite good for Apple, the gain from the bottom is 58%. In the first week of 2023, it bottomed and after that, very solid and consistent grind to higher levels - a new all-time high has reached.
If you are on it then short-, and mid-term investors can think about taking some profits because it has reached to the round number of $200. The round number can act as a resistance level and the price can be stuck there for a while or it can get a rejection to downwards. So, if you don't have a long-term plan with AAPL then there is a place to take out some profits.
If you don't have any Apple shares then you should wait. Firstly, how the $200 act and wait for the price action. If it gets a pullback then you can grab it from the previous highs which now start to act as support levels. These are not the strongest areas but at least you have something to stick with because to buy it from the current price can be quite a huge mistake considering short-term investment.
So, if you see a pullback then be ready to act around 170 to 180 dollars, and the strongest price zone is around ~$150.
Alphabet (GOOG)
Technically the last weekly candle close was a small breakout. $126.5 has been a minor horizontal price level. This level has been a short-term support level and a couple of months ago it acted, and stopped the price, as a resistance. Now, we have this level "smashed" with quite a solid weekly candle and if you are interested then technically you have a light-green light to take it during the retest of ~$126.
Stay cautious after you have seen a monthly or weekly close below this level.
Regards,
Vaido

Discover the Hottest USA Stock Market Sectors - Get Ready for anI couldn't wait to share the hottest USA stock market sectors set to sizzle this August. Brace yourself for an action-packed month with potential profits and exciting investment opportunities!
1. Technology Titans: The tech sector continues to dominate the market, with innovative companies leading the charge. From cutting-edge software solutions to breakthrough hardware advancements, this sector promises immense growth potential. Stay ahead by closely monitoring tech giants like Apple, Amazon, and Google.
2. Renewable Energy Revolution: The renewable energy sector is rising as the world shifts towards sustainable practices. Solar, wind, and hydroelectric power companies are experiencing a surge in demand, presenting a remarkable chance to invest in a greener future. Keep an eye on industry leaders such as Tesla, First Solar, and NextEra Energy.
3. Biotech Breakthroughs: The biotech sector is witnessing a wave of groundbreaking advancements in healthcare and pharmaceuticals. Companies focused on developing innovative treatments, vaccines, and therapies are gaining substantial attention. Keep a close watch on biotech giants like Moderna, Pfizer, and Johnson & Johnson.
4. E-commerce Explosion: The pandemic has accelerated the growth of the e-commerce sector, and it shows no signs of slowing down. Online retail giants are experiencing exponential growth as consumers embrace the convenience of digital shopping. Keep an eye on industry heavyweights like Amazon, Shopify, and eBay.
Now, here comes the exciting part! To ensure you don't miss any action this August, I encourage you to subscribe to our exclusive newsletter or follow our social media channels. By doing so, you'll receive regular updates, expert insights, timely tips on these hot sectors, and more.
Don't let this opportunity pass you by! Stay ahead of the curve and make informed investment decisions by subscribing or following.
Remember, August is shaping up to be a thrilling month in the stock market, and you don't want to miss out on the potential gains these sectors offer. Subscribe/follow now and get ready for an exhilarating ride!

✅ Daily Market Analysis - WEDNESDAY JULY 26, 2023Key News:
USA - Building Permits
USA - New Home Sales (Jun)
USA - Crude Oil Inventories
USA - FOMC Statement
USA - Fed Interest Rate Decision
USA - FOMC Press Conference
Cautious Optimism in European Markets as FTSE 100 Reaches Two-Month High
European markets have started the week with a cautiously optimistic tone, fueled by hopes of additional stimulus measures from Chinese authorities in response to recent poor economic data. The sentiment has had a positive impact on the FTSE 100, which experienced a significant boost, reaching a two-month high on the previous day.
Investors in the region are closely monitoring developments in China, as concerns over its economic slowdown have weighed on global markets. The prospect of further stimulus measures from Chinese authorities is seen as a potential boost for both the Chinese economy and international markets, including Europe.
In response to the recent challenges in the Chinese economy, there are expectations that authorities may introduce measures to support growth and stability. Such actions could include monetary easing, fiscal support, or targeted measures to address specific economic sectors.
The positive market sentiment in Europe, particularly in the UK represented by the FTSE 100, is a reflection of investors' hopes for a potential economic rebound in China. As one of the world's major economies, any improvement in China's economic outlook could have significant ripple effects on global trade and investment.
However, market participants remain cautious as uncertainties persist, and the situation in China remains fluid. The impact of any stimulus measures on the broader global economy is yet to be seen, and geopolitical factors continue to influence market sentiment.
As the week progresses, investors will closely watch for any official announcements from Chinese authorities regarding stimulus measures and assess their potential implications for the European and global markets. In the meantime, cautious optimism prevails, with the FTSE 100's recent performance reflecting the market's hopeful outlook for economic recovery.
FTSE 100 daily chart
Optimism Grows as Short-Term Yields Retreat, Earnings Reports Impress
The improved sentiment in the markets has been further bolstered by a retreat in short-term yields, as investors believe that central banks may not need to implement aggressive rate hikes as previously anticipated just a few weeks ago. This development has eased concerns and contributed to a more positive outlook in the financial landscape.
Both German and UK 2-year yields have experienced a sharp decline from their earlier highs this month, largely attributed to the indication that inflation is slowing down more rapidly than initially projected. This trend has provided reassurance to investors, alleviating some of the fears of abrupt rate hikes that could potentially hamper economic recovery.
In the United States, stocks are witnessing moderate gains on Tuesday, driven by several factors contributing to a favorable market environment. Firstly, the release of a better-than-expected Consumer Confidence survey has boosted investor confidence in the strength of the US economy. The survey's positive results signal that consumers are optimistic about economic prospects, which bodes well for future spending and business activity.
Additionally, a series of earnings reports has surpassed expectations, further uplifting market sentiment. Strong corporate performance is a key driver of market growth, and companies' ability to outperform forecasts indicates robust economic conditions and the potential for continued expansion.
The combination of upbeat economic data and encouraging earnings reports has reinforced the notion that the global recovery is on track, and the worst impacts of the pandemic are subsiding. These positive developments have contributed to the improved sentiment in the markets and the appetite for risk among investors.
As the financial landscape continues to evolve, market participants will closely monitor central bank actions and economic indicators for further clues on the trajectory of interest rates and inflation. In the meantime, the current positive market sentiment is supporting moderate gains in US stocks and providing a sense of optimism for investors in the midst of an ever-changing economic landscape.
NASDAQ indices daily chart
SPX indices daily chart
DJI indices daily chart
Wall Street Rally: Factors Fueling Optimism in the US Market
The current Wall Street rally has been fueled by a convergence of positive factors, creating a favorable environment for investors and driving market sentiment. Several key elements are contributing to this optimistic outlook.
Strong US Consumer Confidence: One of the driving forces behind the rally is the strong US consumer confidence. The recent surge in consumer confidence has instilled optimism in the economy's resilience and growth prospects. This positive sentiment is indicative of consumers' confidence in their financial well-being and their willingness to spend, which can have a significant impact on economic activity and corporate performance.
Growing Belief in an Economic 'Soft Landing': Investors are increasingly becoming more confident in the notion of an economic 'soft landing,' wherein the economy transitions from a period of rapid growth to a more sustainable and stable pace. This reassurance has been underpinned by various economic indicators and data, suggesting that the economy is gradually moderating, rather than facing a sharp contraction.
Optimism Surrounding Artificial Intelligence Initiatives: The growing focus on artificial intelligence (AI) initiatives is also contributing to the positive sentiment on Wall Street. Investors are recognizing the potential of AI technologies to drive innovation, efficiency, and productivity in various industries, creating exciting opportunities for companies at the forefront of AI adoption.
Better-than-Anticipated Earnings Results: The ongoing earnings season has seen better-than-anticipated results from major tech companies, further boosting investor confidence. These positive earnings reports signal strong corporate performance and underscore the robustness of the US economy.
Busy Earnings Season: This week marks the start of the two busiest weeks of the earnings season, with a significant number of US companies reporting their earnings. Investors are closely monitoring these reports for insights into corporate performance and future prospects. The initial reactions to earnings releases from companies like Microsoft and Alphabet have been positive, adding to the overall optimism in the market.
Resilient US Economy and Federal Reserve's Monetary Policy: The overall resilience of the US economy and indications that the Federal Reserve is nearing the end of its rate-hiking cycle have contributed to the positive sentiment. A stable monetary policy outlook provides confidence to investors, as it suggests that the central bank is striking the right balance between managing inflation and supporting economic growth.
In conclusion, the current Wall Street rally is the result of multiple factors aligning to create an environment of optimism and confidence. Strong consumer confidence, expectations of an economic 'soft landing,' enthusiasm for AI initiatives, and positive earnings results are all contributing to the positive sentiment. As the earnings season unfolds, investors will continue to closely monitor corporate performance and central bank actions, which will further shape market dynamics in the weeks to come.
GOOGL stock daily chart
MSFT stock daily chart
Fed's 25bps Rate Hike Likely to Be the Last in 2023 Amid Inflation Concerns
The much-anticipated 25 basis points rate hike by the Federal Reserve today is expected to mark the final increase for the year, despite any potential arguments by Fed policymakers for additional hikes. Last month's pause in rate increases seems to set the tone for a more cautious approach towards monetary tightening.
Recent trends surrounding US inflation, particularly the likelihood of the Producer Price Index (PPI) turning negative in July, may pose challenges for the Fed's case for further rate hikes. Inflation dynamics have been a key concern, and the prospect of PPI potentially going negative adds to the complexities of justifying additional tightening measures.
Federal Reserve Chairman Jerome Powell may voice support for more rate hikes, but prevailing market sentiment seems to favor a prolonged period of higher rates. The focus will be on the Fed's projections regarding when it expects to reach its 2% inflation target. Despite the headline Consumer Price Index (CPI) currently sitting at 3%, core prices remain elevated, capturing attention from both the Fed and the market.
Investors and analysts will closely monitor the Fed's communication on its outlook for inflation and its strategy to achieve its price stability mandate. Any indication that the Fed is reassessing its approach to monetary policy amid inflation concerns could impact market sentiment and influence future rate expectations.
As the Fed delivers its decision today, the financial community will scrutinize not only the rate hike itself but also the nuances in the accompanying statements and remarks made by Chairman Powell during the press conference. Clarity on the Fed's stance and commitment to addressing inflation will be crucial for shaping market expectations and guiding investor decisions in the coming months.
US inflation rate
Challenges Ahead for the Fed as Headline CPI Declines, Causing Uncertainty in Gold Prices
As headline Consumer Price Index (CPI) continues its downward trend, the Federal Reserve may encounter difficulties in convincing the markets to support further rate hikes under the current economic conditions. The declining CPI adds to the uncertainties surrounding the central bank's future monetary policy decisions.
Gold prices have been experiencing fluctuations this week as investors remain cautious ahead of the Federal Reserve's meeting later in the day. The widely anticipated 25 basis points rate hike during the meeting has already been factored into the market expectations. However, the focus lies on any indications or signals regarding the central bank's stance on future rate hikes for the remainder of the year.
The precious metal's prices have remained within a narrow range amid the uncertainty surrounding the Fed meeting. Investors are closely monitoring any clues from the Federal Reserve regarding their outlook on inflation and potential further tightening measures. Market participants are keen to understand the central bank's assessment of economic conditions and whether additional rate hikes are warranted amid the evolving inflation dynamics.
As the Federal Reserve makes its announcement, the markets will be carefully analyzing the statements and remarks by Fed officials, especially Chairman Jerome Powell, during the press conference. Any hints of a shift in the Fed's approach to monetary policy could trigger volatility in gold prices and influence investor sentiment.
In this climate of uncertainty, gold prices are likely to react to the nuances of the Fed's communication, as traders and investors gauge the central bank's intentions and how it plans to address inflationary pressures. The upcoming meeting will provide critical insights into the central bank's strategy, and any surprises or shifts in their messaging could have significant implications for gold prices and the broader financial markets.
XAU/USD daily chart
Gold's Recovery Stalls Amidst Uncertainties Ahead of Central Bank Meetings
Gold has experienced a robust recovery over the past month, primarily driven by weak US economic data, particularly concerning inflation figures. Speculations arose that the Federal Reserve's ability to continue raising interest rates would be limited, providing support for the precious metal's price surge. However, in recent sessions, this rebound has stalled as uncertainties loom in anticipation of the outcome of the Fed's meeting.
Investors are closely watching the Federal Reserve's meeting, as it will provide crucial insights into the central bank's monetary policy outlook and how it plans to address inflation concerns. The speculations surrounding the Fed's future rate hikes have added to the cautious sentiment in the gold market, leading to a pause in the metal's upward momentum.
Beyond the Fed meeting, investors are also keeping an eye on decisions from the European Central Bank (ECB) and the Bank of Japan (BOJ) later in the week. The ECB is expected to raise rates by 25 basis points on Thursday, signaling a shift in its monetary policy stance. On the other hand, the BOJ is likely to maintain its ultra-dovish approach on Friday, emphasizing its commitment to supporting the Japanese economy.
These upcoming central bank meetings have introduced further uncertainties into the market, causing investors to exercise caution and reassess their strategies. Gold, often sought as a safe-haven asset during times of economic uncertainty, is particularly sensitive to changes in interest rates and monetary policies, leading to the recent hesitation in its price movement.
As the central banks announce their decisions and provide guidance on their future policy trajectories, the gold market is expected to see increased volatility. The outcomes of these meetings will shape investor sentiment, potentially leading to new trends in the precious metal's price. In such a dynamic environment, traders and investors need to remain vigilant and closely monitor central bank communications to make informed decisions amid the evolving economic landscape.
EUR/USD daily chart
GBP/USD daily chart
Euro and Pound Weaken Against US Dollar Amidst Weak PMI Surveys from Europe
The euro and pound have been trading at moderately weaker levels against the US dollar, experiencing further declines following the release of weaker-than-expected PMI surveys from Europe. The data revealed a slowdown in economic activity, raising concerns about the region's recovery prospects.
Investors are closely monitoring the developments surrounding central bank meetings, particularly the Federal Reserve and the European Central Bank (ECB). The prevailing market sentiment suggests that the Fed is likely to implement a single rate hike and then pause, signaling a more cautious approach to addressing inflationary pressures. On the other hand, the ECB may have further rate adjustments to make as it grapples with economic uncertainties in the Eurozone.
These differing expectations for the two central banks could lead to significant fluctuations in the value of the euro in the currency markets. Investors are keeping a keen eye on any shifts in either or both of these views, as they can have a profound impact on the euro's trajectory.
The weakening of the euro and pound against the US dollar indicates growing concerns about the economic outlook for Europe. The region's PMI surveys have highlighted challenges in various sectors, and this has put pressure on the currencies.
In such a dynamic environment, currency traders need to remain vigilant and responsive to changing market sentiment and economic data. Any surprises or shifts in central bank policies can lead to rapid movements in currency pairs, presenting both opportunities and risks for traders.
As the central banks proceed with their monetary policy decisions, market participants will closely analyze their communications and guidance. Any indications of future rate adjustments or policy shifts could spark volatility in the currency markets, making it essential for traders to stay informed and adaptable in their strategies.

GOOGLE How is it looking before the earnings?It has been very long since we last looked into Google (GOOG) but last time we did (November 07 2022) we gave a massive buy signal (see chart below) at the market's absolute bottom:
The stock price rose +49% since then, giving us one of the most successful low risk trades of the year. With the company reporting its Earnings today though, we shift back to the 1D time-frame where the stock has been trading within a clear Channel Up throughout this recovery phase. Based on the 1D MACD Bearish into Bullish Cross sequence, we may be at a Higher Low leg as on March 13.
As long as the price is trading within the Channel Up and the (dotted) Channel Down, we remain bullish, aiming at a +21% rise (standard inside the Channel Up) and a price target of $140.00. If the price breaks below the Channels' bottoms, we will sell, targeting the 1D MA200 (orange trend-line) at $106.50.
-------------------------------------------------------------------------------
** Please LIKE 👍, FOLLOW ✅, SHARE 🙌 and COMMENT ✍ if you enjoy this idea! Also share your ideas and charts in the comments section below! **
-------------------------------------------------------------------------------
💸💸💸💸💸💸
👇 👇 👇 👇 👇 👇

Daily Market Analysis - MONDAY JULY 24, 2023Key News:
UK - S&P Global/CIPS UK Manufacturing PMI
USA - S&P Global US Services PMI (Jul)
The Dow Jones Industrial Average celebrated a remarkable milestone on Friday, securing its 10th consecutive weekly gain and extending its longest winning streak since 2017. However, the market's positive performance was tempered by cautiousness among traders ahead of the upcoming quarterly results from major tech companies.
The Dow managed a marginal increase of 0.01%, equivalent to a mere 3 points, which might seem modest, but it's significant given the index's prolonged daily winning streak, last witnessed on August 7, 2017. The primary force behind the Dow's recent success lies in the gains made by defensive sectors, particularly utilities, which have helped bolster overall market sentiment.
In contrast, the Nasdaq experienced a slight decline of 0.2%, while the broader S&P 500 index edged up by 0.1%, showcasing a mixed performance across the board.
Traders remained watchful and exercised caution as they eagerly await the upcoming quarterly reports from major tech companies. These reports could have a considerable impact on market dynamics, influencing the direction of future trades and investor sentiment.
NASDAQ indices daily chart
DJI indices daily chart
S&P500 indices daily chart
As the new week kicked off, gold prices experienced a slight dip as investors exercised caution ahead of a highly anticipated Federal Reserve meeting. Meanwhile, copper prices faced significant losses, primarily driven by concerns surrounding weakening demand in China.
The metal market witnessed additional pressures with the dollar staging a recovery. The greenback strengthened, moving away from the 15-month lows it had reached earlier in July.
These developments have created a sense of uncertainty and wariness among investors, who are closely monitoring the upcoming Federal Reserve meeting for any signals that could impact the precious metals and copper markets. The performance of the dollar is also being closely scrutinized, as its strength or weakness can have substantial implications for metal prices and global trade dynamics.
In light of the prevailing economic uncertainties, market participants are treading carefully and making informed decisions as they navigate through this crucial week, where the outcomes of central bank policies and macroeconomic indicators are expected to shape market trends in the near term.
XAU/USD daily chart
The spotlight in recent market activity has been firmly fixed on the Federal Reserve's forthcoming decision on interest rates, set to be revealed at the conclusion of a two-day meeting on Wednesday. The prevailing consensus among investors is that the central bank will opt to raise interest rates by 25 basis points.
Nevertheless, there exists a strong belief among market participants that the Federal Reserve might also indicate a pause in future rate hikes. With the central bank nearing the conclusion of its nearly 16-month-long rate hike cycle, such a stance could signal a potential break from the previous trend of steady increases in interest rates.
This prospect of an extended pause in rate hikes has caught the attention of investors, particularly in relation to the impact on the precious metal market, notably gold. Historically, rising interest rates tend to elevate the opportunity cost of investing in gold, as higher rates make alternative assets more appealing for yield-seeking investors. Conversely, if the Federal Reserve hints at a pause or slower pace of future rate increases, it could potentially be favorable for gold, as it reduces the opportunity cost of holding the precious metal compared to other interest-bearing assets.
As the markets eagerly await the Fed's decision and the accompanying guidance, the implications for gold and other asset classes remain uncertain. The outcome of the meeting and the central bank's tone in their statements will undoubtedly have significant repercussions on investment strategies and market sentiment in the days to come.
EUR/USD daily chart
The dynamics in the EUR forward curve are undergoing a shift due to two essential factors. Firstly, foreign exchange traders are adjusting their pricing of lower US real rates in the long-term forwards after the recent Consumer Price Index (CPI) report. This indicates a realization that they may have been overly aggressive in their initial assessments. Secondly, the impact of ECB commentary on the Eurozone's economic data and inflation is likely to moderate, given the weaker economic indicators in the region.
The Bank of Japan's decision on maintaining its current interest rates is also a significant point of interest. With rates at 0% or in negative territory for an extended period, it is somewhat expected that they will continue with this stance.
China's 0% Consumer Price Index (CPI) rate is another crucial observation, as its potential spread could impact Japan first and have broader implications for global markets, particularly for stock markets and the future trajectory of the dollar. The actions and statements of these central banks will be closely watched by investors, as they could set the tone for market movements in the days to come.
On a different note, the US earnings season is entering a crucial phase this week, with major companies like Meta Platforms, Microsoft, and Alphabet preparing to release their reports. These earnings announcements are likely to have a significant impact on stock markets and investor sentiment.
As the week unfolds, investors will be navigating through these key developments in global monetary policies, inflation trends, and corporate earnings, which will undoubtedly shape market dynamics and future trading strategies.
MSFT stock daily chart
META stock daily chart
GOOG stock daily chart
Absolutely, the upcoming earnings results of major companies like Meta Platforms, Microsoft, and Alphabet are crucial in meeting market expectations and justifying the current valuation of the S&P 500. The current earnings multiple of 20 times and the substantial year-to-date gains of 19% in the index indicate high market optimism.
Investors will be closely scrutinizing these earnings reports to assess the health and potential direction of the market. Meeting or exceeding market expectations in these reports will likely be seen as a positive sign, reinforcing confidence in the ongoing market rally. On the other hand, any disappointments or weaker-than-expected results could raise concerns and potentially lead to market corrections.
Given the prevailing market conditions and the momentum in the S&P 500, investors are eager to ascertain the sustainability of the rally and whether the current valuations are justified by the underlying company fundamentals.
As the earnings season unfolds, the market sentiment will be heavily influenced by the performance of these major companies, as well as the guidance provided by their management teams.

GOOGL Alphabet Options Ahead of Earnings ! Sell-Off Thesis !If you haven`t sold GOOGL here:
or reentered here:
Then analyzing the options chain and chart patterns of GOOGL Alphabet Inc prior to the earnings report this week,
I would consider purchasing the 115usd strike price Puts with
an expiration date of 2024-1-19,
for a premium of approximately $6.15.
If these options prove to be profitable prior to the earnings release, I would sell at least half of them.
While Google currently holds a dominant position in the search engine market, the landscape is dynamic and subject to change. If Microsoft successfully leverages its partnership with OpenAI to enhance Bing's capabilities, coupled with strategic marketing initiatives, it could potentially chip away at Google's market share over time.
You can read my full GOOGL Sell-Off thesis here:
Looking forward to read your opinion about it.

GOOG - Rising Trend Channel [MID -TERM]🔹Breakout rising trend channel.
🔹Breakout resistance at 123, signals further rise.
🔹Technically POSITIVE for medium-term long-term.
Chart Pattern;
🔹DT - Double Top | BEARISH | 🔴
🔹DB - Double Bottom | BULLISH | 🟢
🔹HNS - Head & Shoulder | BEARISH | 🔴
🔹REC - Rectangle | 🔵
🔹iHNS - inverse head & Shoulder | BULLISH | 🟢
Verify it first and believe later.
WavePoint ❤️

GOOGLE Approaching the bottom of the 6 month Channel Up.Google is under the 1day MA50 and is gradually turning into a buy opportunity.
The ideal level is as close to the bottom of the 6 month Channel Up as possible, with the RSI near the oversold 30.00 limit.
Buy after the MACD forms a Buy Cross, which was the confirmed signal in the previous two bottoms.
Target Resistance A at 129.50.
Follow us, like the idea and leave a comment below!!

Market has bottomed..Market about to enter a new Bull Cycle. See my chart. We are bouncing off the wave that I have displayed.
I circled all market bottoms in the past years since 2010.

GOOGLE: Hit the 1D MA50 after 3.5 months! Rebound ahead?Google hit two days ago the 1D MA50 for the first time since March 15th and is already rebounding. The 1D technicals are neutral (RSI = 49.273, MACD = 1.050, ADX = 30.515) indicating that the first buy in some time can be justified on the current level buy attention is required as the downside has technical extension potential.
We are taking this opportunity to place our first buy and target the R1 (TP = 130.00) but if 1D closes the candle under the MA50, we will realize the loss, sell with TP = 108.00 and then reverse to buying again (TP = 130.00) assuming the 1D MA200 holds as the long term Support.
The 1D RSI touched its HL trendline, which empowers buying on the current level.
## If you like our free content follow our profile to get more daily ideas. ##
## Comments and likes are greatly appreciated. ##

Alphabet vs. Tech Giants: Analyzing Investor Pessimism...Alphabet, the parent company of Google, has faced scrutiny from various angles, including the emergence of artificial intelligence (AI) tools like ChatGPT, heightened regulatory oversight, and a slowdown in digital advertising spending. Despite being a major player in the technology industry with diverse ventures, Alphabet's stock performance has garnered more skepticism from investors compared to other prominent tech companies.
Although Alphabet has seen a modest increase of over 9% in the past 12 months, it has lagged behind its counterparts and the overall performance of the S&P 500 index.
While Alphabet is considered a solid investment, it is crucial to consider the timing of investing in the company. Despite its long-term potential, the current circumstances call for cautious evaluation.
Alphabet has been entangled in prolonged legal battles with European Union regulators for over a decade, primarily related to antitrust violations. The company has incurred substantial fines from the EU, including a $3.5 billion penalty in June 2017 and a fine exceeding $6.1 billion in September 2022. More recently, the European Commission has notified Alphabet of its breach of EU antitrust rules, specifically in the advertising technology (adtech) industry. Bloomberg has reported that the EU may impose another significant penalty, potentially surpassing $8 billion.
Apart from the financial implications, the potential requirement for Alphabet to restructure and divest portions of its adtech business to maintain operations within EU countries is a significant concern. This obstacle looms large, considering that Europe, the Middle East, and Africa (EMEA) contribute 30% of Alphabet's revenue.
Considering all these factors, it is essential to carefully assess the risks and potential consequences before deciding whether it is the right time to invest in Alphabet.
Alphabet heavily relies on Google's advertising business, which accounted for $54.5 billion out of its total Q1 2023 revenue of $69.7 billion. It constituted over three-quarters of the company's fiscal 2022 revenue, underscoring its importance to Alphabet's overall financial performance.
Despite a 2.6% year-over-year revenue increase in Q1, Alphabet experienced an 8.2% decline from Q4 2022, with Google's advertising revenue declining for consecutive quarters. Recognizing the risks associated with a weakened advertising business, Alphabet has prioritized diversifying its revenue streams, particularly through the growth of Google Services and Google Cloud. Google Cloud revenue reached $7.4 billion in Q1, up from $5.8 billion in Q1 2022, and has finally achieved profitability.
For Alphabet to ensure long-term sustainability, it must rely less on Google advertising and focus on strengthening other segments, especially Google Cloud, which currently lags behind competitors like Amazon Web Services and Microsoft Azure in market share. However, the profitability achieved in Google Cloud is an encouraging sign for investors.
Returning to the initial question of whether Alphabet is a favorable investment at present, the answer is yes for long-term investors with a substantial time horizon. Alphabet possesses the resources and resilience to withstand the challenges it faces. Concerns regarding Google search are valid but possibly overstated, as it will likely remain a significant revenue source for the foreseeable future, albeit with reduced reliance.
However, the response becomes more complex for investors concerned about short-term stock performance. The overall hype surrounding the tech industry has propelled Alphabet's stock price by over 35% year-to-date as of June 23. Nevertheless, a market pullback, not only for Alphabet but also for the tech sector as a whole, may be on the horizon.
Given the circumstances, it may be an opportune time to gradually accumulate Alphabet stock through dollar-cost averaging. This approach involves consistently investing fixed amounts over time, thereby mitigating the impact of short-term market fluctuations.

Nasdaq & tech has bottomedNasdaq & tech has bottomed in Oct 2022. As seen on the previous dips of covid march 2020 and the 2018 crash, all are buys. I expect us to rise rest of the year for 2023.
Market is still fueling against the Fear psychology that is still happening.

Google -> Pumping With The AI HypeHello Traders,
welcome to this free and educational multi-timeframe technical analysis .
On the weekly timeframe you can see that Google stock just retested and with a weekly bearish candle perfectly started to reject major previous structure at the $130 level.
You can also see that weekly market structure is still quite bullish, Alphabet is now retesting the 50% fibonacci retracement level and also previous weekly resistance which is now turned support at the $120 level so I simply do expect more continuation towards the upside from here.
On the daily timeframe you can see that Google stock just created and confirmed a daily head and shoulders reversal pattern so I am now just waiting for a break back above the neckline - then we would also have bullish market structure again - and then I simply do expect also a daily rally to retest the next resistance at the $130 level.
Thank you for watching and I will see you tomorrow!
You can also check out my previous analysis of this asset:

𝗡𝗮𝘀𝗱𝗮𝗾 𝗨𝗽𝗱𝗮𝘁𝗲: $QQQ Daily. Red flag 🚩 for bearsHolding mid-bolli after an ugly candle yesterday. Red flag 🚩 for bears ATM. Another push higher for a final wave to put divergence in before a real pullback? What do you think?
$NQ_F NASDAQ:NDX NASDAQ:AAPL NASDAQ:MSFT NASDAQ:AMZN NASDAQ:META NASDAQ:GOOG NASDAQ:TSLA NASDAQ:NVDA NASDAQ:SOX $ES_F AMEX:SPY SP:SPX TVC:DXY NASDAQ:TLT TVC:TNX TVC:VIX #Stocks

GOOG WEEKLY ANALYSIS after rejection of the price at the level of a resistance and the filling of an FVG '' Fare Value Gap'' at the level of this zone we will see a reversal of the price to fill this FVG for the continuation towards suppLy zone

GOOG is in an early reversalGOOG with its dominant search engine, YouTube, Maps and other apps besides cloud services
is a revenue gisnt. On the daily chart, it has had a respectable 40% YTD . However, I see signs
of a reversal. Added to the chart are the anchored VWAP bands beginning from the earnings of
November 2022. Price is in the neighborhood of 3 standard deviations from the mean. This is an
area where institutional and professional traders like to sell and earn their profits. Several
recent candles had wicks beyond that third standard deviation line. The candle stick analysis
is that of a " 3 bar play" - in this case, a green candle then a Doji candle suggesting indecision
and finally, a red candle documenting the change in direction. The ADX indicator shows
the weakening of trend directional strength topping out and then decreasing. The POC line
of the long-term volume profile is about the same level as the mean VWAP line. That is to
say, there is congruence there and so a very strong buying zone with high volatility
Overall I will take a short trade in 20 shares of GOOG with a stop loss at 129 and take a profit
of half at 106 ( above the POC line) and the other half at half at 103 ( near VWAP) using a sell-
stop order when the price crosses $ 0.25 below market to assure the direction
validation. If the trade goes in my direction to the target I expect a R0! of 15- 18% overall.
IF you want to know my idea of a good option trade leave a comment. IF you take a short
trade on the stock, I wish you the best of luck in your trade. I will adjust
stop loss down to the entry price when the stock price goes under 120 to make the
trade risk-free and then decrease the stop loss price by 4.50 upon market of 115. When
the market goes under 110, I'll change the stop loss to a trailing loss of 2 % and when it goes
under 108 change the trailing loss to 1% as alerted by alerts on the price that I have setup
to minimize screen time in trade management .

Google vs BingIf you haven`t sold GOOGL here:
Or bought it here:
Then you should know that the investment by Microsoft in OpenAI signifies a significant boost to their artificial intelligence capabilities. OpenAI's advanced technologies and expertise in AI research and development could potentially enhance the capabilities of Microsoft's Bing search engine. With access to powerful AI algorithms and resources, Bing may be able to offer more personalized and accurate search results, thereby attracting users who seek a more refined search experience.
Furthermore, Microsoft has been making strategic moves to expand its presence in various sectors, including cloud computing and enterprise services. By integrating Bing into its ecosystem of products and services, Microsoft can leverage its existing user base and partnerships to promote Bing as a viable alternative to Google.
In recent years, Google has faced scrutiny over data privacy concerns and antitrust issues, which could create an opportunity for Bing to gain traction among users seeking more privacy-focused alternatives. Additionally, Microsoft has been actively investing in marketing and advertising efforts to raise awareness about Bing and improve its market positioning.
While Google currently holds a dominant position in the search engine market, the landscape is dynamic and subject to change. If Microsoft successfully leverages its partnership with OpenAI to enhance Bing's capabilities, coupled with strategic marketing initiatives, it could potentially chip away at Google's market share over time.
If I had to buy some options, that would be the following puts:
2024-1-19 expiration date
$105 strike price
$3.25 premium
Looking forward to read your opinion about it!

GooGusd are you rdy for buy 🧨👌❤The big company Google has been using the downward trend of gold for days and for now it will have an upward trend for its shareholders.
Dear Americans who are Google shareholders, do not hold your shares until the price of $152.10.
The downward trend of Google will start from the price of $152.10, and for a long time, Google will sink into financial stagnation, and the expected decline for Bill Gates is $69.
These days, Bill Gates will sell Google shares as much as he can and will start buying when Google shares fall.

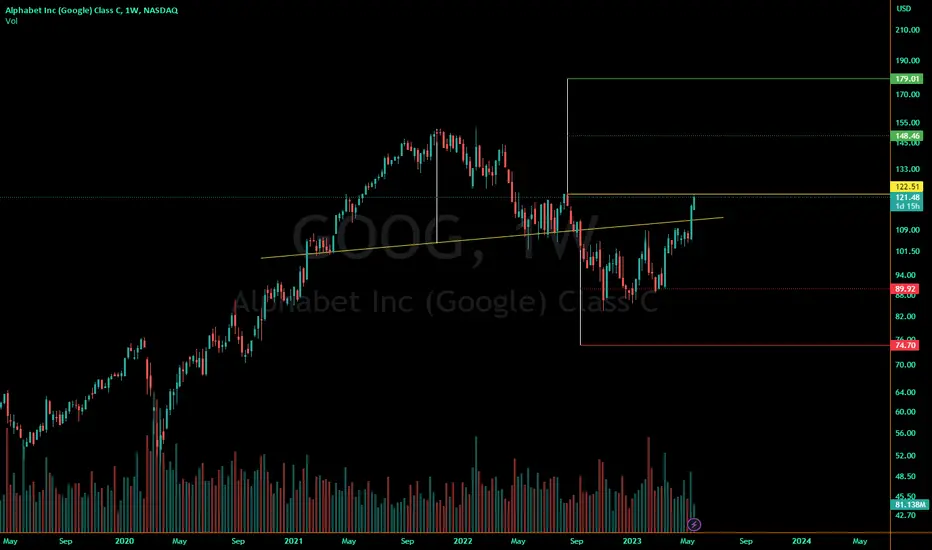
Google at major decision areaMove and hold above 122 and Google will see ATH again, possibly a new ATH near 180. Remain below 122 and lose the 2nd yellow line below it, and it's headed back down to recent lows and lower.
Is GOOG ready for bullish continuation?GOOG has had a good month thus far rising about 9% and relatively strong compared with
QQQ ( black line on chart) as shown on this one-hour chart. The past couple of days it has
rested in consolidation at the upper volume shelf on the profile. The stochastic RSI has the
lines low below the oversold /undervalued line of 25 and "curling up" suggesting they are about
to cross. The 24 hour running average volume indicator shows stable volume at a level higher
than April. No matter it may be overextended, GOOG has consolidated to base the next leg
up. Its high liquidity and low spreads make for a long entry of stock or call options.

GOOG - Breakout Falling Trend Channel- GOOG has broken through the ceiling of a falling trend channel in the medium long term.
- This indicates a slower falling rate initially, or the start of a more horizontal development.
- GOOG has support at 106 and resistance at 123.
- Positive volume balance strengthens the stock in the short term.
- Overall assessed as technically neutral for the medium long term.
*EP: Enter Price, SL: Support, TP: Take Profit, CL: Cut Loss, TF: Time Frame, RST: Resistance, RTS: Resistance to be Support LT TP: Long Term Target Price
*Chart Pattern:
DT - Double Top | BEARISH | RED
DB - Double Bottom | BULLISH | GREEN
HNS - Head & Shoulder | BEARISH | RED
REC - Rectangle | BLUE
iHNS - inverse head & Shoulder | BULLISH | GREEN
Verify it first and believe later.
WavePoint ❤️
