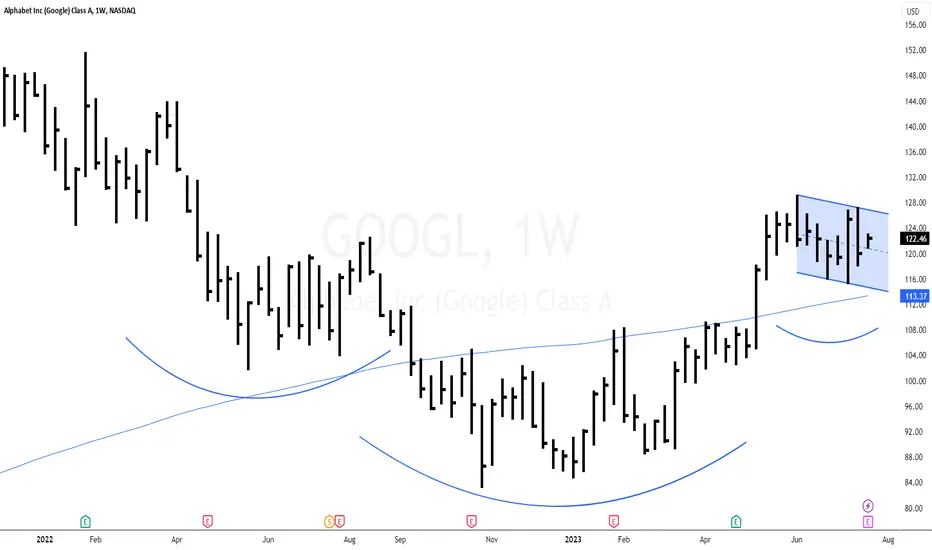
$GOOGl Technical AnalysisNASDAQ:GOOGL has several bullish patterns forming. There is a Bull Flag consolidating, there is inverse head & shoulders pattern, and NASDAQ:GOOGL is above the 150 day moving average showing an uptrend.
GOOGL
7 MEGA Cap Tech & QQQ SPY Analysis- GOOGL MSFT ER Tuesday AH
- META ER Wednesday AH
- Many Big names starting to weaken

QQQ SP500 7 Mega Cap Weekly time Frame Analysislots of weekly reversal patterns forming on these big names

GOOGL Alphabet Options Ahead of Earnings ! Sell-Off Thesis !If you haven`t sold GOOGL here:
or reentered here:
Then analyzing the options chain and chart patterns of GOOGL Alphabet Inc prior to the earnings report this week,
I would consider purchasing the 115usd strike price Puts with
an expiration date of 2024-1-19,
for a premium of approximately $6.15.
If these options prove to be profitable prior to the earnings release, I would sell at least half of them.
While Google currently holds a dominant position in the search engine market, the landscape is dynamic and subject to change. If Microsoft successfully leverages its partnership with OpenAI to enhance Bing's capabilities, coupled with strategic marketing initiatives, it could potentially chip away at Google's market share over time.
You can read my full GOOGL Sell-Off thesis here:
Looking forward to read your opinion about it.

Pt 2 of 7 Mega Cap Tech stocks | QQQ SPY Analysis- GOOGL MSFT ER Tuesday AH
- META ER Wednesday AH
lots of big techs shaping up enough room from its drop to shape up a daily downtrend now we will see how earnings come in to see if it shapes up.

Pt 1 of 7 Mega Cap Tech stocks | QQQ SPY Analysis- GOOGL MSFT ER Tuesday AH
- META ER Wednesday AH
lots of big techs shaping up enough room from its drop to shape up a daily downtrend now we will see how earnings come in to see if it shapes up.

Part 2 of 7 Mega cap Tech stocks | QQQ Sp500 AnalysisHourly downtrends confirm on all mega cap tech and QQQ/ SPY
will see if bears are serious about confirming daily and 4h downtrend in the next couple trading days.

Part 1 of 7 Mega cap Tech stocks | QQQ Sp500 AnalysisHourly downtrends confirm on all mega cap tech and QQQ/ SPY
will see if bears are serious about confirming daily and 4h downtrend in the next couple trading days.

Is it Time to HEDGE? QQQ Sp500, 7 Mega Tech Analysis- Even though we are quite extended on QQQ, bears still have no confirmed a hourly downtrend in the last 7 trading days that will be the first thing I will be looking for.
- As of now continue to follow the trends

GOOG - Rising Trend Channel [MID -TERM]🔹Breakout rising trend channel.
🔹Breakout resistance at 123, signals further rise.
🔹Technically POSITIVE for medium-term long-term.
Chart Pattern;
🔹DT - Double Top | BEARISH | 🔴
🔹DB - Double Bottom | BULLISH | 🟢
🔹HNS - Head & Shoulder | BEARISH | 🔴
🔹REC - Rectangle | 🔵
🔹iHNS - inverse head & Shoulder | BULLISH | 🟢
Verify it first and believe later.
WavePoint ❤️

Part 2 of All 7 Mega TECH stocks | QQQ Sp500 TREND GUIDE- I cant stress enough to follow the trend on these stocks, there will be a time to short when we see daily downtrend confirming
- FIRST STEP for bears is we need a hourly downtrend for anything to really happen
- As of now all mega tech are still healthy

Part 1 of All 7 Mega TECH stocks | QQQ Sp500 TREND GUIDE- I cant stress enough to follow the trend on these stocks, there will be a time to short when we see daily downtrend confirming
- FIRST STEP for bears is we need a hourly downtrend for anything to really happen
- As of now all mega tech are still healthy

Daily Market Analysis - THURSDAY JULY 13, 2023Key News:
UK - GDP (MoM) (May)
USA - Initial Jobless Claims
USA - PPI (MoM) (Jun)
Despite relinquishing some of its gains, the Dow Jones Industrial Average concluded Wednesday's trading session on a higher note. This positive finish was primarily attributed to a decline in Treasury yields and a surge in the tech sector, fueled by data indicating the slowest inflation increase in more than two years. The market sentiment has been uplifted by optimism that the forthcoming rate hike, scheduled for later this month, could potentially mark the conclusion of the tightening cycle.
The Dow Jones Industrial Average experienced a 0.25% climb, translating to a gain of 86 points. Meanwhile, the Nasdaq witnessed a robust increase of 1.2%, and the S&P 500 displayed a notable rise of 0.74%.
DJI indices daily chart
Nasdaq indices daily chart
S&P500 indices daily chart
In June, the consumer price index (CPI) registered a modest uptick, rising by 0.2% following a 0.1% increase in May. Additionally, the annual inflation rate eased from 4% to 3%, reaching its lowest point since March 2021. These figures suggest a reduced level of price pressures in the economy.
While there remains an expectation that the Federal Reserve will proceed with a rate hike later this month, the outlook for additional rate increases beyond July becomes less certain. The uncertainty stems from the possibility of upcoming economic data revealing a continued deceleration in inflation.
US Consumer Price Index (CPI)
Jefferies, in a recent note, highlighted the importance of upcoming economic indicators in determining the trajectory of rate hikes. If indicators such as the Employment Cost Index on July 28, along with employment and inflation data released in August, continue to exhibit a slowdown similar to the recent Consumer Price Index data, it suggests that the rate hike scheduled for July could potentially mark the conclusion of the current cycle.
In line with this sentiment, major technology companies, including Google (NASDAQ: GOOGL), Microsoft (NASDAQ: MSFT), and Meta Platforms Inc (NASDAQ: META), experienced a rebound following a recent downturn. This recovery was fueled by a significant decline in Treasury yields, driven by the expectation that the Federal Reserve's rate hikes are nearing their conclusion.
GOOGL stocks daily chart
MSFT stocks daily chart
META stocks daily chart
Microsoft's shares surged by over 1% as the tech behemoth made significant strides in the completion of its $69 billion acquisition of Activision Blizzard Inc (NASDAQ: ATVI), the renowned game developer responsible for the popular Call of Duty franchise. The acquisition received a boost as a Federal judge dismissed the Federal Trade Commission's request to delay the deal, citing insufficient evidence to support claims of potential competition harm. This favorable development played a crucial role in driving Microsoft's strong performance in the market.
US Dollar Currency Index daily chart
The sell-off of the US dollar gained momentum after the release of the CPI data, leading to a rapid approach towards the 100 level on the dollar index. This consistent and significant movement has positive implications for global inflation dynamics. A weaker US dollar tends to drive down energy and raw material prices, which are often denominated in US dollars. Consequently, lower prices for these commodities can help alleviate inflationary pressures on a global scale. In contrast, a strengthening US dollar contributes to inflationary pressures worldwide. Therefore, the depreciation of the US dollar can provide relief in the face of such pressures.
EUR/USD daily chart
In the currency markets, notable movements were observed. The EUR/USD pair experienced a surge, reaching the 1.1150 level, indicating a strengthening of the Euro against the US dollar. Similarly, the GBP/USD pair surpassed the significant 1.30 level, signaling a rise in the British pound against the US dollar. Conversely, the USD/JPY pair extended its decline, falling below the psychological level of 140, implying a weakening of the US dollar against the Japanese yen. These fluctuations highlight the dynamic nature of the currency markets and the interplay between different currency pairs.
USD/JPY daily chart
The anticipated release of the Producer Price Index (PPI) figures for June today is expected to provide further insight into the global economy's disinflationary trend. Forecasts suggest a significant deceleration in the headline PPI, dropping from 1.1% in May to 0.4% in June. The core PPI is also projected to experience a more modest slowdown, declining from 2.8% to 2.6%.
The weakening figures from the PPI may have implications for future Consumer Price Index (CPI) data, indicating a continued disinflationary environment. This reinforces the notion that the forthcoming rate hike in the United States will likely be the final one in the current cycle.
In summary, the June PPI numbers are expected to confirm the prevailing disinflationary trend in the global economy. The projected slowdown in PPI figures suggests potential effects on future CPI data and supports the belief that the upcoming rate hike will be the last one.

Part 2 of 7 Mega Cap Tech | QQQ Sp500 & My YINN playsAs long as we have mega cap techs holding sideways and rest of the market breath catching up it is good for the bulls and we may continue to see grind up from the market overall.
- Very first step i want to see from the bears is an hourly downtrend for me to even pay attention to a short swing.
- entered YINN for lagger bull play.

Part 1 of 7 Mega Cap Tech | QQQ Sp500 & My YINN playsAs long as we have mega cap techs holding sideways and rest of the market breath catching up it is good for the bulls and we may continue to see grind up from the market overall.
- Very first step i want to see from the bears is an hourly downtrend for me to even pay attention to a short swing.
- entered YINN for lagger bull play.

Part 1of 7 Mega Tech Stocks AnalysisAlthough QQQ closed flat today, lots of mega cap tech stocks formed daily downtrends, such as AMZN GOOGL AAPL, so we have to be open to QQQ having a slightly more pullback in the next coming days but breath in the market is really good today so its a good sign for the bulls as money rotates around.

Part 2 of 7 Mega Tech Stocks AnalysisAlthough QQQ closed flat today, lots of mega cap tech stocks formed daily downtrends, such as AMZN GOOGL AAPL, so we have to be open to QQQ having a slightly more pullback in the next coming days but breath in the market is really good today so its a good sign for the bulls as money rotates around.

Pt 2 of 7 Stock Market Turning Point? 7 MEGA tech QQQ Sp500lots of mega cap tech stocks & QQQ shaping up their Daily time frame lower highs pivots if we break Thursdays low many of them will form their first daily downtrend in a long time .

Pt 1 of 7 Stock Market Turning Point? 7 MEGA tech QQQ Sp500lots of mega cap tech stocks & QQQ shaping up their Daily time frame lower highs pivots if we break Thursdays low many of them will form their first daily downtrend in a long time .

Part 3 of 7 Mega Tech & QQQ Sp500 Stocks | Key BATTLE zone- QQQ did not set a new high after this move which is the first time in a while so theres a chance for bears to set a daily lower low but they need to show up fast or we are likely heading back to 52 week highs
- Team Clear Bull: TSLA AAPL MSFT
- Team Middle META AMZN
- Team indecision: NVDA GOOGL
- no Team Bear until i see some notable downtrends confirming on these big tech stocks

Part 2 of 7 Mega Tech & QQQ Sp500 Stocks | Key BATTLE zone- QQQ did not set a new high after this move which is the first time in a while so theres a chance for bears to set a daily lower low but they need to show up fast or we are likely heading back to 52 week highs
- Team Clear Bull: TSLA AAPL MSFT
- Team Middle META AMZN
- Team indecision: NVDA GOOGL
- no Team Bear until i see some notable downtrends confirming on these big tech stocks

Part 1 of 7 Mega Tech & QQQ Sp500 Stocks | Key BATTLE zone- QQQ did not set a new high after this move which is the first time in a while so theres a chance for bears to set a daily lower low but they need to show up fast or we are likely heading back to 52 week highs
- Team Clear Bull: TSLA AAPL MSFT
- Team Middle META AMZN
- Team indecision: NVDA GOOGL
- no Team Bear until i see some notable downtrends confirming on these big tech stocks

Pt 2 7 Mega Tech stock | QQQ Sp500 AnalysisGOOGL back to team bull. Every mega tech is back to team bull expect NVDA formed an hourly downtrend and AMZN still chopping around
