Detail Price Level Trend Guide | NVDA TSLA AAPL AMZN GOOGL MSFT- NVDA short term 15m time frame bull break lacking follow through then weaker compare to QQQ into end of day on Friday
- TSLA still relative stronger than QQQ gap filled 4h 12 EMA still full bull control guide
- AAPL zero red flags trading around ATH, 2 day time frame 12 EMA full bull control guide
- AMZN weaker of the big tech closed right at support into end of day potentially may break below it on Tuesday
- GOOGL weakest of the big tech, may form a daily downtrend if we break prior pivot 121 level
- MSFT similar to AAPL trading in ATH range, no red flags yet need to confirm hourly downtrend for bears, for bulls still in full control.
GOOGL

Key Level Chart for $GOOGL | Fibonacci and Pivot PointsThese charts are good for swing traders, position traders and long term investors.

6 Big Tech Stocks Price Action Trend Guide |Support & Resistance- QQQ and SPY still very healthy pull back on the daily chart. although QQQ is definitely extended, but still want to see bears prove it to us first in the price action (changing of trends)
- TSLA relative strength compare to QQQ filled its gap.
- AMZN and GOOGL weaker, still cant get over its side ways range.
- MSFT and AAPL trading in its ATH range no red flags at all on its charts yet
- NVDA small red flag break of yesterdays double top with no bulls follow through and came back into the range, still need structural changes on the daily chart for it to really have any meaning
- AMD daily downtrend confirmed today

Top 3 AI stocks NOT to buy now | Stock Market Price Level Guide - QQQ and SPY still complete full bull control cant remember the last time bears confirm a hourly downtrend.
- TSLA relative weaker to QQQ today
- AAPL and MSFT lead bull leading the market today, ALL time highs
- GOOGL and AMZN weaker of the techs today
- NVDA also weaker with double top from yesterday
- im shorting SOXX so buying SOXS and would like to see AVGO AMD NVDA potentially fall here, if not ill stop out small from todays highs sideways range.

NVDA TSLA AMZN GOOG MSFT AAPL QQQ Sp500 Detail Price Level Guide- NVDA ATH in price discovery mode
- TSLA relative weaker than QQQ today potentially need some consolidation for the bulls after a fast move.
- GOOGL weakest of all Tech still in range for potentially daily bearflag
- MSFT AAPL testing 52 week high resistance
- QQQ zero signs of bear still, need AT LEAST an hourly downtrend for anything to happen
- SPY weaker than QQQ today but zero red flags still at the moment same thing n

I'm not that techno-optimistic. I tend to share the view that the tech sector at SPX is pulling the whole S&P company's along with it in many ways.
Consideration of the whole SPX for a while loses its meaning, separation is necessary.
Let's group a few big horses together and see what's out there.
Okay:
NASDAQ:AAPL*NASDAQ:NVDA*NASDAQ:GOOGL*NASDAQ:MSFT*NASDAQ:META
could be more, but I think that would be quite telling.
Oh my God, Carl...
99.2%
The last time this overbought was in 2019.
And you think these guys will go even higher without a correction?

Google vs BingIf you haven`t sold GOOGL here:
Or bought it here:
Then you should know that the investment by Microsoft in OpenAI signifies a significant boost to their artificial intelligence capabilities. OpenAI's advanced technologies and expertise in AI research and development could potentially enhance the capabilities of Microsoft's Bing search engine. With access to powerful AI algorithms and resources, Bing may be able to offer more personalized and accurate search results, thereby attracting users who seek a more refined search experience.
Furthermore, Microsoft has been making strategic moves to expand its presence in various sectors, including cloud computing and enterprise services. By integrating Bing into its ecosystem of products and services, Microsoft can leverage its existing user base and partnerships to promote Bing as a viable alternative to Google.
In recent years, Google has faced scrutiny over data privacy concerns and antitrust issues, which could create an opportunity for Bing to gain traction among users seeking more privacy-focused alternatives. Additionally, Microsoft has been actively investing in marketing and advertising efforts to raise awareness about Bing and improve its market positioning.
While Google currently holds a dominant position in the search engine market, the landscape is dynamic and subject to change. If Microsoft successfully leverages its partnership with OpenAI to enhance Bing's capabilities, coupled with strategic marketing initiatives, it could potentially chip away at Google's market share over time.
If I had to buy some options, that would be the following puts:
2024-1-19 expiration date
$105 strike price
$3.25 premium
Looking forward to read your opinion about it!

TSLA NVDA AAPL GOOGL AMZN MSFT | Detail Price Levels Trend Guide- TSLA bulls 4 hour time frame 12 EMA full bull control, Bears need to form a hourly downtrend as first step
- NVDA bull break lacking follow through, bears still need to confirm that hourly downtrend as well
- AAPL holding 2 day time frame EMA 12 full bull control
- GOOGL MSFT AMZN - potentially shaping up a daily downtrend

TSLA GOOGL AMZN NVDA AAPL MSFT |Sp500 QQQ Detail Market Analysis- TSLA extended to resistance, but still full bull control on 4h 12 EMA
- GOOGL MSFT AMZN potentially shaping up a daily downtrend
- AAPL strongest of big techs holding up still 2Day EMA 12 bull control guide
- Sp500 held support that was prior resistance
- QQQ 5th reject from golden pocket zone if big techs confirm daily downtrend QQQ wont be able to hold

TSLA AAPL NVDA GOOGL AMZN | Sp500 QQQ Market Price LEVELs Guide- TSLA CLEAR 12 EMA 4 hour time frame support guide
- NVDA falling Wedge Guide
- GOOGL Lead Bear of big tech bull break with no follow through on Monday
- AMZN potential setting a lower high on daily
- AAPL stronger big tech 2 day time frame EMA 12 perfect support guide

TSLA NVDA GOOGL AMZN AAPL MSFT | QQQ SPY Price Levels Analysis- TSLA still relative strength compare to QQQ once we lose that strenth daily consolidation might be on its way.
- NVDA likely testing 366 soon, will be interesting to see the price action when we come to the gap territory
- GOOGL back to low of its chop zone support range- bull break lacking follow through
- AAPL still in daily uptrend holding better than its peers
- MSFT also weak losing its daily uptrend now neutral trend.
- QQQ still have daily uptrend intact
- SPY no red flags today held very well despite QQQ weakness money rotate into SPY sectors and IWM.
- VIX barely moved much due to money rotating around need every sector to drop for VIX to spike fast

GOOGL:A Compelling Investment Opportunity with Growth CatalystsAlphabet, with its heavy reliance on digital advertising, faces challenges during weaker economic periods. However, its recent revenue growth slowdown of 3% reflects the current macroeconomic conditions. To address this, Alphabet is implementing cost-cutting measures, including significant layoffs.
Despite these challenges, Alphabet's shares have seen a 40% increase in 2023, albeit remaining 17% below their all-time high. The question arises: Is Alphabet a good investment? The answer is a resounding yes, and here's why.
Google Search, contributing 58% of Alphabet's ad revenue, maintains an overwhelming global market share of 92.8%, while competitors like Bing struggle to gain traction. Thus, Google's dominance remains secure.
Alphabet's Google Cloud Platform (GCP) shows impressive growth, with revenue increasing by 28% year over year, outpacing Amazon Web Services (AWS). GCP's recent achievement of its first operating profit indicates further potential for increased profitability.
Alphabet's commitment to artificial intelligence (AI) is evident, enhancing search capabilities, providing real-time updates, and combating spam. The integration of AI across Workspace products and tools demonstrates Alphabet's ongoing commitment to innovation.
The Other Bets segment, including Waymo, Alphabet's autonomous driving unit, is making strides. The recent partnership with Uber expands Waymo's reach and paves the way for mass adoption of autonomous driving technology.
Despite the surge in shares, Alphabet's valuation with a trailing P/E ratio of 27.6 and forward P/E ratio of 23.2 appears reasonable, considering its dominant position and growth catalysts.
Alphabet generated $17.2 billion in free cash flow, showing a 12% increase, and maintains a robust balance sheet with $115 billion in cash and securities, enabling it to pursue new initiatives.
Considering these factors, Alphabet presents an attractive investment opportunity and can serve as a core holding in a long-term portfolio strategy.

S & P: Macro Bull Flag Consolidation?If you zoom out on the S & P 500, the measured moves and fibs line up fairly perfectly and in my opinion
paints a more realistic picture as far as expectations for the market moving forward. It is hard for me to see
this market going market going all that much higher at all. With blow off top type price action in names like NVDA
and the recent price action in AAPL, this type of price action makes the most sense to me.

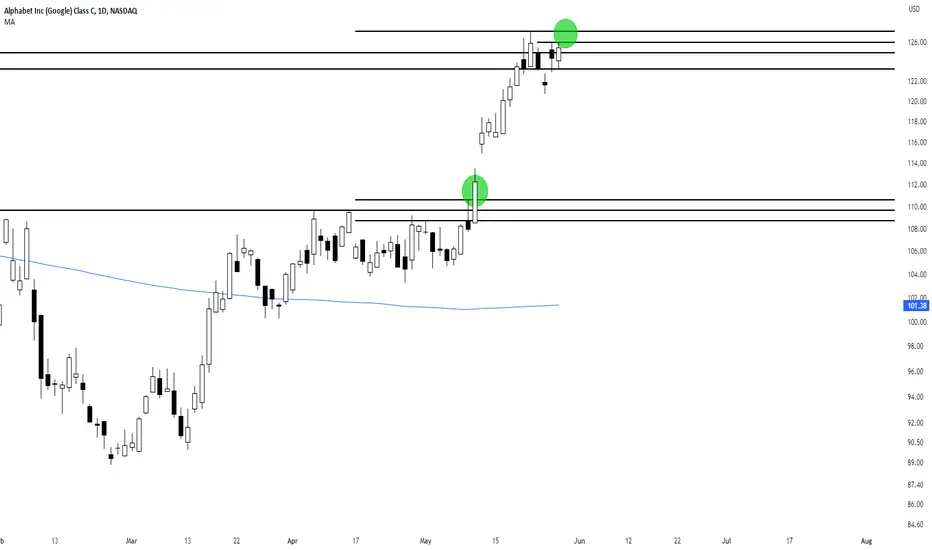
New Google Pivot New long pivot on NASDAQ:GOOG forming around $127. Watch todays price action for confirmation.
Previous move through the pivot saw Google advance from $110 to $127.
NVDA TSLA MSFT GOOGL AAPL AMZN | Support & Resistance Guide- Support & Resistance guide for all 6 big tech stocks NVDA TSLA MSFT GOOGL AAPL AMZN
- psychological 1 trillion dollar level for NVDA 405
- TSLA wedge pattern still in play
- zero red flags on the chart for MSFT and AMZN need hourly downtrends to confirm for any signs of bears

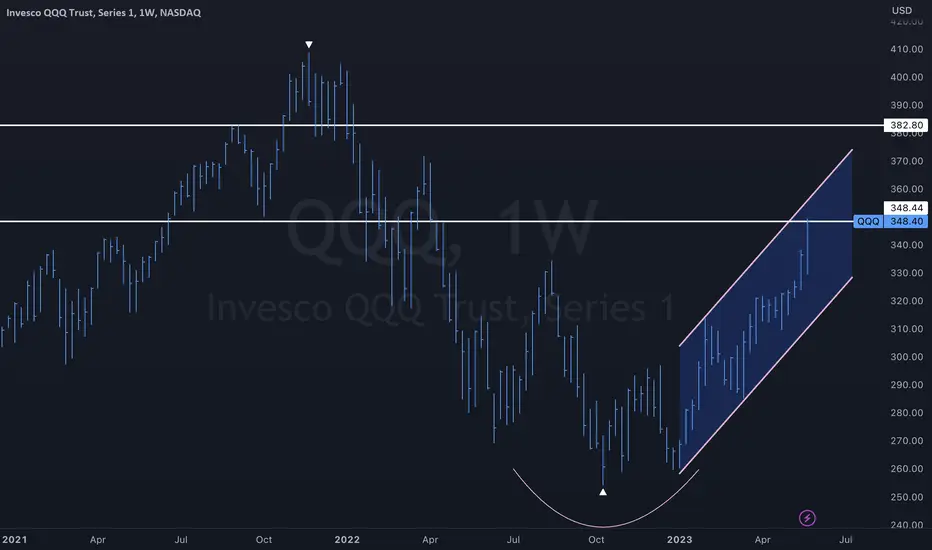
$QQQ Parallel channel uptrend NASDAQ:QQQ parallel uptrend continues into resistance. Holiday hangover next week should be light volume which favors the upside.
$QQEW Inverse head n shoulders NASDAQ:QQEW Inverse head n shoulders ready to break out. it needs to consolidate next week before it can break out. equal weight nasdaq 100

Google - nice short setup is cookingI count GOOGL as start of wave circle C of iv where wave (1) is done and a pb in wave (2) is in action. Wave (2) is shortable from the 100 zone. A=C rule gives us a target of 60 for the whole wave iv correction. Would be a great long opportunity sometime in 2024-25. Longer-term count will be posted separately.

AI strategy drives NVDA MSFT GOOG METAAs we navigate through the ever-evolving world of technology, it is becoming increasingly evident that artificial intelligence (AI) is the driving force behind some of the biggest players in the market. Companies such as NVIDIA (NVDA), Microsoft (MSFT), Google (GOOG), and Meta Platforms (META) have all implemented AI strategies that have propelled them to the forefront of their respective industries. In this email, we will explore how these companies are utilizing AI to gain a competitive edge and what it means for their future growth potential. So, buckle up and let's dive into the world of AI and its impact on the stock market.
Additionally, it's crucial to have a long-term investment strategy and to not make emotional decisions based on short-term market fluctuations. It's also wise to diversify your portfolio across different industries and sectors to minimize risk. Seeking the advice of a financial advisor can also be helpful in making informed investment decisions.
Additionally, it's important to have a long-term investment strategy and not make emotional decisions based on short-term market fluctuations. It's also wise to consider factors such as the company's financial health, industry trends, and management team before investing in individual stocks. Diversification is key to managing risk, so it's advisable to have a mix of individual stocks and diversified portfolios in your investment portfolio. Finally, seeking the advice of a financial advisor can help you make informed investment decisions and manage your risk effectively.

AMZN TSLA NVDA MSFT GOOGL AAPL Technical Analysis Guide- Most tech stocks are still in a healthy daily uptrend but most are testing its support area.
- the size of the pull back will be key for me to determine if we have more fuel for these stocks on the upside
- larger pullback size will allow bears to make moves on the next bounce

The Alpha in Alphabet Google
MACD Cross Historic Performance
July 2009 – 6 months – 48%
Sept 2010 – 5 months – 43%
Nov 2011 – 2 months – 19%
Jul 2012 – 3 months – 37%
Sept 2015 – 5 months - 31%
Mar 2017 – 3 months – 21%
Oct 2019 – 4 months – 25%
Apr 2020 – 5 months – 59%
Min return = c.19% over 3 months (least risky)
Max return = c.50% over 5 months
Average Overall = c.35% over 5 months.
Average return of the 8 past MACD crosses above is 35%. We have projected a modest 20% increase 2 to 3 months post MACD cross (Likely July/August bid). That’s IF we get the cross in then. Worth noting we are about 20% away from the ATH of $151. Keep in mind that a MACD cross is a lagging indicator so we try and anticipate the cross scenario.
Given the history of price in this long term parallel channel since Nov 2008, an incredibly idyllic scenario would be a revisit of the bottom of the channel or a revisit of the 50 month smooth moving average(SMA) in purple. If we ever revisited the 50 Month SMA or 200 week SMA I believe this would be a major opportunity, given this has only occurred 4 times in almost 15 years.

Overvalued Tech: Time for Tangible Assets & Fair ValuationsThe tech sector, specifically the 'Big Tech' companies have seen massive gains since the massive accumulation in 2010-2014. However, these increases seem disconnected from the companies' actual value or tangible contributions to the real-world economy. Their high price-to-earnings ratios suggest overvaluation and potential for a market correction.
Invest in sectors with real-world utility and reasonable valuations - Allocate capital to sectors like industrials, materials, consumer staples, or healthcare. These sectors provide tangible products and services and often have more reasonable valuations.
1. High Valuations: Tech stocks, in particular, often trade at high multiples of their earnings or revenues. These high valuations can make them more vulnerable to market downturns, as they can fall more dramatically if investors reassess their growth prospects or risk tolerance.
2. (GOOGL, APPL, AMZN, MSFT, META, NVDA, ADBE, and TSLA) all represent a significant portion of the SNP-500 index due to their large market capitalizations.
3. So, in a S&P-500 meltdown , these tech companies could potentially see significant declines in their stock prices due to these factors. However, it's important to remember that the specifics would depend on a wide range of factors, including the reasons for the market downturn, the companies' financial health and growth prospects, and overall investor sentiment.
4. I would choose Tesla as the only pick out of all 8 as this company has shown lots of potential compared to our tech giants of the now. Even with the upbringing of AI it is not enough to save google or meta, but Apple and Microsoft might hold up strong as they are largest caps.
5.
Google (Alphabet) : ~$1.5 trillion
Apple Inc. (AAPL): ~$2.5 trillion
Amazon (AMZN): ~$1.7 trillion
Microsoft (MSFT): ~$2.2 trillion
Meta Platforms : ~$1 trillion
NVIDIA (NVDA): ~$500 billion
Adobe (ADBE): ~$300 billion
Tesla (TSLA): ~$800 billion
TOTAL = 10 Trillion roughly

Google: Reversal Incoming?Here we are looking at GOOGL on the Daily TF...
Currently, there is a lot of factors aligning on the GOOGL chart, which is the type of confluence I look for when evaluating trade opportunities. The first factor that I'm looking at is the horizontal resistance line as shown on the chart. This resistance stretches from it another local high made months prior. This should act as strong resistance. The second factor I'm looking at is that there is a time count of 7 consecutive green daily candles, which is something I look to pair with a strong resistance zone (as previously mentioned). The third and final factor that aligns on this chart is a potential topping tail being put it. This hasn't confirmed yet, but there is a strong chance that it will.
I will continue to monitor this chart, and provide timely updates as I see fit!
Cheers
