GOOGLCalls can work over 2800. Levels above 2800 are 2818, 2826, 2847.
Trade Idea: 2815C 10/8 *lotto (high risk)
GOOGL

Market Pulse How I made MONEY today Money Makers today
Potential Setups
Hi Volatility stocks trading 15 min
Market Posture
SPX
NDX
RUT
HI VOL
GOOGL
AMZN
TSLA
ISRG
CMG

Google, 7 OCT - Elliott waves | Gann | Astrology $GOOGAlphabet, as expected, bounced off the 20 week MA (in red), and we closed longs at Gann level 2651. But the count hints at more downside in the mid-term.
Since the ATH, price declined in ABC patterns, so that we can assume a WXY or a complex ABC is unfolding.
If correct, sellers may step in at the 20D MA again. A possible area is the blue box (.618 to .786 Fib).
Ascendant conjuncts natal Jupiter on 9 OCT. The following trading days 11-12 OCT have higher probability for bearish price action. We may watch out for an expansion of volatility again. A short idea could be interesting at that point, however needs further confirmation.
______________
www.constellations.trade
In my analyses I combine Elliott waves, Gann theory, and planetary aspects to identify turning points in the markets & derive high-probability trading ideas. The strategy is to build leveraged exposure when markets are likely to expand, and to use options premium decay for consistent income when markets may contract and range.
Open an account here if you'd like to support my work:
TastyTrade
America's best Options, Futures and Crypto broker
start.tastyworks.com
Deribit
The world's most liquid Bitcoin options platform
www.deribit.com
Binance
10% off trading fees with this link:
accounts.binance.me
These abbreviations in the chart describe ideas that are provided as educational information and do not constitute financial advice:
STO = sell to open
BTC = buy to close
BTO = buy to open
STC = sell to close
TD = Theta Decay (for example a strangle or iron condor)
Disclaimer:
The views and ideas expressed in this analysis are that of the maker. They are provided as educational information and do not constitute financial or trading advice.

OCT 6 MARKET PULSEHi Volatility stocks trading 15 min
Market Posture
SPX
NDX
RUT
HI VOL
GOOGL
AMZN
TSLA
ISRG
CMG

Mid-Day Pulse Money Makers Hi Volatility stocks trading 15 min..
All road lead back to 50
Market Posture
SPX
NDX
RUT
VIX
HI VOL
Googl
Amzn
Tsla
Isrg
Cmg

Mid-Day Market Pulse Money makersTrading the Hi Vol stocks on 15 min time frame
SPX
RUT
NDX
GOOGL
AMZN
CMG
ISRG
TSLA

GOOGLE Alphabet | Fundamental Analysis + NEXT TARGET Alphabet, the parent company of Google, is one of the largest technology businesses in the world. If you had invested $1,000 in the company's IPO back then, your investment would be worth about $63,500 today.
That's great news for early investors, but those who don't already own Alphabet may wonder if it's too late to buy stock in this FAANG company. Today we'll look at a few convincing judgments to buy Alphabet, as well as one reason to sell it, to see if it's still a good long-term investment.
First, the company is a powerful energy in online advertising.
Alphabet's expansive ecosystem includes the world's most popular search engine, a mobile operating system (Android), a streaming video site (YouTube), a Web browser (Chrome), and an e-mail platform (Gmail).
All of these platforms support Google's core advertising business, which sells search, display, and video ads on all of its platforms. According to eMarketer, Google is likely to account for 28.6 percent of all digital ad spending worldwide this year, putting it in the first place, ahead of Facebook's 25.2 percent.
All of Google's smaller competitors and Facebook - such as Alibaba, Amazon, and Tencent Holdings - still hold single-digit shares of the digital advertising market. So any business looking to advertise online is likely to visit Google and Facebook before considering other platforms.
Last year, Alphabet's ad revenue from Google grew 9% to $146.9 billion, or 80% of the company's total revenue, even though the pandemic caused businesses to buy fewer ads. In the first half of 2021, Google's ad revenue grew 50% year over year to $95.1 billion as the negative factors associated with the pandemic subsided.
Second is the growth of Google Cloud.
Google's advertising business slowed temporarily in 2020, but Google Cloud revenue grew 46% to $13.1 billion as cloud usage accelerated during the pandemic. In the first half of 2021, segment revenues grew another 50% year over year to $8.7 billion.
Google Cloud is not yet profitable, according to Canalys, and it still ranks a distant third in the cloud infrastructure market behind Amazon Web Services (AWS) and Microsoft Azure.
But Google Cloud continues to expand and win over an expanding listing of major partners, including Target, Home Depot, Twitter, and PayPal. Many of these customers probably don't want to support Amazon's most profitable business (as they compete with its retail business) or tie themselves to other Microsoft enterprise services.
Google Cloud's profitability should expand as it improves, but until then it can subsidize its growth with its more profitable advertising business. According to Research and Markets, the global cloud computing market will grow at a compound annual growth rate (CAGR) of 19.1 percent from 2021 to 2028, so Google's cloud business could grow faster than its core advertising business for the foreseeable future.
Third, it's a reasonable valuation of the company.
Analysts expect Alphabet's revenues and profits to grow 37% and 72%, respectively, this year, amid an easy comparison to the impact of the pandemic on the advertising business. Next year, they expect revenues and profits to grow 17% and 5%, respectively, as comparisons with last year normalize.
Based on these expectations, Alphabet is trading at 26 times earnings guidance and 7 times sales guidance, making it more reasonably valued than many of the more "bloated" growth stocks in the tech sector.
But there is still one cause for concern: antitrust risks.
Alphabet's core businesses look strong, but a series of antitrust battles could undermine its growth.
Last October, the U.S. Department of Justice filed an antitrust suit against Google for allegedly monopolizing the online search and search-based advertising market, and is reportedly preparing to file a second antitrust suit to address Google's dominance in certain advertising technologies. Two separate coalitions of states have also filed their lawsuits against Google over its search and advertising business.
The European Commission previously investigated Google Shopping, Google AdSense, and Android, after which it accused Google of using these platforms to drive competitors out of their respective markets. These antitrust investigations led to three separate fines totaling more than $8 billion and forced Google to stop bundling its third-party apps with new Android devices in Europe. If the DOJ case follows a similar path, Google could face even more fines and demands to unbundle its ecosystem.
Google also bears additional antitrust encounters in Australia, India, and South Korea, and more countries may join the process. All of these pressures could prevent investors from paying a higher premium for Alphabet stock.
Alphabet's antitrust problems can't be ignored, but they don't negate its strengths just yet. Alphabet will likely continue to grow, even if fines and new restrictions get in its way.
In a worst-case scenario, Alphabet could be split into several smaller companies. Nevertheless, Alphabet investors would likely get new shares of these smaller companies that could continue to grow on their own without being tied to Google's sprawling ecosystem.

in 15min A high probability of market reversalas the chart showed there is a break in the resistance so it can be return to up
Also the pitchfork gives a good return sign

Google, 1 OCT - Elliott waves | Gann | Astrology $GOOGAlphabet approaches Gann level 2651 and we can count 5 waves to the downside (green count).
The 20 week MA (red) is located below at 2630.
An idea would be to reduce short exposure on Gann level and further observe if buyers step in.
Ascendent conjuncts natal Mercury today, however it stands in trine to natal North Node. Mars squares natal Venus on 2 OCT. Overall rather mixes signals.
Alphabet’s Waymo received a license to offer self-driving rides in California, an important development for the company. Until 8 OCT the Irish govt. is to decide on joining OECD corporate tax proposals, which may impact Alphabet’s margins so that we need to be careful with long positions.
______________
www.constellations.trade
In my analyses I combine Elliott waves, Gann theory, and planetary aspects to identify turning points in the markets & derive high-probability trading ideas. The strategy is to build leveraged exposure when markets are likely to expand, and to use options premium decay for consistent income when markets may contract and range.
Open an account here if you'd like to support my work:
TastyTrade
America's best Options, Futures and Crypto broker
start.tastyworks.com
Deribit
The world's most liquid Bitcoin options platform
www.deribit.com
Binance
10% off trading fees with this link:
accounts.binance.me
These abbreviations in the chart describe ideas that are provided as educational information and do not constitute financial advice:
STO = sell to open
BTC = buy to close
BTO = buy to open
STC = sell to close
TD = Theta Decay (for example a strangle or iron condor)
Disclaimer:
The views and ideas expressed in this analysis are that of the maker. They are provided as educational information and do not constitute financial or trading advice.

Google, 29 SEP - Elliott waves | Gann | Astrology $GOOGAlphabet hit resistance at Gann level 2861 and began to lead the market in yesterday’s selloff. As expected from the Nasdaq analysis we can recognise an unfolding wave (c), which is reflected in GOOG as well.
If the green count is accurate, GOOG may have completed wave iii, so that we can look for a potential wave iv with a retrace to the .382 Fib level (blue box).
Waves 4 are hard to trade but due to their choppiness we may profit from a brief contraction of implied volatility when selling premium.
If wave C continues to unfold we may look at the next levels for potential supports:
- 2699, wave (a)=(c) equality
- 2651 Gann level
- 2549 and 2559, Gann level & 1.618 Fib level
On 29 SEP three minor Mars/Moon constellations occur.
Correlations: DXY continues its exceptional strength as yield spiked, but Gold and Bitcoin has started to rise again, which could potentially be an early indicator that USD may begin to slow. EURUSD is at support level as well. A declining USD would help the yield-sensitive tech sector.
______________
www.constellations.trade
In my analyses I combine Elliott waves, Gann theory, and planetary aspects to identify turning points in the markets & derive high-probability trading ideas. The strategy is to build leveraged exposure when markets are likely to expand, and to use options premium decay for consistent income when markets may contract and range.
Open an account here if you'd like to support my work:
TastyTrade
America's best Options, Futures and Crypto broker
start.tastyworks.com
Deribit
The world's most liquid Bitcoin options platform
www.deribit.com
Binance
10% off trading fees with this link:
accounts.binance.me
These abbreviations in the chart describe ideas that are provided as educational information and do not constitute financial advice:
STO = sell to open
BTC = buy to close
BTO = buy to open
STC = sell to close
TD = Theta Decay (for example a strangle or iron condor)
Disclaimer:
The views and ideas expressed in this analysis are that of the maker. They are provided as educational information and do not constitute financial or trading advice.

Mid-day PUlSE Hi vol money making stocks 15 minEveryday looking for entries on these momentum beauties
SPX
NDX
RUT
GOOGL
AMZN
TSLA
CMG
ISRG

$TCEHY / TENCENT has bottomed- Inverse H&S
- High volume
- Support from 200 WMA
- Support from trend line
- Oversold RSI
What else bottoming out needs? Nothing IMO.


TSLA vs. GOOGL ComparisonIf youve been wondering what to do with your GOOGL Shares it may be time to reallocate and increase Exposure to TSLA


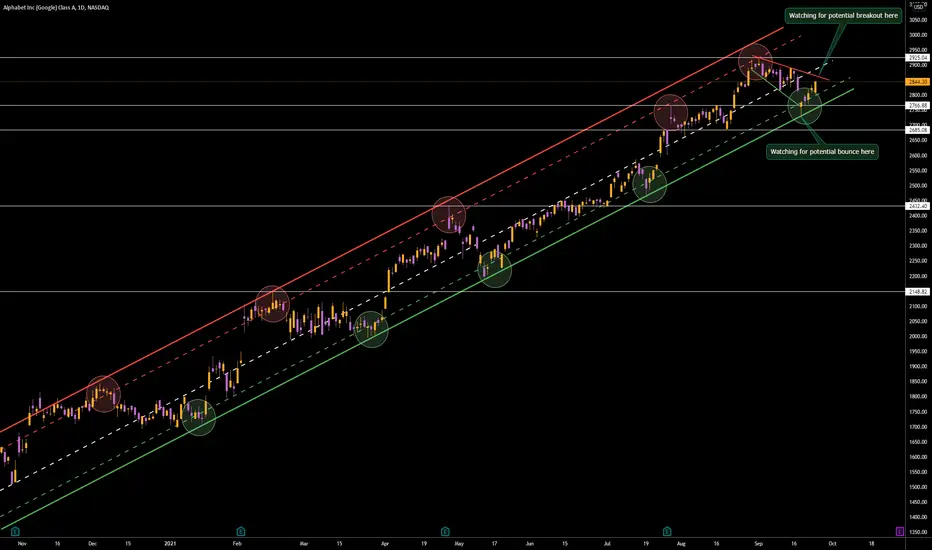
$GOOGL | WEEKLY WATCHLIST 9/27Another name that we called the bottom on perfectly. No changes since the last time I posted. Bounced exactly where I showed on the chart. Now, looking for breakout above the red resistance line. Please note the descending broadening wedge pattern which is BULLISH!
Looking to enter a long position on break above red resistance line to test $2900 and ATH.
The Pulse (Bear and Bulls Opportunities)Bear and Bulls Opportunities and setups in High Volatile stocks
Bear and Bulls Opportunities and setups in High Volatile stocks
0:00 15 min setups
-Apple 6:59
-Crypto 9:50
-NFLX 11:22
-INDEX Daily 12:24

9/21/21 Mid-day Pulse Opportunities ahead of the FEDMid-day Market Pulse.... what to expect ahead of the FED

Market Pulse September 20, 2021 All Road lead back to the 50Market Pulse ...How low do we go? Where are the next opportunities?

Google - Bearish Doji Star & Toppy RSITitle is self-explanatory.
A bearish doji-looking candlestick formation.
Combined with very toppy RSI metrics.
All taking place on the weekly chart.

$GOOGL - Up and to the right - boring chartGoogle's chart is about as boring as it gets. Very tight channel up and to the right. Great long-term hold.

Mid-Day Pulse Sept 16, 2021 SPX ROLL WEEKMid-Day Pulse , SPX roll week. And then Rebalancing tomorrow LAST DAY . Where did we go from here ?

