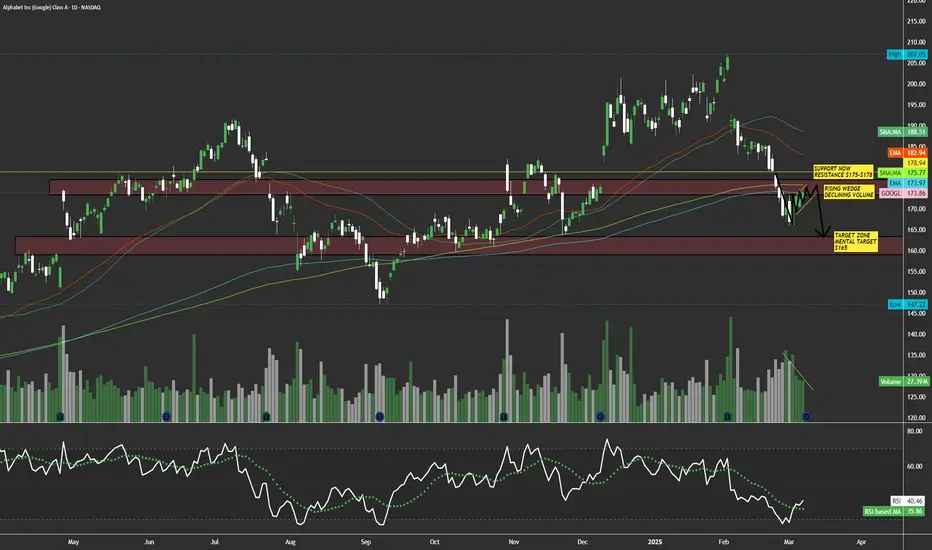
$GOOGL Rising bearish wedge with declining volume; $165 belowNASDAQ:GOOGL here looks weak to me trying to reclaim it's support of $175-$180. This is on my watchlist for a short term short, if this name tanks back into the $150's I will load everything I got for the long side. I see this name in a downside trend currently in a rising wedge with declining volume, buyers can't hold it up much longer. It's retested that support on 3 or more daily candles and hasn't busted through. I expect this name to drop into a support zone of $160-$165. I will look to enter puts off a retest of $176-$178 area keeping the stops tight.
WSL.
GOOGL
Stock Market Forecast | TSLA NVDA AAPL AMZN META MSFTStock Market Forecast | NASDAQ:QQQ AMEX:SPY
Mag 7 Forecast | NASDAQ:TSLA NASDAQ:NVDA AAPL AMZN META MSFT GOOGL

Alphabet Inc. (GOOGL) – Bullish Reversal Opportunity📉 Google stock has corrected ~16.9% from its $207 high last month, now testing a strong trendline support.
With bullish RSI divergence and major AI investments ahead, this could be a prime buy-the-dip opportunity!
📊 Trade Setup:
🔹 Entry Price: $171.80 (Current Price)
✅ Take Profit 1: $190 (Short-term resistance)
✅ Take Profit 2: $207 (Previous high)
✅ Take Profit 3: $220+ (Analyst average price target)
🔹 Stop-Loss: $165 (Below trendline)
🔹 RSI: Bullish divergence – signaling potential upside momentum
📈 Why Google?
AI & Cloud Expansion – $59B AI revenue expected by 2028 (Morgan Stanley)
Waymo Growth – Autonomous vehicle expansion into Miami (2026)
YouTube & Digital Ads – Performance Max driving revenue gains
Strong Cloud Business – Competing with AWS & Microsoft Azure
🔹 Analyst Insights:
Average Price Target: $210.62, implying a 23.66% upside from the current price.
High Price Target: $250.00, suggesting significant growth potential.
Consensus Rating: Moderate Buy based on evaluations from 43 analysts.
🔹 Regulatory Caution: DOJ lawsuits are a concern, but long-term AI & cloud growth remain strong.
📌 Key Levels to Watch:
Holding support at $165? This could trigger a major upside move.
Break above $190? Momentum could accelerate toward $207+
📢 Google is not just a search company—it’s an AI, cloud, and automation powerhouse. With strong support, favorable analyst forecasts, & major catalysts ahead, this could be a prime accumulation zone! 🚀

Google Likely On SupportGOOGL is likely finding support on $174. It's following the panic trend right now as almost everything Computer/Tech has been sold deep into support bids. GOOGL finding support here along with AMZN at $214 leads to my theory IXIC is ready to break resistance.
If it fails to hold $174, then the major support at $148 should lift it back up towards it's final target (or next major support) of $252.
Good luck!

New highs area +$1,000/share unlocked for NasdaqSeems like 2 months of sideways downtrending (since mid December) is over for Nasdaq.
Unless any surprise political shock news come out (we all know that can be a challenge with Trump) we could see Nasdaq reach $23,000 per share area in drawn upcoming green period.
This would also reflect directly on upward momentum for several bluechip stocks:
Apple Inc. NASDAQ:AAPL
Microsoft Corporation NASDAQ:MSFT
Amazon.com Inc. NASDAQ:AMZN
Alphabet Inc. NASDAQ:GOOGL
Meta Platforms Inc. NASDAQ:META
NVIDIA Corporation NASDAQ:NVDA
Tesla Inc. NASDAQ:TSLA
Intel Corporation NASDAQ:INTC

$GOOGL .... LETS GET LOUD!!!Within the last month, we have watched NASDAQ:GOOGL get absolutely crushed, most of which has to do with a generally weak earnings report in early February. However, skepticism of this price action and investor sentiment is the only thing that should be on anyone's mind right now. One thing we know for a fact is that Google isn't going anywhere especially considering all the data they collect on their users. So why not apply this reasoning into buying the dip? To answer that, we should Look First/Then Leap ...
Here is the 4 Hour chart refencing back into September of 2024.
Let's start with the circle. The reason I have the area marked is because of the key factors in play that indicate we may possibly be bottoming out on this timeframe. Firstly, there are two lines to keep an eye on, a diagonal trendline and a horizontal price-level line. NASDAQ:GOOGL 's price action seems to obey these two levels (for whatever reason), which are coincidentally in the same area at the same time. Secondly, NASDAQ:GOOGL has just shown a rebound from the 400 EMA which also falls within this area giving a sort of "stars aligning" situation here. But the price action doesn't have to be the only thing we examine to analyze $GOOGL.
This is the MACD indicator on the 4 Hour timeframe referencing back to September of 2024.
This MACD chart shows the comparison between the last regional low for the MACD compared to the recent regional lows. Between these lows there is an interval of 76 to 78 calendar days (just over 2 and a half months) if I am not mistaken, which should strike some traders as very odd considering their similarity in distance. Amazingly, that's not even the weirdest part...
This is the combination of both charts.
How about that? Not only are the lengths between regional MACD lows similar, but NASDAQ:GOOGL 's returns between these periods are only roughly 2/3% in difference to each other. This just shows that there is more that what meets the eye when it comes to charting. Always look where others don't because that's where some keys are found.
In conclusion, I will be taking a long position on NASDAQ:GOOGL for the reasons stated above. When stars align like this, we are given no option but to act upon our rationality instead of our emotions...

Alphabet (GOOGL) Stock Drops 10% – What's Behind the Decline?Alphabet (GOOGL) Stock Drops 10% – What's Behind the Decline?
As the stock chart for Alphabet (GOOGL) shows, on 4 February, the share price reached a historic high above $205. However, despite surpassing analysts’ expectations, GOOGL shares dropped sharply after the earnings report was released:
→ Earnings per share: actual = $2.15, forecast = $2.12
→ Gross revenue: actual = $187.8 billion, forecast = $187.3 billion
As a result, GOOGL's current price is approximately 10% below its all-time high. Market sentiment may have turned negative due to several factors:
→ Cloud revenue fell short of expectations, raising concerns about Alphabet’s ability to compete in the rapidly evolving AI sector.
→ Weaker-than-expected advertising revenue from Google, Alphabet’s core business. While advertising revenue grew by 10.6% to $72.46 billion in Q4 2024, analysts had anticipated a 12% increase.
→ Alphabet announced plans to significantly increase capital expenditures next year to around $75 billion, prompting questions about the impact on depreciation and profitability.
Additionally, news that China has launched an antitrust investigation into Alphabet—potentially in response to tariffs imposed on Chinese goods by the Trump administration—may have weighed on the stock price.
Technical Analysis of Alphabet (GOOGL)
GOOGL remains within an upward trend channel (marked in blue on the chart), with the price having pulled back to key support levels, including:
→ The lower boundary of this trend channel
→ The $180.90 level, marking the top of the bullish gap from 10 December
→ The psychological level of $180, which acted as resistance in late 2024 (indicated by arrows)
This suggests that the downward momentum caused by the earnings report could slow down or even reverse, meaning the current price action may be a pullback within the prevailing uptrend.
Should You Buy GOOGL Stock Now?
According to a report from The Smart Investor via Yahoo, investors should not be overly concerned, as:
→ Alphabet's strong cash flow will allow it to fund its planned $75 billion in capital investments without issue.
→ The company’s leadership stated that demand for its AI-driven products currently exceeds supply.
Meanwhile, analysts surveyed by TipRanks believe Alphabet can overcome its challenges:
→ 27 out of 37 analysts recommend buying GOOGL, with none advising to sell.
→ The 12-month average price target for GOOGL is $215.85.
Overall, while short-term volatility remains, long-term prospects for Alphabet appear solid. Investors with a longer time horizon may see this dip as a buying opportunity.
Trade on TradingView with FXOpen. Consider opening an account and access over 700 markets with tight spreads from 0.0 pips and low commissions from $1.50 per lot.
This article represents the opinion of the Companies operating under the FXOpen brand only. It is not to be construed as an offer, solicitation, or recommendation with respect to products and services provided by the Companies operating under the FXOpen brand, nor is it to be considered financial advice.

Stock Market Forecast | TSLA NVDA AAPL AMZN META MSFTStock Market Forecast | SPY and QQQ
Mag 7 Forecast | TSLA NVDA AAPL AMZN META GOOGL MSFT

Alphabet (Google) Stock Approaches Critical SupportIn recent sessions, Google's stock has recorded a decline of over 8% in just a couple of trading days, as market confidence weakens following the company's latest earnings report (February 4). Google Cloud services revenue grew by 30% , falling short of the expected 35% , signaling that competition in the cloud sector is becoming increasingly aggressive for Alphabet. This has dampened growth prospects for the company, leading to sustained selling pressure on the stock.
Uptrend at Risk
Google has maintained a solid uptrend since September 2024, with bullish momentum pushing the stock above the $200 per share level. However, the recent short-term bearish bias has cast doubts on the stock’s strength, as the price now approaches the trendline support level, where sellers must prove whether this movement is just a correction or a sign of a stronger bearish shift in the short term.
MACD Indicator
Currently, both the signal line and the MACD line have adopted a downward slope, while the histogram remains oscillating near the neutral 0 level. This indicates that the previous bullish dominance has faded, and if the histogram continues moving further away from the neutral zone, it could reinforce a stronger selling bias in the coming sessions.
Key Levels:
$200: The most important resistance level, aligning with previous highs in Google’s stock. A rebound to this level could revive the long-term uptrend.
$187: A critical new support zone, aligning with previous lows and the uptrend line support. Sustained movements below this level could reinforce the current bearish bias and threaten the long-term uptrend.
$173: A major support level, corresponding to previous neutral price zones. A breakdown to this level could signal the beginning of a much more extended downtrend.
By Julian Pineda, CFA - Market Analyst

BANGER $5 to $8+ on steadiest uptrend of 2025 so far!BANGER $5 to $8+ on steadiest uptrend of 2025 so far! 📈
Buy & Hold 💬
Told you about it in chat while it was still in $6's
Doesn't get any easier than this, just waiting for the money to pile as it keeps uptrending NYSE:BBAI
Everyone that listened got paid, it was the only stock bought and held yesterdy 1/1 for a fat win.

GOOGLE Buy the earnings dip and Target $215.Alphabet Inc. (GOOG) has been trading within a Channel Up since the September 09 2024 Low. Just last Friday it formed a Bullish Cross on its 1D MACD and is rising, which inside this Channel Up pattern, has been a strong buy signal.
Given that the company's Earnings miss will force the stock to open near or at the 1D MA50 (blue trend-line), take this excellent dip opportunity to buy the technical pattern and target $215, which is the standard +15% Higher Lows rebound the Channel had on each Bullish Leg.
-------------------------------------------------------------------------------
** Please LIKE 👍, FOLLOW ✅, SHARE 🙌 and COMMENT ✍ if you enjoy this idea! Also share your ideas and charts in the comments section below! This is best way to keep it relevant, support us, keep the content here free and allow the idea to reach as many people as possible. **
-------------------------------------------------------------------------------
💸💸💸💸💸💸
👇 👇 👇 👇 👇 👇

$GOOGL Stocks Sink on Alphabet Earnings; Gold Hits AllTime High Stocks Sink on Alphabet Earnings; Gold Hits All-Time High 📉✨
1/9
Global stocks dipped after Alphabet ( NASDAQ:GOOGL ) missed earnings expectations, putting pressure on Wall Street futures. Investors are now questioning tech's growth outlook. 📉 Could this signal a broader tech revaluation?
2/9
Alphabet’s earnings disappointment impacted sentiment across markets, while some European stocks showed resilience. Novo Nordisk delivered positive earnings, highlighting sector-specific strength. 🏢📊
3/9
Currency Moves: The USD/JPY pair saw notable movement as the yen strengthened. Japan’s wage data came in higher than expected, fueling speculation of another rate hike. 💴 Could this be a turning point for the yen's momentum?
4/9
The dollar weakened against major currencies, driven by Japan’s wage growth data and broader market uncertainty. Currency traders, take note: further BOJ tightening may continue shifting capital flows. 📉
5/9
Gold Surge: The precious metal hit a record high today. A weaker dollar and heightened geopolitical risks are driving investors toward safe-haven assets like gold. 🚀 Will this trend hold if market volatility persists?
6/9
Political surprise: President Trump made unexpected remarks about potential U.S. involvement in Gaza for economic development. Despite the shock value, markets largely shrugged off the news. 🗞️ Investors kept their eyes on the numbers instead.
7/9
Market Insights:
Alphabet ( NASDAQ:GOOGL ): Missed earnings shook tech stocks.
USD/JPY: Yen gains signal a potential shift in forex markets.
Gold: Safe-haven demand pushes prices to new highs.
8/9
Investors may need to reassess their tech positions in light of Alphabet’s performance. Meanwhile, forex traders could find opportunities in USD/JPY movements, and gold investors are riding a bullish wave. 🧭
9/9
What's your market outlook after today's moves? Vote now! 🗳️
Tech will rebound soon 📈
Volatility will dominate 🔄
Gold remains king of 2025 ✨

4/4 DAY! This is why profits need to be realized as planned!4/4 DAY 🎯🎯🎯🎯 4 Buys 👉 4 Targets hit
NASDAQ:VLCN a perfect example of buy before halt up, take profit into the vertical blowout then let it go wherever it wants while moving on to the next stock and repeat it 3 more times before the day ends.
Other 3 trades were on NASDAQ:CAPT and NASDAQ:QNTM twice all doubled stocks in a day while others focus on peanuts +-5% trades like NASDAQ:AMD NASDAQ:GOOGL NASDAQ:NVDA NASDAQ:TSLA

Google: Room to Head HigherFor the past two months, GOOGL has been stuck in a sluggish sideways phase, with even its latest breakout attempt quickly sold off. During the magenta wave , we still expect a new high, though a direct transition into the subsequent wave remains technically possible. In our 33% likely alternative scenario, we would have to reckon with a significantly delayed continuation of the overarching upward cycle. In this case, GOOGL would still be working through the (intermediate) correction of the green wave alt. , which would bottom below the support at $147.22.

GOOGL Alphabet Options Ahead of EarningsIf you haven`t bought the dip on GOOGL:
Now analyzing the options chain and the chart patterns of GOOGL Alphabet prior to the earnings report this week,
I would consider purchasing the 200usd strike price Calls with
an expiration date of 2025-2-7,
for a premium of approximately $7.20.
If these options prove to be profitable prior to the earnings release, I would sell at least half of them.

Stock Market Forecast | TSLA NVDA AAPL AMZN META MSFT GOOGLStock Market Forecast | QQQ SPY
Mag 7 Forecast | TSLA NVDA AAPL AMZN META MSFT GOOGL

GOOGLE - Trade Analytics InsideNASDAQ:GOOGL looking like a SNACK! 🤤
🔹Green H5 Indicator
🔹Triangle breakout
🔹Bullish Wr%
🔹Volume shelf launch
🎯$203🎯$217 before March! ⏲️
Not financial advice

Stock Market Forecast | TSLA NVDA AAPL AMZN META GOOGL MSFTStock Market Forecast QQQ SPY
Mag7 Forecast TSLA NVDA AAPL AMZN META MSFT GOOGL

Stock Market | TSLA NVDA AAPL AMZN META GOOGL MSFTStock Market QQQ and SPY Analysis
Mag 7 Analysis | TSLA NVDA AAPL AMZN META GOOGL MSFT

Stock Market | TSLA NVDA AAPL AMZN META GOOGL MSFTStock Market | TSLA NVDA AAPL AMZN META GOOGL MSFT

Stock Market Analysis | TSLA NVDA AAPL AMZN META GOOGL MSFTStock Market Analysis | TSLA NVDA AAPL AMZN META GOOGL MSFT

GOOGLE: Patiently wait for this level to buy.Google is marginally bullish on its 1D technical outlook (RSI = 57.689, MACD = 5.220, ADX = 40.687) as it has been practically consolidating for the past 2 weeks, having formed a HH (Dec 17th) at the top of the Channel Up. The 1D RSI bearish divergence suggests that this is a top like Nov 7th was. The trend didn't turn into a buy again before hitting the 1D MA50 after a 0.5 Fibonacci pullback and this would be the most optimal level for buying again. Beyond that, since both bullish waves so far have been approximately +23.90%, we expect another such rise to take place. Our target is the 1.5 Fibonacci extension (TP = 225.00).
See how our prior idea has worked out:
## If you like our free content follow our profile to get more daily ideas. ##
## Comments and likes are greatly appreciated. ##

Google - Catch The 2025 Bullrun Now!Google ( NASDAQ:GOOGL ) is preparing for a strong year 2025:
Click chart above to see the detailed analysis👆🏻
So many confluences on Google are pointing to a strong year of 2025. First of all we have the resistance trendline breakout which we saw a couple of months ago and bears were also not able to significantly push price lower after we saw the retest of resistance. This is soo bullish.
Levels to watch: $220
Keep your long term vision,
Philip (BasicTrading)
