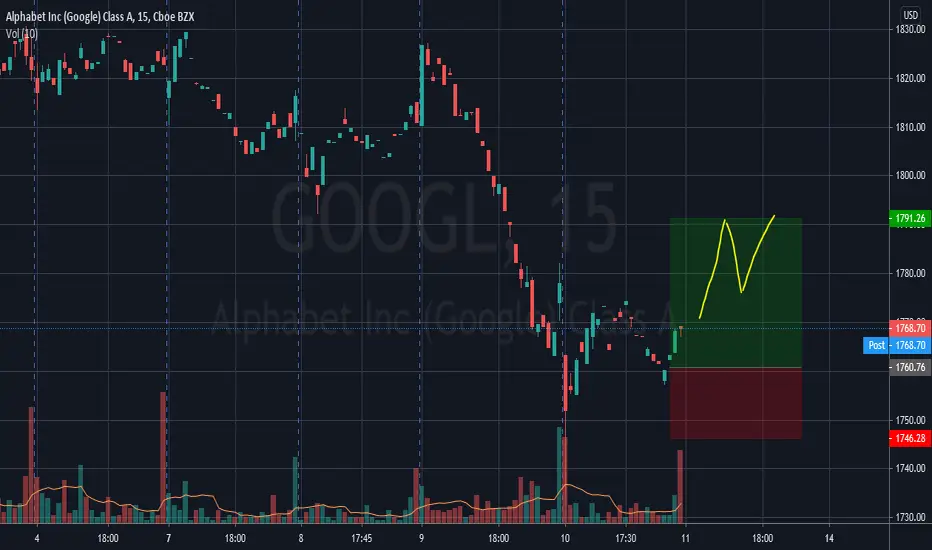
GOOGL

googl for long google long or buy for all the week so dont forget always my advice to take 50% of gain when you are more then 50% profit and move the stop to enter level and let the deal to run

Big Tech still underperform frm Sep (AAPL, AMZN, MSFT, FB, NFLX)Big Tech still underperforming from Sep (Apple AAPL, Amazon AMZN, Microsoft MSFT, Facebook FB, Netflix NFLX) - with the exception of Google GOOG.


$GOOGL Getting in the head and shoulders!Live play set up breakdown MIDDAY $GOOGL inverse head and shoulders

Google (Alphabet inc.) SHORT📉 NASDAQ:GOOGL SHORT H4
🛒SELL BELOW = 1716.47
🎯Target1 = 1653.93
🎯Target2 = 1615.27
🛑Trailing Stop loss = 1817.66
❌Cancel trade and open reverse trade = 1817.66
🙈Recommended risk = 1-2%
#GOOGL #GOOGLSHORT #GOOGLSELL

GOOGL long , Further leading FAANG stocksgoogl has been doing a bull flag for the past few weeks after attempting a break of the All time high. watch this share when it breaks the closest swing high on the daily charts. a expansion of volatility from current lvl will ensue NASDAQ:GOOGL
watch the overall market QQQ , and SPY AMEX:SPY too
all are showing sign of breaking up to the upside with the similar pattern as googl

How should we trade a Pennant Pattern? Real ExampleToday we have another Academy Post. In this article, we will explain the way we trade pennant patterns on a real setup.
FIRST STEP: Understand the context
-In this case, we have the price inside an ascending channel (that provide us a bullish direction)
-The price is at All-time Highs ( Next Resistance zone, the upper trendline of the channel)
-The price is above a previous Resistance zone (we can deduce Strenght of the price)
SECOND STEP: Creating a Setup
-Now that we have a clear idea about the bullish potential and free path towards the next resistance zone (upper trendline of the channel), we need to develop a setup
-First of all, we need a valid Structure. In this case, a pennant structure to be valid needs an ABCDE formation; the reason is that if we wait for those 5 Waves, we can have a clear idea of the breakout level (The lower and Higher trendline have been tested multiple times, based on that we can set our orders with confidence)
- A setup is composed of 4 items
a) Entry Level: Above B (check the pennant theory)
b) Stop level: Below C
c) Take Profit level: On the 2nd Fibo Extension or in the next resistance zone
d) Break-Even level: First Fibo Extension.
-Only trade if your Risk Reward ratio is above 1.5 ( that means that for every dollar you are risking, you expect to make 1.5)
THIRD STEP: Define your Risk and Follow your rules.
-Only use 1% of your capital on any given trade. That way, you will protect the most important thing as a trader. Your money and your mind
-Follow your rules: The reason you want to have a clear Stop, Take profit, entry, and Break-Even is to act only if the price reaches one of those. otherways, DO NOT TOUCH ANYTHING
-Accept that Stop losses are part of any system: You don't need "90% accuracy"; you need to be right half of the time and a risk-reward ratio above 1.5 to be profitable.
Trade Safe, Thanks for reading!


Still bullish on Alphabet. NASDAQ: GOOGLI was looking through the hightech QQQ stock index and thought I might do a review on some of the major players in that index. Still bullish on Alphabet, but it's looking like it's closer to the end here. RSI shows slowing momentum, EWO is in agreement with my fractal mapping. Expecting a fifth wave to complete now. Fibonacci goals are inplace. If my count is right then we are correcting, and this too will drop unless FedReserve doesn't step in and start printing even more money. I will be watching this space closely. NFA .

$GOOGL All time high - Will it drop?$GOOGL All time high - Will it drop? I charted the pop but now it reached ATH so a pull back may occur. Be careful and ride momentum. If markets pull back this one will drop so Puts will be the key in that event

#NIO Parabolic Analysis#NIO Parabolic Analysis
Accumulation happens at the bases before they mark up the prices. The final phase is the distribution phase where they sell into retail investors getting a fear of missing out. Don't worry, NIO likely will come back and test a previous level. I will be a more confident buyer around the gap fill 22.59.

FANG the Bearish Movement is here ! H&S Pattern developing on the FANG index, I expect we drop 20% from here to retest the bottom of the channel.

GOOGL/Alphabet has an ENTRY for taking PROFIT.As you can see on the the price has broken the FIB RET 0.618 and it will goes up to 1720$ with ease.


GOOGLE, Bullish Cup_&_Handle breakout, more upside potentialPlease Support this Idea with LIKE if it is Useful....
GOOGLE
price made a strong break above Cup_&_Handle pattern,price has potential for more upside..
Push LIKE & SUPPORT the Idea...
*The content on this analysis is subject to change at any time without notice, and is provided for the sole purpose of assisting traders to make independent investment decisions

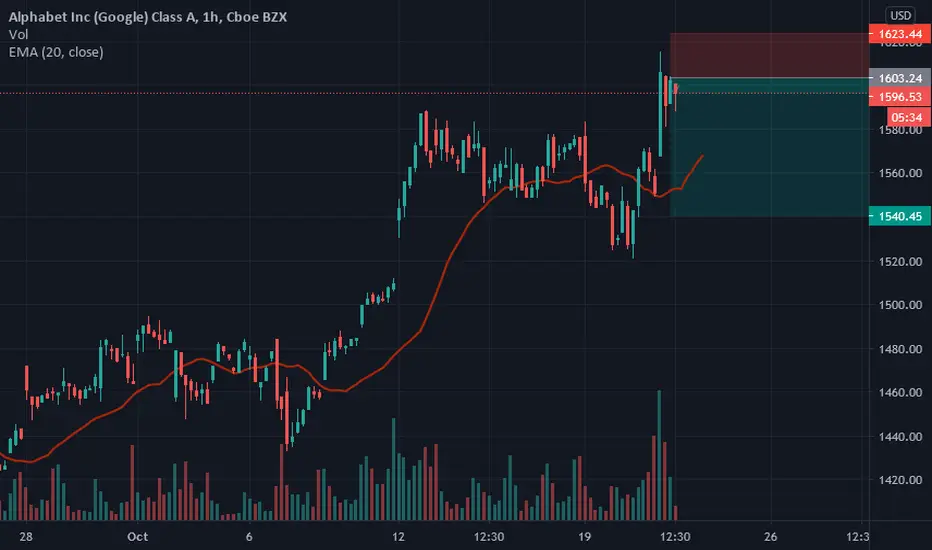
GOOGLE IDEA📈 NASDAQ:GOOGL LONG H4
🛒BUY above = 1589.30
🎯Target1 = 1616.10
🎯Target2 = 1632.70
🛑Stop loss = 1545.50
🙈Recommended risk = (1%-2%)
📉 NASDAQ:GOOGL SHORT H4
🛒SELL BELOW = 1545.50
🎯Target1 = 1518.60
🎯Target2 = 1501.90
🛑Stop loss = 1589.30
🙈Recommended risk = (1%-2%)
