GOOGL


PreCovid track to OCT $470 compared to current track to OCT $470The angles are very similar in trajectory.
A $470 price target represents a 22% upside in about 3 months.

GOOGL wave (4) PullbackGOOGL wave III completed and we’ve rallied in a complete motive impulse. Is this wave (5) of higher degree wave III. On guard for a possible top.

Market Cycles - Waves and return to the mean - Part 5 GOOGLEHere is the culmination of my last 4 months of technical analysis of the stock market. I looked at important growth stocks of the past and where they are today. From that analysis, I applied the lessons learned to todays market.
1) Growth stocks break out of the mean channel of wave 1 to finish wave 3 and 5. Average stocks stay in the mean channel.
2) The following correction will take them back to the project mean of wave 1, maybe even below. The more they break above the mean the more they drop during the correction.
3) Head and Shoulders pattern usually describes motive waves 4-5 and the following corrective ABC wave.
After a major correction several things can be learned
1) Some companies never really recover, assume they just had high prices because every company did (thing tech bubble)
2) Some companies recover but never become growth stocks again and grow but stay along a mean growth
3) Some companies are able to reinvent themselves and become growth stocks again (MICROSOFT)
I can't say I did everything correctly. I took my best shot at it and at the minimum gives a solid idea what could be to come for stocks in 2020 and beyond.
I broke this down in several idea posts.
Market Cycles - Waves and return to the mean - Part 1 GE
Market Cycles - Waves and return to the mean - Part 2 AT&T
Market Cycles - Waves and return to the mean - Part 3 IBM
Market Cycles - Waves and return to the mean - Part 4 MICROSOFT
Market Cycles - Waves and return to the mean - Part 5 GOOGLE
Market Cycles - Waves and return to the mean - Part 6 AMAZON
Market Cycles - Waves and return to the mean - Part 7 S&P 500
Market Cycles - Waves and return to the mean - Part 8 NASDAQ
Hope this helps and good luck.


$GOOGL Options play of the month | New ATH!Technical look on $GOOGL with a huge potential options play through earnings
Throughout Covid, Netflix has performed rather well since the first wave down, pushing 46% from lows.
We are looking for Google to either retest previous ATH or straight rip, will probably play it safe and wait for the retest. If the setup doesn't look good enough for entry, we will simply sit on our hands and wait for the right time.
The Play:
GOOGL $1,600 Call 7/17
Estimated Time: 7-13 Days
- Bullish - Breakout on the upside to make even more ATHs, looking to retest the previous channel resistance.
This play will payout stupid but takes quite a bit of capital, congrats if you made a bag on this :)
This is not financial advice nor am I a financial advisor
DotcomJack
(View other option plays below)

GOOGLE INVESTING LONG TERM , TARGET $1900 (HOLDING) GOOGLE has passed the peak of the era and there are " SHS " variants, even though it is not, but I still consider this a good model with the
characteristics of "SHS". This is based on my experience over 7 years of delivery. Translate, everything is right
vs GOOG now, good time to buy investment.
GOOG buy : $1550 +-5
GOOG target : $1900
Stop loss : 10% .
Good investment in Google!


GOOGL : Swing, 100% Price ActionGOOGL : Follow the uptrend.
Feel free to like❤, comment📝, share👫 and follow me for other analyzes🌍

GOOGL 15 MIN GOOGLE Stock is in an uptrend for more than a week . any breakout from upward or downward might lead to a new trend .
if the actual uptrend continues you can enter a buy position but you need to watch for an eventual breakout downward.

GOOGL LEVELSGOOGL NEEDS OVER 1475 TO MAKE A MOVE TOWARDS 1500.
TRADE IDEA: 1500C 7/10
IF GOOGL FAILS AT 1475 IT CAN MOVE TO 1449, 1436.
TRADE IDEA: 1450P

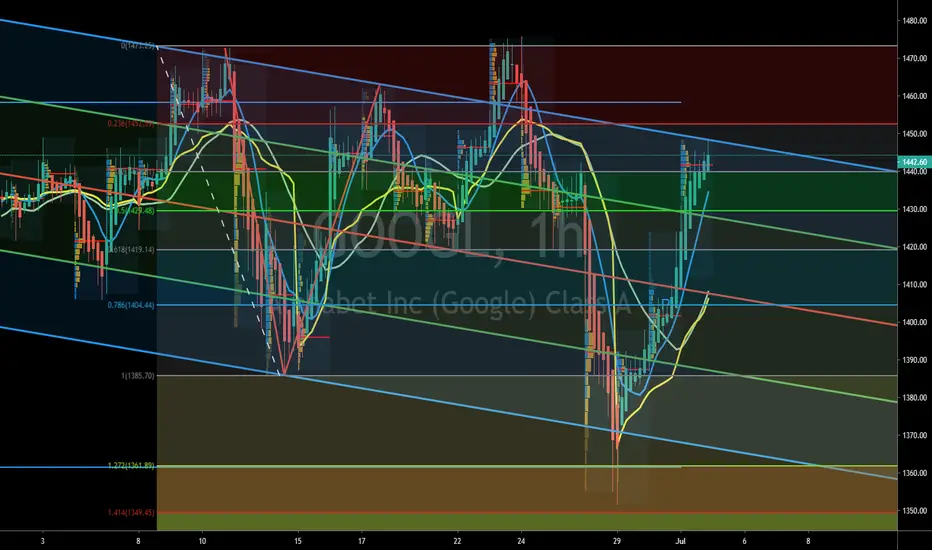
Elliott Wave View: Alphabet (GOOGL) Resumes Higher in wave ((5))Alphabet (GOOGL) has broken above June 24 high, suggesting that the next leg higher has started. The stock has ended the correction from June 11 high in wave ((4)) as a Flat Elliott Wave Structure. Wave (A) ended at 1385.80 low, wave (B) ended at 1475.79 high, and wave (C) ended at 1351.65 low. This 3 waves move ended wave ((4)) pullback. From that low, the stock extended higher in wave 1, which ended at 1402 high. The pullback in wave 2 then ended at 1393.22 low.
Afterwards, the stock resumed higher in wave 3, where the subwave unfolded as a 5 waves Elliott Wave structure. Wave ((i)) ended at 1406.50 high, wave ((ii)) ended at 1395.64 low, wave ((iii)) ended at 1448.48 high, wave ((iv)) ended at 1441 low, and wave ((v)) ended at 1488.52 high. Wave 4 pullback is proposed complete at 1468.55 low. The stock can push for another high before ending 5 waves rally from June 29 low in wave (1). A larger degree pullback in wave (2) should then follow before the rally resume again. As far as pivot at 1351.05 low stays intact, expect dips in 3, 7, or 11 swing to continue finding support.


SPX LEVELSSPX broke 3154 and filled the gap above. SPX needs to close over 3154 to move higher. A close under 3154 can pull back lower.

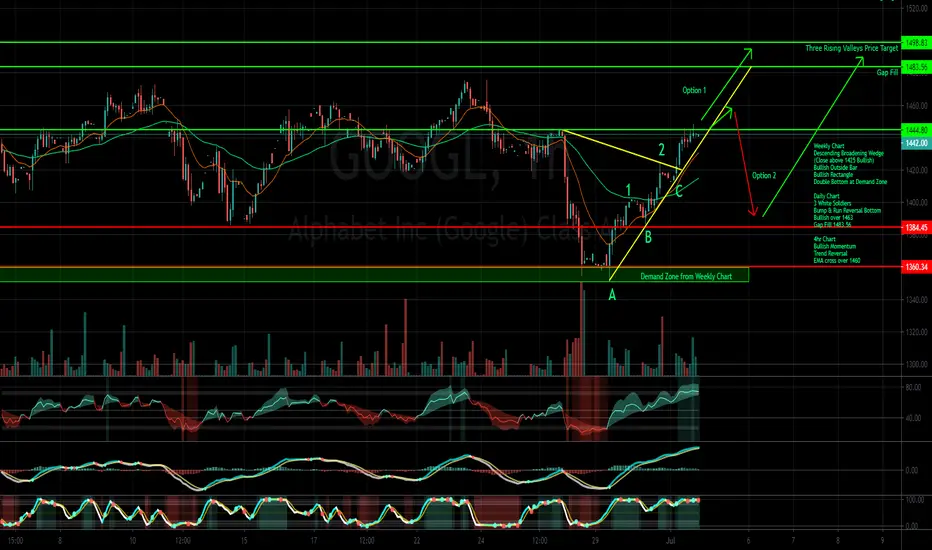
GOOGL Analysis 3 Rising Valleys + Bullish Momentum + Time Frame Confluence
Option 1 based off Price Action and Option 2 based off Elliot Wave Forecast
Weekly Chart
Descending Broadening Wedge
(Close above 1425 Bullish)
Bullish Outside Bar
Bullish Rectangle
Double Bottom at Demand Zone
Daily Chart
3 White Soldiers
Bump & Run Reversal Bottom
Bullish over 1463
Gap Fill 1483.56
4hr Chart
Bullish Momentum
Trend Reversal
EMA cross over 1460
ANALYZE: GOOGLafter all inotice on the chart my probability the trend going up to test the resistance line

Alphabet (GOOGLE) - Grab at Demand & Accumulation ZoneNASDAQ:GOOGL be ready to grab some near demand & rest at accumulation zone.
