GOOGL

FAANGs - What Lockdown??? - Reflation TradeWhat you are looking at is an equally weighted 'portfolio' of all the FAANG stocks,
~FB
~AMZN
~AAPL
~NFLX
~GOOGL
And what the performance would have looked like if you had put an equal dollar weighted amount into each, at the earliest point you were able to, i understand that this is impossible to time or predict, but what it does do, is it serves to illustrate just how skewed the overall market performance is, when you analyze the best performers.
In terms of drawdown during the global lockdown?
Minimal, in terms of peak to trough move, the global lockdown did not measure above a slightly above average drawdown, in fact, the drop in 2019-2019 was more severe, at a 36% drop, versus the 27% drop experienced recently.
What is more interesting is that the lockdown, if anything is allowing these already MASSIVE companies to gobble up even more of the market share, when compared with the real economy (i.e. small/ mid-size business)
In fact, YTD, the FAANGs are UP close to 27%, versus the Russell 2000, which more closely represents smaller sized businesses, which is DOWN close to 21.5%
I find this to be slightly troubling, because the FAANGs are not all stocks you would expect to boom during the global lockdown. Yet, they are all doing extremely well, compared with the broader market.
Here are 4 of the 5 FAANGs (FB, AAPL, NFLX, GOOGL)
Here is AMZN
As you can see, both GOOGL and FB are both doing VERY well, considering they are predominantly advertising platforms for businesses...you know, the businesses that are shutting down in record numbers, furloughing staff and cutting hours. I assume that this surge in stock price has nothing to do with the Fed liquidity hose and is all to do with savvy business owners all seamlessly switching to an online E-commerce business model.
AMZN and NFLX are no surprises, these are the quintessential 'stay-at-home' bet, so i am not surprised at their relative out-performance.
AAPL is no real surprise either, simply due to the overwhelming size of the company, as well as the generally healthy balance sheet (a couple hundered billion of cash laying around doesn't hurt either to boost investor confidence).
I will close with this, prior to the market crash and global lockdown, these same stocks were being derided by many for being fundamentally overvalued, add in a global lockdown and a few trillion in stimulus and here we are.
The lesson is...do not underestimate how irrational a market can be...trade what is actually happening...not what you THINK should happen...
Clearly, the reflation trade is on.
-TradingEdge

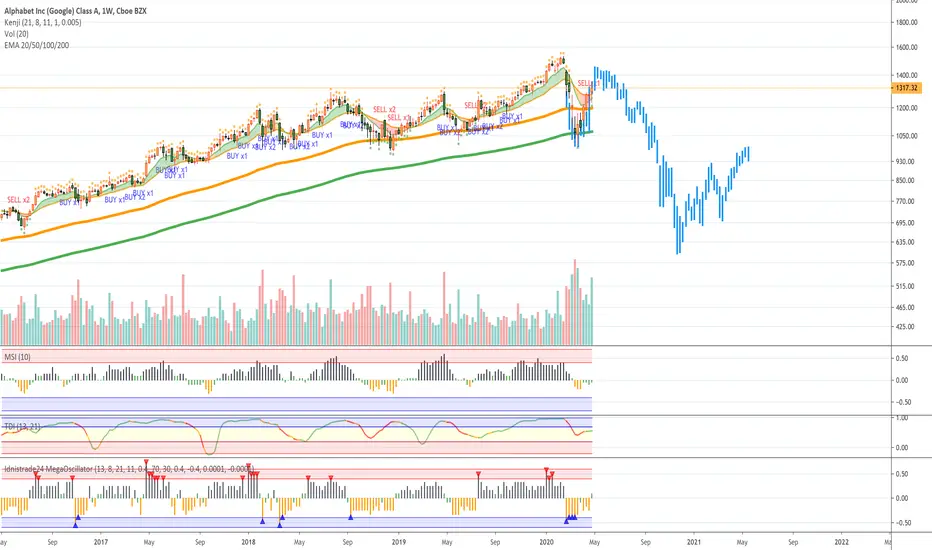
GOOGL Weekly Resistance| S/R Flip| Blue Sky Breakout Evening Traders,
Today’s Technical Analysis – GOOGL – breaking a multi-year weekly resistance with strong volume. Consolidation and a retest of structure will confirm a new range.
Points to consider,
- Multiple weekly closes
- Strong volume
- S/R Flip retest (confirmation)
- Local high (blue sky breakout
GOOGL has closed consecutive weekly candles above structural resistance. this shows strength in price action as volume was considerably high at the point of break.
A Support/Resistance Flip will further confirm a true break as this will solidify the new support
GOOGL is in a strong multi-year bull trend, taking out the recent highs will establish a blue sky breakout.
Overall, in my opinion, GOOGL confirming an S/R flip will be extremely bullish. This will mean that the multi-year range has broken and price is likely to establish new highs.
What are your thoughts?
Please leave a like and comment,
And remember,
“The hard, cold reality of trading is that every trade has an uncertain outcome.” ― Mark Douglas,

[GOOGL] - Trade of the DayGOOGL stock High probability to ride up to the price 1384.00 USD .
☑️ Send me message for more ANALYSIS and PRIVATE IDEAS 📩
☑️ Follow Me For More!
☑️ Hit Likev 👍
☑️ Comment Down Below 📝

Google Continued Trend and Next Opportunity Expected! Welcome to Profitlio Trading!
What's up traders! Thanks for Jumping back on my Analysis, Traderchamp is here on your Service, Also hit thumbs up and support the work.
The continued trend is expected to show up a possible breakout on the key level sitting above. And will wait for the confirmation and entering in a perfect retest and reversal towards the market resistance on TOP! Sketch up your own trade setup and make sure you meet with the required confirmations first before you make your move!
Profitlio Trading ( Since 2014 in Financial Markets )
________________________________________________
Traders Disclaimer: Non of our analysis or trade setups being shared here on tradingview is a trading advice. As we keep on weekly updates with our predictions and expectations. We may take them as a trade only if trade setup meets the required criteria ( Confirmations ). Unless we will never take them as a trade if it never reach our trading requirements.
Take them at your own risk as trading is highly risky and you may loss your investments. Our trades are based on Swinging and Mid to long term approaches. All trades executed will be handled under the name of Profitlio Trading only.

ALPHABET ($GOOGL): Does ALPHABET Go All the Way?✨ New charts every day ✨
Like, Comment & Follow to help the community grow 🎉🎉
---
Despite taking a hit on the ad side of the business, Google (GOOG / GOOGL) has had a textbook "V" shaped recovery (Or in this case, an upside down "A" recovery we could say). Can the bulls make the final push back to all time highs? One could argue the new stimulus package will have a positive effect on the markets and give this tech giant room to finish running. So let's map out a potential pathway for the bulls.
Resource: www.cnn.com + www.marketwatch.com
---
1. Fractal Trend is showing an uptrend (Aqua bar color) on the 1 hour timeframe giving us a clear trend to look for a long setup within.
2. With this strategy, we are looking for long setups in an uptrend and as such want to enter long on retests of bullish order blocks plotted by Orderblock Mapping (Aqua) and/or bullish S/R levels plotted by Directional Bias (Aqua).
3. As you can see we had a great long setup entry at S1, sadly this was missed so we can only plan for what may happen now and not worry about the past.
4. The target for this move is up though the "COVID gap" and all the way to the range created by previous highs at R4. This is good news for anyone already long.
5. If we don't see bullish continuation off this move, then there is another potential long at S2 assuming Fractal Trend gives the green light.
6. If Fractal Trend signals a downtrend (Maroon bar color), then any long positions should exit as this is seen as indecision/weakness, otherwise the bet is on GOOGL continuing its recovery.

dsgvsdsupport around 1300 would be a good time to buy, right now it seems too much and I would rather wait for a potential drop


[GOOGL] - High probability to drop to the price 1280.00 USDGOOGL stock High probability to drop to the price 1280.00 USD
If you liked, leave a like and follow me please for more insight view from me.
Thank you 🙏


FB following AMZN and GOOG. Is The Bull Market Back?FB following AMZN and GOOG. Bottom could found be in the indices. SPX won't go down without the huge caps.

Elliott Wave View: Google (GOOGL) Ending 5 waves ImpulseIn the aftermath of COVID-19 selloff, Alphabet (GOOGL) formed a low on March 23, 2020 at 1008.87. From there, the stock is rallying as a 5 waves impulsive Elliott Wave structure. Up from 3.23.2020 low, wave (1) ended at 1173.4 and wave (2) pullback ended at 1075.08. The stock then resumed higher in wave (3) towards 1297. The 45 minutes chart below shows the wave (3) rally. It then pullback in wave (4) to 1205. Subdivision of wave (4) unfolded as a zigzag where wave A ended at 1256.44, wave B ended at 1276.82, and wave C ended at 1204.68.
Wave (5) is currently in progress and unfolding as a 5 waves impulse in lesser degree. Up from wave (4) at 1205, wave 1 ended at 1288.15 and pullback in wave 2 ended at 1230. The stock then resumes higher again in wave 3. Near term, while dips stay above 1204.68, expect a few more highs to end wave (5). This should also complete wave ((1)) in higher degree and end cycle from March 23 low. Stock should then pullback in wave ((2)) to correct cycle from March 23 low in 3, 7, or 11 swing before turning higher again.

GOOGL/ The market is in sell position.4H chart -The price has faced a strong resistance on our line, giving us a high probability of pull back.
-The SL/TP are shown in the position.

GOOGInvestors in Google! Keep the shares in your portfolios to sell in good areas!
what do you think ?

If you are a bear, this stock will make you doubt... GOOGIf you are a bear, this stock will make you doubt to say the least... W3 after 1212 formation (green)? Or impulse (orange)? Bullish if we break the 0.65 fib. Lets see how it behaves at the market open.

GOOGLE Double Top of the Morning to You (#GOOGL) Nasty bearish div. double top on #relativestrength and #macd inside a larger flag

Daily Review: GOOG, AMD, and MSFTU.S. markets began the week on a strong note, led by small caps. The Russell 2000 Index finished the day up nearly 4% while the Nasdaq 100 lagged behind notching 0.5% at the end of the session.
This week represents a pivotal point of the rally as earnings season hits full swing with big cap tech reporting this week. Some names on deck later this week are TSLA, FB, AAPL and SHOP of which I will be reviewing on later posts this week. Today, we search for some market clues with GOOG, AMD and MSFT.
Tech Flexing
It's tough to bet against tech these days. Despite a global economic shutdown, large cap tech stocks have been resilient…on the charts. It will be interesting to see how they look on the balance sheet! We begin today with Alphabet, Inc (GOOG) on a weekly view.
GOOG has staged an impressive rally off the March 23 low making up nearly half its losses from its all-time high, $1532.11. At first glance, GOOG appeared to have broken through critical long term trendline support, but after review, GOOG has found support on a trendline drawn from the 2015 lows.
GOOG is heading into 2020 earnings after delivering strong 18% increase of revenue year over year. However, there are questions on whether the internet advertising giant will be able to impress this time around. The COVID-19 pandemic has definitely had an impact on whether businesses invest in online advertising, a large share of GOOG's revenue. Whether the magnitude of the impact shows up in Q1 earnings is yet to be seen.
Overall, GOOG bulls have enjoyed the past months worth of gains. However, there is reason to be cautious going into earnings as market strength and price begin to divert while overhead weekly resistance remains. Bias: Bearish .
Technically, Beautiful
Advanced Micro Devices, Inc. (AMD) has been the semiconductor darling for over a year ever since breaking out from a year long cup and handle pattern on October 2019. AMD is now up 100% since that breakout and COULD be poised for more upside. I emphasized could on purpose, because on the weekly chart AMD is knocking into resistance at $59.27. Any break higher may also be met with RSI divergence. AMD in my opinion is a tough buy at these levels as the risk reward is not favorable going into earnings.
On the plus side, AMD is a beneficiary of being partnered with Sony and Microsoft who are both scheduled to be releasing brand new gaming consoles later this year. How these schedules are impacted by COVID-19 is yet to be seen. Nevertheless, I would not be surprised if AMD pulled back a bit before heading higher. Overall, I like the stock long term from a technical and fundamental perspective, but on the short term I'll be waiting on a dip. Bias: Bearish .
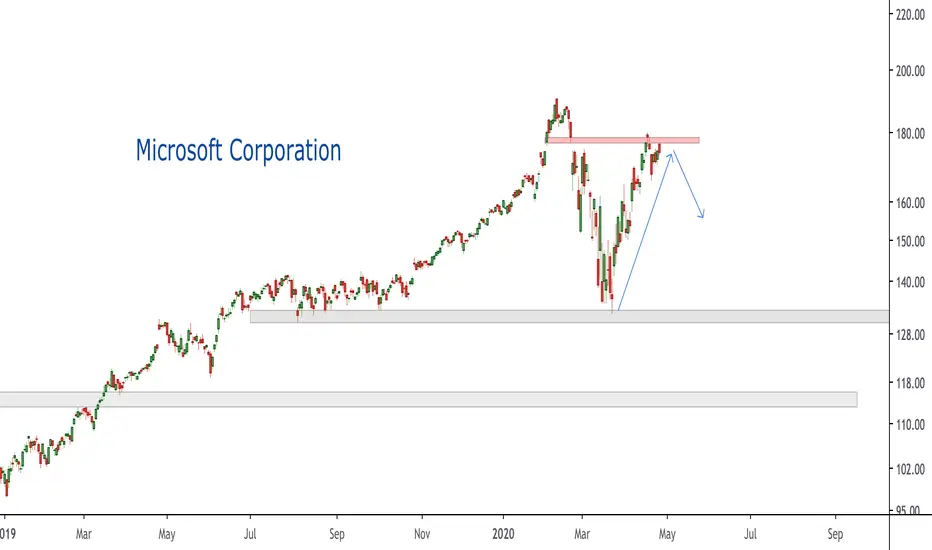
Trillion Dollar Baby
Above is the daily view of Microsoft Corporation (MSFT). Trading 8% below its all-time high, MSFT is going into earnings in potentially in a make or break position for the broad market. MSFT makes up the largest percentage weight of the Nasdaq 100 (NDX) and today the index was lagging behind throughout the trading session. Either, MSFT and big tech have run out of gas or this is a healthy pause before marching back into all-time highs.
If MSFT does pull back, there is not much support. The rally has been a straight shot up from the lows. MSFT is a tough buy here especially after the discouraging performance of the NDX at the start of the week. Bias: Bearish .
Pivotal Week Ahead
With MSFT, AAPL, GOOG, AMZN and FB all reporting fiscal year Q1 2020 earnings this week, we should get a better grasp of how the market will trade in the months ahead. We must also assume that companies will be doing their best to lay down the framework to ease in the harsh reality of Q2 earnings, which undoubtedly will more accurately reflect the impact of the global economic shutdown. Tomorrow we have Tesla, Facebook and Apple. Have a great evening!

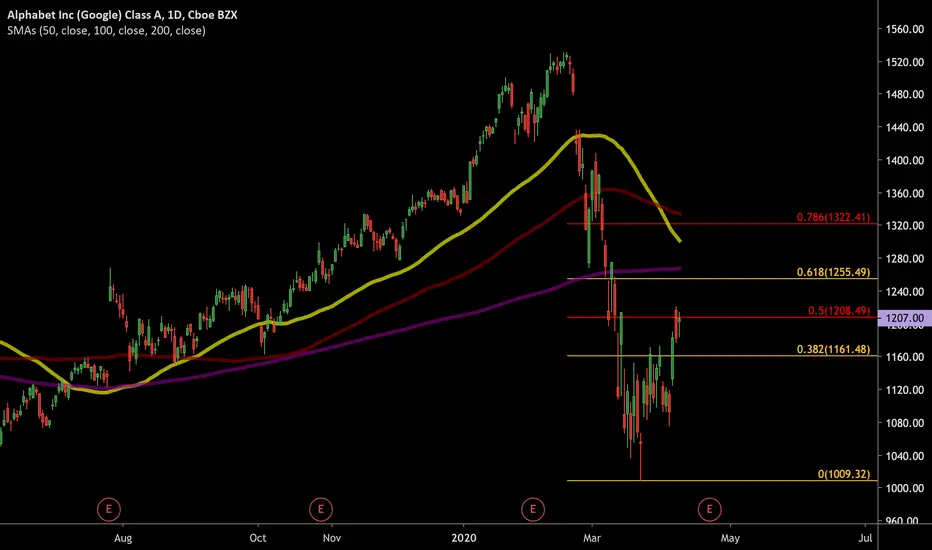
GOOGL 2nd fib progression in playNote that GOOGL is sitting around the 50% of the 2nd fib progression since ATH drop. Over 50% we see the 61.8% fib, which coincides with the daily 200 sma. Weird how shit works up huh?
GOOGL technicaly based forecast
📌Short intro:
I am full time trader - analyst * High accuracy of ideas * Technicaly and Fudnamentaly side in analysis * Comment if have any questions or want to send support * Price action - FIBO - Candl pattern * FX - STOCK - CRYPTO * Simple ideas
💡 GOOGL technicaly indicators showing we can expect higher bulish market recoveryng phase, FIBO 0.382 which is in some cases strong supp is breaked, good bulish candels foramtion, expecting to see push in price till FIBO 0.6 on same place i and supp trend line .
📌Have on mind, trading involves risk, check idea on your own tactic, if have questions pls comment!
Thanks on supporting!
All best, good luck!

Descending and AscendingSome broadening wedge formations and Fibonacci spirals..
S&P index can be seen to be near a possible top.
