GOOGL - 07/29Earnings Gap up, held the gap the rest of the week.
Only concern is that the Gap may not hold?
GOOGL

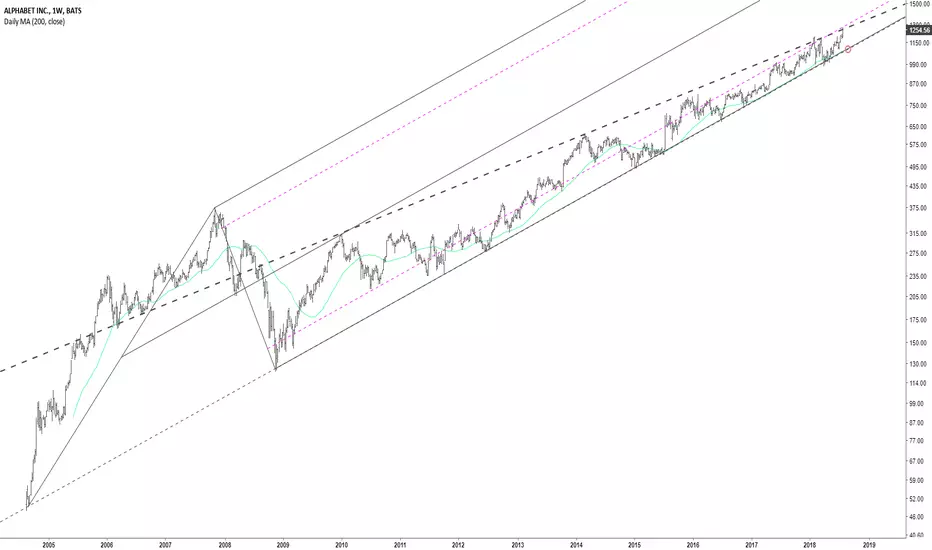
$GOOGL levelsAfter smashing expectations Google again tagged the top end of the decade long slope. The 75% slope of the pitchfork also coincided with this level. Will there be any momentum to finally break this slope or will we turn back towards the lower end which coincides with the 200dma @~$1100
Alphabet Inc Class A | MAXOUT your SHARES - WAVE IN ACTIONThe partnership between Google and HTC will have several HTC employees join Google's growing hardware division. Google also announced it acquired non-exclusive rights to some of HTC's intellectual property in a separate deal.
Upcoming products by Google will generate enough sale to boost revenue by 100% from Bottom by the end of this Fiscal year,
this October 4th, a new segment by Google will be released under the name of "Pixel 2" and "Pixel 2 XL" the main focus here is to
gather more information about the new upcoming products because they are expected to heal the previous wounds on Alphabet Inc
we'll be updating you with more information as they strikes in,
Let us know in the comment what you think!


GOOGL fib extensionGoogle has hit an extension to the upside. Hit the 50% mark which is a very strong level. Target is a little over $1221.00. There are actually other fib levels acting on google to go to the upside. This happens to be the most recent one of those levels. GOOGL IF YOU ARE INTERESTED IN SETUPS LIKE THIS FOLLOW @DANTHETRADEMAN ON TWITTER.

Google- Coming In Strong Supply ZoneGoogle has been in uptrend since April but now price is coming strong supply zone. I will be bearish on this stock for next week with the target of 1140,but will wait to short at 1170-1180 levels.

Catch up trade in GOOGLWide-moat GOOGL continues to underperform its peers since the Feb lows. Looking at the relative performance and valuations, it is tough to decide if there is a catch-up trade in GOOGL or if NFLX is overdue for a pullback.

GOOG : Will the summit test again?GOOG Weekly chart
GOOG : Will the summit test again?
I think yes
Because the indicators are positive
Volume positive weighted
The final closing is the bollinger top band
It turned from the bollinger subband so, will try the top band again.
***This information is not a recommendation to buy or sell. It is to be used for educational purposes only.***
PS make sure you give me a like, If you LIKE this analysis .... If you like most of my analyzes, FOLLOW me .

Google to continue through the tunnelTook a long position on Google today. I expect it to continue up through the tunnel.

Google-Buy on dipsWe like FAANG Facebook , Amazon , Apple , Netflix, and Alphabet
Then we play long with them
Major resistance : All time high , 1200
Major support : 1000
Major trend : Uptrend
Status : ranges in 1000-1200 (It could be triangle form - waiting market to pick direction)
Chance to buy (buy on dips) in area 1000-below
with SL below area 900 TP All time high / higher
Use 1%rule with Google, Margin 100USD : 10000USD portfolio

Time to GOOGLE IT ? Price have been recently moving in consolidation. Resistance have become support. 1000 even number. 38.2% fib retracement support from the 2016 move. 61.8% fib retracement from the previous leg of the move. Long-term buying opportunity. RSI oversold with signs of divergence. Coppock curve confirms it heading north with divergence. Target fib extension Good Luck

Análisis Swing en GOOGLOportunidad de Swing Confirmatoria en Google tarjet sencillo un TP. Posición para 5 días aproximados, posible tarjet antes.

GOOGL 5-Day Ahead Prediction 04/30 - 05/04 PeriodArtificial Intelligence/Deep Learning Enabled 5 Day Ahead Predicted values for Alphabet Inc Class A ( GOOGL ) have been plotted on the chart.
The method used in this prediction is Deep Learning/Artificial Neural Network based, and using complex mathematical models/methodologies to analyze and extract hidden time series features in vast amounts of GOOGL related data. The "trained" and optimized neural network then generates the multi-day ahead predictions which are plotted on the chart and given in the explanation below.
The expected 5 Day Change is 1.643 %
Predictability Indicator is calculated as : 0.826
Predicted 5-Day Ahead Prices are as follows:
Mon Apr 30 Tue May 01 Wed May 02 Thu May 03 Fri May 04
1039.2 1044.8 1047.4 1048.3 1048.3
Please note that outliers/non-linearities might occur, however FinBrain's Artificial Intelligence/Deep Learning Enabled predictions indicate the softened/smoothed moving direction of the stocks/commodities/World Indices/ETFs/Foreign Currencies/Cryptocurrencies.

Where is google going in the future?Google continue go up to 1050 - 1135 - 1200. Or go down to 900 - 850 - 780
My preference: short positions below 980 - 1000 with targets at 900 - 850 - 780 in extension.
Alternative scenario: above 1000 look for further upside with 1050 - 1135 - 1200 as targets.

Piss off content creators till they shoot you in the face :)It's all over for stocks.
Google shouldn't be an exception, and the ridiculous exponential climb has come to an end as we have seen already, and we can see for this particular stock we have lost the support, we are right below it now, now would be a good time to go short, but maybe let the daily RSI recover first? A bit.
A last bounce is possible test that line one more time before going down the giant aqualand slide weeeeee!
Euphoria's over now is time for your harsh lesson bulls!
Ez pz.
+++ I have no idea what I'll doing. +++

GOOGL 5-Day-Ahead Prediction - 04/02-04/06 PeriodAI/Deep Learning Enabled 5 Day Ahead Predicted values for Alphabet Inc Class A - GOOGL have been plotted on the chart.
The method used in this prediction is Deep Learning based, and using complex mathematical models to extract hidden time series features in vast amounts of GOOGL related data.
The expected 5 Day Change is 5.06 %
Predictability Indicator is calculated as : 0.818
Predicted 5-Day Ahead Prices are as follows:
Mon Apr 02 Tue Apr 03 Wed Apr 04 Thu Apr 05 Fri Apr 06
1058.2 1070.9 1079.1 1085.4 1089.6
Please note that outliers/non-linearities might occur, however our AI Enabled predictions indicate the softened/smoothed moving direction of the stocks/commodities/World indices/ETFs/Foreign Currencies/Cryptocurrencies.
