GOOGLE Almost oversold at the bottom of the Channel Up.Google is having a rough day following the revenue miss and has found itself at the bottom of the 5 month Channel Up.
This is a buy opportunity, as long as (1d) candles close inside the pattern.
Trading Plan:
1. Buy if the (1d) candle closes inside the Channel Up.
2. Sell if it closes under it.
Targets:
1. 146.00 (+15.50% rise, like the first bullish leg of the Channel Up).
2. 120.00 (estimated course of the MA200 (1d)).
Tips:
1. The RSI (1d) gives the most optimal buy opportunity at the bottom of its Channel Down around the 30.00 oversold level. Keep that in mind in case it coincides with a MA200 (1d) contact.
Please like, follow and comment!!

Google Set to Announce Positive 3Q Earnings - Time to Long GOOG!I am thrilled to share with you that Google (GOOG) is anticipated to announce positive 3Q earnings, and I couldn't be more excited about the potential this brings for all of us.
Google, being one of the most influential companies in the tech industry, has consistently demonstrated its ability to innovate and adapt to the ever-changing digital landscape. With its diverse range of products and services, the company has managed to maintain its position as a global leader.
Now, with the upcoming release of 3Q earnings, we have a golden opportunity to capitalize on Google's success. The positive financial outlook signifies that the company is not only thriving but also well-positioned for future growth. This is a clear indication that GOOG is a stock worth considering for a long position.
As traders, it's crucial to stay ahead of the curve and seize opportunities when they arise. By going long on GOOG, we can potentially benefit from the positive momentum generated by the anticipated earnings report. This is an exciting prospect, and I encourage all of you to seriously consider taking action and adding GOOG to your portfolios.
Google's unwavering commitment to innovation, coupled with its strong financial performance, makes it an attractive investment option. The company's diverse revenue streams, including advertising, cloud services, and hardware, provide a solid foundation for continued growth and profitability.
So, let's embrace this moment of positivity and take advantage of the potential gains that lie ahead. I urge you to conduct your due diligence, analyze the market trends, and consider the long-term prospects of GOOG. By doing so, we can position ourselves to ride the wave of success alongside Google.
Remember, timing is crucial in the world of trading, and this could be an opportune moment to go long on GOOG. So, let's seize this chance and make the most of it together.

GOOG Sympathy Move Ahead of Earnings TodayThe run down to Monday was a sympathy run. It doesn't mean that NASDAQ:GOOG is headed for a bad report. Rather, retail investors are selling ETFs or moving money out of stocks into safe havens, or other adjustments to portfolios and 401(k)s. The selling dug into the most recent weak support level.
However, NASDAQ:GOOGL has not sent out any advisor in recent weeks regarding its earnings report. Any company this size, and as a veteran company of the stock market, would warn if earnings were going to miss the retail-side analyst estimates. So this is a sympathy move merely because the retail-side selling is moving big-name companies down at this time.
If it has a great earnings report, which the previous runs suggest , then the HFTs may trigger a gap up at open tomorrow. Alphabet had improvement in its quarterly report last quarter. Yearly revenues have been up for 4 years but earnings are up and down as it invests hugely in AI.

A Glimpse Into the Future of AI Companies StocksInvesting in AI companies can be a wise decision, but like any investment, it is important to do your research and understand the potential risks and rewards. Companies such as UiPath, Intuitive Surgical, and Palantir Technologies have seen significant growth in recent years, but it is important to consider their market capitalization and share prices before investing.
UiPath, a software automation company, went public in April 2021 with an initial market capitalization of around $36 billion.
Intuitive Surgical, a company that produces surgical robots, has a market capitalization of over $93 billion.
Palantir Technologies, a data analytics company, went public in September 2020 with an initial market capitalization of around $22 billion.
It is also important to consider the rating of the shares and the security of the company before investing. For example, UiPath was rated as a buy by several analysts following its IPO, but investors should also consider the potential risks and competition in the market.
In terms of upcoming IPOs, there are several AI companies that are expected to go public in the near future, including UiPath's competitor Automation Anywhere, online education platform Coursera, Google’s company Waymo, and others.
As with any investment, it is important to do your own research and consult with a financial advisor before making any decisions. While the investment potential of these companies is undoubtedly significant, investors should be aware of the risks involved in investing in new and untested technologies. AI companies are subject to a variety of risks, including regulatory risk, intellectual property risk, and competition from other companies in the sector. As such, investors should carefully consider their investment options and consult with a financial advisor before making any investment decisions.
In terms of investment potential, it's important to note that investing in AI Companies can be risky, as with any new technology. However, for those willing to take the risk, the potential rewards could be substantial. The key is to do your research and choose companies that have a solid business plan and a proven track record of success. It's also important to keep an eye on the broader market trends and economic indicators, as these can have a significant impact on the success of any investment.
When it comes to security, AI technology is still in its early stages and there are certainly risks involved. However, companies that are dedicated to building secure AI systems and investing in the necessary security measures should be able to mitigate these risks to some extent. It's also important to note that as AI technology continues to evolve, so too will the security measures that are needed to protect it.
As AI technology becomes more advanced and more widely adopted, there will be a growing demand for companies that can provide innovative solutions in this space. This presents a significant opportunity for investors who are willing to take a long-term view and invest in companies that are dedicated to the ongoing development of AI technology.
-----------------------------------------------
Risk Warning
Trading stocks and options is a risky activity and can result in losses. You should only trade if you understand the risks involved and are comfortable with the potential for losses.
Risk Disclaimer!
General Risk Warning: Trading on the Financial Markets, Stock Exchange and all its asset derivatives is highly speculative and may not be suitable for all investors. Only invest with money you can afford to lose and ensure that you fully understand the risks involved. It is important that you understand how Trading and Investing on the stock exchange works and that you consider whether you can afford the high risk of loss
Rating: Risky Buy with High Upwards Potential
Risk Disclaimer!
The article and the data is for general information use only, not advice!

GOOGLE: Next stop --> All Time High.Google maintains one of the steadiest trends of the year as not only does it remain on smooth bullish 1D technicals (RSI = 57.789, MACD = 1.700, ADX = 30.881) due to Channel Up 2 since June, but also it maintains Channel Up 1 since the start of the year. The 1D MACD indicates that the stock price has entered a 2 week consolidation phase, whose next leg up would be at least +20.52%, which is marginally over the All Time High (TP = 152.30).
## If you like our free content follow our profile to get more daily ideas. ##
## Comments and likes are greatly appreciated. ##

Google and Cambridge renew multi-year partnershipCambridge University and Google have forged a renewed, multi-year partnership aimed at funding and conducting groundbreaking research in the realm of artificial intelligence.
Their focus will be directed towards pressing concerns such as climate, healthcare, security, and the ethical deployment of emerging technologies.
Michele Donelan, the Secretary of State for Science, Innovation, and Technology, has officially confirmed this:
"Artificial intelligence can offer us enormous opportunities - growing the economy, creating new jobs and making lives longer, healthier and happier for British people."
Google: Bearish Deep Crab Dark Cloud Cover Type 2 Return EntryGoogle, after its initial bearish reaction to the PCZ, has returned to the PCZ as the RSI managed to make a 3rd lower high and is set up to give us an impulsive move downwards in the coming days. We also confirmed a textbook Dark Cloud Cover today after the rejection of the ascending trend line.
I think we will see extreme downside from Google pretty soon that will undo most, if not all of its 2023 upside price action.

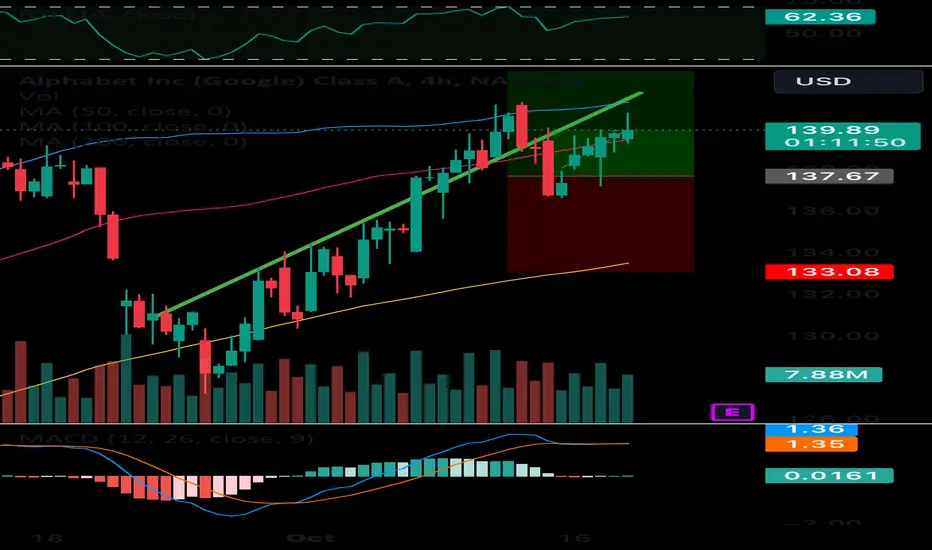
I am looking on a bullish continuation on GOOG.
As you can see here we have formed a couple of trendlines on the 4 hour chart. And If we can break the 139.97 level, we could possibly see a continuation on google. We also are above VWAP. And seeing that we have good momentum on my indicators I believe that we could see that very soon possible tomorrow. I would be looking for a breakout on the 5 minute chart for the perfect entry.

GOOG Short - B wave completionLook for the B wave completion in the next few days. If this happens it would be good for a short down to $131. I would grab an option 2 Fridays out once this is confirmed.

GOOG - TREND REVERSAL SCENARIOA U.S. Justice Department lawyer questioned a Google executive in an antitrust trial about the company's tactics for increasing online advertising prices. Google's Vice President of Product Management, Adam Juda, testified that the company uses a formula involving ad quality to determine auction winners for website advertising. The Justice Department alleges that Google manipulates these formulas to benefit its own profits, a claim Juda disputed. He acknowledged that adjustments to the formula can impact pricing. Google has faced criticism for its lack of advertising transparency, with advertisers and website publishers accusing the company of taking too much revenue. This testimony shifts focus from Google's expenditures to maintain its search engine as the default on devices.
Risk Disclosure: Trading Foreign Exchange (Forex) and Contracts of Difference (CFD's) carries a high level of risk. By registering and signing up, any client affirms their understanding of their own personal accountability for all transactions performed within their account and recognizes the risks associated with trading on such markets and on such sites. Furthermore, one understands that the company carries zero influence over transactions, markets, and trading signals, therefore, cannot be held liable nor guarantee any profits or losses.

GOOGLE ignoring the market and targets new All Time Highs!Alphabet Inc / GOOG is trading inside the well known Channel Up pattern from the bottom of the Bear Cycle and has established itself over the 1day MA50.
The 1day MA100 held the recent correction as it has been doing since March 15th.
The final box to check will be a 1day MACD Bullish Cross.
Buy and target a new All Time High at 155.
Previous chart:
Follow us, like the idea and leave a comment below!!

The premonitory future?
Would this title have taken a lead over others like APPL, GOOGL, NVIDIA, AMZ?
Maybe wait and sea :)

GOOG - Why a 25% drop Is lurking in Google StockSometimes live can be simple.
This trade is simple to me.
Let's examine it:
1. Over all Indexes are not favoring the long side.
2. Price reached the Center line and get pushed back.
3. The Divergence in the RSI is significant.
...and the rest is Risk & Money management.
My stop goes a couple points above the last high.
But I probably play it with Options and give me at least 100 days to expiry (DTE).
Simple enough? §8-)
Happy trading folks.

XLK - Bullish Weekly CrossFor the third time in XLK price history we have had a crossover of the 50 weekly MA & 100 Weekly MA.
the previous 2 times coming out of the Dot com crash and GFC when this happened it resulted in a quick multi week double digit rally.
Will this rally happened again?
XLK could rally while other aspects of the market rollover. Why? simply the cash moats of some of the Mega Cap companies insulate them more from rising yields.
Im expecting a bounce off the support level.

GOOGL Demand Swing TradeGOOGL seeing support at it's daily demand zone from where price broke it's previous swing highs.
Entry: If we continue seeing $130 hold, could be a good entry for minimal risk and a good R:R.
Stop Loss: $129
Profit Target: $136 (below daily supply)

Alphabet Inc: A Deep Dive into the Pros and Cons of Investing...Alphabet Inc: A Deep Dive into the Pros and Cons of Investing in the Tech Giant
Alphabet Inc., the tech behemoth that's likely woven into your daily life through its various products and services, has quietly become a ubiquitous presence. While Alphabet has consistently delivered solid returns to investors, it's currently trading 8% below its all-time high. This begs the question: Is this dip an opportunity to acquire shares of one of the world's best businesses at a slight discount from its peak price? Let's explore both the bullish and bearish arguments for this leading tech stock.
The Bearish Arguments
1. Competition from AI Chatbots:
One immediate concern revolves around the growing popularity of OpenAI's ChatGPT, an AI-powered chatbot integrated into Microsoft Bing's search engine. Some bearish viewpoints suggest that this could pose a threat to Google Search, which has historically dominated the market. If Bing and similar AI-powered platforms gain traction, Google's search dominance could wane.
2. Regulatory Scrutiny:
Like many tech giants, Alphabet finds itself in the crosshairs of regulators, both in the United States and abroad. The company has faced substantial fines in the past and is currently under scrutiny by the Department of Justice over Google Search's alleged monopolistic position. Regulatory risks persistently hover over Alphabet, causing concern among investors.
3. Digital Advertising Slowdown:
Another immediate challenge is the significant slowdown in the digital advertising market. After posting robust revenue growth in previous years, Alphabet's sales increased by less than 10% in 2022 and only 5% in the first half of 2023. This exposes Alphabet's business to the cyclicality of the industry, as ad spending is easily cut back during economic downturns.
The Bullish Arguments
1. Incredible Dominance and Success:
The fact that Alphabet faces regulatory threats underscores the incredible dominance this company has achieved, arguably making it one of the most remarkable businesses in history. According to CEO Sundar Pichai, Alphabet boasts "fifteen products that each serve half a billion people and six that serve over two billion each." These staggering statistics showcase the extent of Alphabet's reach.
2. Financial Strength:
From a financial perspective, Alphabet's performance is remarkable. In the last quarter (Q2 2023), the company achieved an outstanding operating margin of 29% and generated a whopping $22 billion in free cash flow. Its balance sheet is exceptionally strong, with $118 billion in cash, cash equivalents, and marketable securities, compared to just $14 billion in long-term debt.
3. Economic Moat and Network Effects:
Alphabet's wide economic moat assures investors of its enduring dominance. Network effects form the foundation of its operations, with Google Search playing a pivotal role in organizing the ever-expanding pool of internet information. Greater usage attracts more advertising dollars, enhancing the company's scale and power.
4. Data Advantage and AI Leadership:
Alphabet possesses a significant data advantage that will only strengthen over time. This data empowers the company to refine targeted ads, enhance its products, and continually innovate. Alphabet is also well-positioned to be a leader in the AI landscape. AI technology is already integral to its services like Gmail, Maps, and YouTube, making it an "AI-first" enterprise poised for future growth.
Conclusion
Investing in Alphabet Inc. offers a blend of opportunities and challenges. While regulatory concerns and market fluctuations are immediate considerations, the company's remarkable dominance, financial strength, data advantage, and leadership in AI present compelling reasons to consider it as a long-term investment. As with any investment, conducting thorough research and weighing the pros and cons is crucial before making a decision in the ever-evolving tech landscape.

Is this the end of the Google stock downtrend ?Hello ladies and gentleman ,According to my analysis of GOOGLE stock , I traced 2 strong level which was the point of the stock bullish run as you see in the chart ,But for the moment we don't have a clear confirmation for a trend reversal .So ,in the coming days we may see some changes that can affect this stock , There is a big bearish volume .
we can rely on the divergence in Rsi , we have to give big place for fundamentals now ,a lot of changes are happening ,that's what I THINK we must focus on to get a better results
I hope you appreciate my analysis ,If you have any suggestions ,please write it below to discuss it.

SPX READY TO LONG SPX LONG UNTIL 4600
Microsoft Rolling out Pilot 365
Iphone Pro Max Titanium Sales for Christmas
Nvidia Bullish
Amazon Sales for Christmas
Technical reversal
Be Patient
SIze According to your Posotion
Focus on Price action
do NOT Over trade
LET THE MARKET COME TO YOU !!!
DO NOT CHASE THE MARKET !!
Cafe City Studio 2024
Stay Profitable !! GBA !!

Alphabet (GOOGL) -> Following The NasdaqMy name is Philip, I am a German swing-trader with 4+ years of trading experience and I only trade stocks , crypto , options and indices 🖥️
I only focus on the higher timeframes because this allows me to massively capitalize on the major market swings and cycles without getting caught up in the short term noise.
This is how you build real long term wealth!
In today's anaylsis I want to take a look at the bigger picture on Alphabet.
Just 9 months ago Alphabet stock perfectly retested major previous resistance which was turned support and in confluence with a retest of the 0.618 fib level we saw a rally of 60%.
Considering that Alphabet is now retesting the channel resistance it is quite likely that we will see a short term drop before I do expect new all time highs on Google stock.
- - - - - - - - - - - - - - - - - - - -
I know that this is a quite simple trading approach but over the past 4 years I've realized that simplicity and consistency are much more important than any trading strategy.
Keep the long term vision🫡

GOOGLE GOOGL - The ending diagonal formation on the stock signals a pause in the upward move. With a downward break of the structure, we are likely to see bearish pressure here.

GOOGLE, Massive FLAG-FORMATION Completed, Targets Activated!Hello There!
Welcome to my new analysis of GOOGLE. There are important developments going on within the whole stock market as the volatility increased within the recent quarter the market momentum is likely to reach major extinctions throughout the next months in 2023. What is important here is that traders do not get trapped in just trading the whole market in the same direction because this can be highly fatal as there are many different setups within the market, bullish as well as bearish. Therefore, it is of utmost overwhelmingly high importance to choose the setups with a bullish potential for the long side and the setups with a bearish potential for the short side to move forward with the total-return approach which I already pointed out in previous publications.
With GOOGLE I have spotted interesting underlying dynamics that point to a major bullish scenario perspective and a main approach on the bullish side. When looking at my chart GOOGLE recently completed this major ascending bull-flag formation with the breakout above the upper boundary which it is now forming the next continuation formation that is approving the full completion of this major formation. The price action towards the uptrend direction is backed by the 65-EMA, the 35-EMA, and the major uptrend channel. Also, the price action already moved on with emerging with the paramount wave count with the major wave C now developing to move into the upper spheres of this whole chart price action.
With the completion of the major bull flag formation, the price action has activated the first main target zone within the 146.25 level as it is marked in my chart. Once this zone has been reached it will be highly important to determine with which volume the price action reached the zone, if it is steadily increasing higher also there is an important potential for the wave C extension to emerge with a breakout above the initial target zone. When this happens and GOOGLE has the ability to emerge with the wave C extension this is going to activate the next target zone as marked in my chart within the 157.05 level. The next times will be highly decisive here. Remember, that not every stock within the market is showing such bullishness, therefore it is necessary to measure the main underlying dynamics as I am doing it within my analysis.
In this manner, thank you everybody for watching my analysis of GOOGLE. Support from your side is greatly appreciated.
VP

GOOG - BULLISH OUTBRAKEIn the ongoing trial that commenced on Tuesday, the Justice Department is presenting its case, contending that the Alphabet unit (NASDAQ:GOOGL) actively pursued agreements with mobile carriers to secure prominent default placements on smartphones, thereby establishing a dominant position in the realm of online search. This antitrust trial, touted as one of the most significant in recent history, carries profound implications for the future landscape of the internet.
During Thursday's proceedings, the government concluded its examination of Antonio Rangel, an expert in behavioral biology affiliated with the California Institute of Technology. Rangel advanced the argument that consumers are inclined to maintain allegiance to web browsers on both desktop computers and mobile devices, particularly those that come pre-installed as the default application. This assertion underscores the potential consequences of default application placements in shaping user behavior and preferences within the digital ecosystem.
Winning such proceeding may skyrocket the Internet Giant.
Risk Disclosure: Trading Foreign Exchange (Forex) and Contracts of Difference (CFD's) carries a high level of risk. By registering and signing up, any client affirms their understanding of their own personal accountability for all transactions performed within their account and recognizes the risks associated with trading on such markets and on such sites. Furthermore, one understands that the company carries zero influence over transactions, markets, and trading signals, therefore, cannot be held liable nor guarantee any profits or losses.

GOOGL with a strong upward breakthrough this weekGOOGL with a strong upward breakthrough this week
This chart shows the weekly candle chart of Google stock over the past year. The graph overlays the bottom to top golden section at the end of 2022. As shown in the figure, Google stock tested the bottom of the chart against the 2.618 position of the golden section three times in July and last week, with a strong upward breakthrough this week! The recent pressure level of Google stock is the 3.000 level at the bottom of the graph above the golden section, which is likely to suppress the market's rise! Google stock is likely to significantly retreat in the future, at least testing the 2.000 position of the golden section in the chart!
