SPX READY TO LONG SPX LONG UNTIL 4600
Microsoft Rolling out Pilot 365
Iphone Pro Max Titanium Sales for Christmas
Nvidia Bullish
Amazon Sales for Christmas
Technical reversal
Be Patient
SIze According to your Posotion
Focus on Price action
do NOT Over trade
LET THE MARKET COME TO YOU !!!
DO NOT CHASE THE MARKET !!
Cafe City Studio 2024
Stay Profitable !! GBA !!

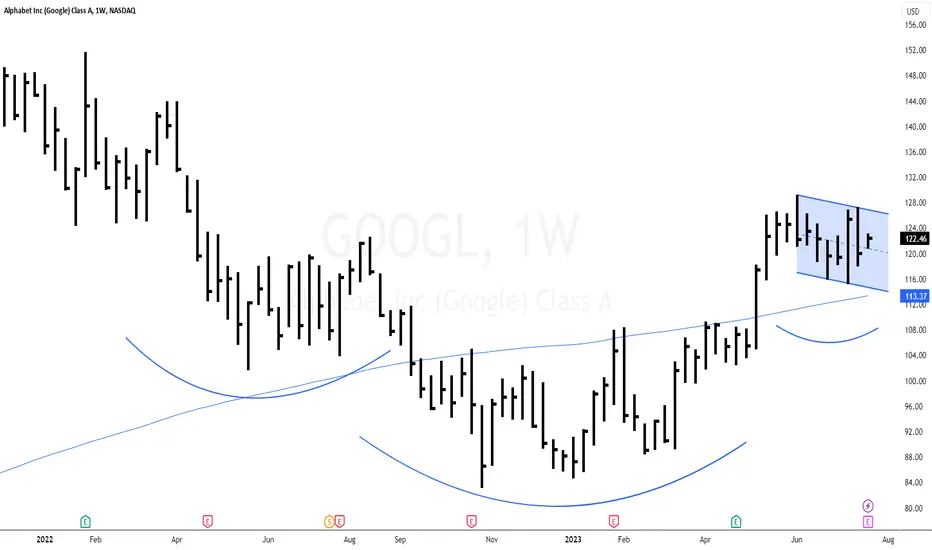
Alphabet (GOOGL) -> Following The NasdaqMy name is Philip, I am a German swing-trader with 4+ years of trading experience and I only trade stocks , crypto , options and indices 🖥️
I only focus on the higher timeframes because this allows me to massively capitalize on the major market swings and cycles without getting caught up in the short term noise.
This is how you build real long term wealth!
In today's anaylsis I want to take a look at the bigger picture on Alphabet.
Just 9 months ago Alphabet stock perfectly retested major previous resistance which was turned support and in confluence with a retest of the 0.618 fib level we saw a rally of 60%.
Considering that Alphabet is now retesting the channel resistance it is quite likely that we will see a short term drop before I do expect new all time highs on Google stock.
- - - - - - - - - - - - - - - - - - - -
I know that this is a quite simple trading approach but over the past 4 years I've realized that simplicity and consistency are much more important than any trading strategy.
Keep the long term vision🫡

GOOGLE GOOGL - The ending diagonal formation on the stock signals a pause in the upward move. With a downward break of the structure, we are likely to see bearish pressure here.

GOOGLE, Massive FLAG-FORMATION Completed, Targets Activated!Hello There!
Welcome to my new analysis of GOOGLE. There are important developments going on within the whole stock market as the volatility increased within the recent quarter the market momentum is likely to reach major extinctions throughout the next months in 2023. What is important here is that traders do not get trapped in just trading the whole market in the same direction because this can be highly fatal as there are many different setups within the market, bullish as well as bearish. Therefore, it is of utmost overwhelmingly high importance to choose the setups with a bullish potential for the long side and the setups with a bearish potential for the short side to move forward with the total-return approach which I already pointed out in previous publications.
With GOOGLE I have spotted interesting underlying dynamics that point to a major bullish scenario perspective and a main approach on the bullish side. When looking at my chart GOOGLE recently completed this major ascending bull-flag formation with the breakout above the upper boundary which it is now forming the next continuation formation that is approving the full completion of this major formation. The price action towards the uptrend direction is backed by the 65-EMA, the 35-EMA, and the major uptrend channel. Also, the price action already moved on with emerging with the paramount wave count with the major wave C now developing to move into the upper spheres of this whole chart price action.
With the completion of the major bull flag formation, the price action has activated the first main target zone within the 146.25 level as it is marked in my chart. Once this zone has been reached it will be highly important to determine with which volume the price action reached the zone, if it is steadily increasing higher also there is an important potential for the wave C extension to emerge with a breakout above the initial target zone. When this happens and GOOGLE has the ability to emerge with the wave C extension this is going to activate the next target zone as marked in my chart within the 157.05 level. The next times will be highly decisive here. Remember, that not every stock within the market is showing such bullishness, therefore it is necessary to measure the main underlying dynamics as I am doing it within my analysis.
In this manner, thank you everybody for watching my analysis of GOOGLE. Support from your side is greatly appreciated.
VP

GOOG - BULLISH OUTBRAKEIn the ongoing trial that commenced on Tuesday, the Justice Department is presenting its case, contending that the Alphabet unit (NASDAQ:GOOGL) actively pursued agreements with mobile carriers to secure prominent default placements on smartphones, thereby establishing a dominant position in the realm of online search. This antitrust trial, touted as one of the most significant in recent history, carries profound implications for the future landscape of the internet.
During Thursday's proceedings, the government concluded its examination of Antonio Rangel, an expert in behavioral biology affiliated with the California Institute of Technology. Rangel advanced the argument that consumers are inclined to maintain allegiance to web browsers on both desktop computers and mobile devices, particularly those that come pre-installed as the default application. This assertion underscores the potential consequences of default application placements in shaping user behavior and preferences within the digital ecosystem.
Winning such proceeding may skyrocket the Internet Giant.
Risk Disclosure: Trading Foreign Exchange (Forex) and Contracts of Difference (CFD's) carries a high level of risk. By registering and signing up, any client affirms their understanding of their own personal accountability for all transactions performed within their account and recognizes the risks associated with trading on such markets and on such sites. Furthermore, one understands that the company carries zero influence over transactions, markets, and trading signals, therefore, cannot be held liable nor guarantee any profits or losses.

GOOGL with a strong upward breakthrough this weekGOOGL with a strong upward breakthrough this week
This chart shows the weekly candle chart of Google stock over the past year. The graph overlays the bottom to top golden section at the end of 2022. As shown in the figure, Google stock tested the bottom of the chart against the 2.618 position of the golden section three times in July and last week, with a strong upward breakthrough this week! The recent pressure level of Google stock is the 3.000 level at the bottom of the graph above the golden section, which is likely to suppress the market's rise! Google stock is likely to significantly retreat in the future, at least testing the 2.000 position of the golden section in the chart!

SP 500 SELL READY Time to Sell
no Big Stocks Earnings coming soon
Only Technical analisis
Size Apropietly
SPX Back to 4350 TP
Stop Loss 4550
Take Profit 4350
Enter Now !!
Be Patient .
Cafe City Studio 2024
SP:SPX

Google -> Trading The Major Swings...Hello Traders and Investors ,
my name is Philip and today I will provide a free and educational multi-timeframe technical analysis of Google 💪
Just a couple of months ago Google stock perfectly retested a major monthly bullish trendline and in confluence with a retest of the 0.618 fibonacci level we already had a major rally of more than 50% towards the upside.
If you are looking at the weekly timeframe you can also see that Google stock just broke above and retested the strong psychological $125 level and everything is looking massively bullish.
Finally I am now just waiting for another retest of the daily $132 level and after some bullish rejection everything is pointing towards more bullish upside.
Keep in mind: Don't get caught up in short term moves and always look at the long term picture; building wealth is a marathon and not a quick sprint📈
Thank you for watching and I will see you tomorrow!
My previous analysis of this asset:

Google Long term analysis More likely is another sub-wave 5 up to complete Wave III before the big correction. And after big Wave V to 150 -160.

Palantir - Fear Worshippers of The All Seeing EyeI have to say that Palantir is a really difficult chart to read. On the one hand, looking at monthly bars, it's the kind of pattern which indicates new highs are in store.
Weekly bars are about the same. Nothing about this says you can short.
And its only that there's some divergences on the daily. But those divergences are really meaningful.
However, at the same time, although it's up some 220%+ from the bottom, the bottom did take out the IPO low, which is not bullish.
And these high prices are coming at a time when the Nasdaq and the SPX may very well have topped, which I address in my latest call:
SPX - The Sound of a Shattering Iceberg
Palantir is a company that is ostensibly a key component of the panopticon surveillance network that underlines the International Rules Based Order's version of the Chinese Communist Party's social credit system.
At least, this is what rightists would tell you. If you asked the people behind the West's implementation of social credit, they would say they just seek to advance an enlightened society while keeping stability and security under control, and big data collection is crucial to that.
Well, if you ask CCP members, they would tell you the same thing, just coated in Marxist jargon.
And therein lies the problem. Mankind needs to return to its 5,000 year old traditions, which were reared and established over China's long dynasties, instead of trying to go Big Atheism and reinvent The Wheel.
Regardless of if Palantir at its current $37 billion valuation is a part of the future or a part of the past and gone with the wind, the last three months of trading have been totally one directional.
Which makes wanting to get short very deadly.
However, conditions for a short setup that is at least a scalp were formed with the July high on the 19th.
The reason for this is that price swept a key level and was met with a stiff rejection, taking a pivot.
All on its own, in the stock market with the way it just likes to go uppy or grind sideways, this makes shorting or puts hard, still.
But what we saw is daily candles double bottom at precisely $16.00, with Friday's trading session being yet another big green gainer on the back of such a bottom.
And so, as Buffet said, one should be fearful when others are greedy, and greedy only when others are fearful.
So the trade is to short somewhere between where we closed on Friday and over $18.
When another dump occurs, where it dumps to will tell us everything about the future.
If Palantir is truly bullish to more upside, it will preserve the June low at $13.56.
If it's really bullish, it should even preserve the July low at $14.62
If it's bullish, but is going to take until 2024 to go higher, we can expect prices under $12.
If it's bearish, prices under $11 are the target, with an all time low on deck and about to hit everyone on the face.
Which do I think is the most likely? Frankly, probably a dump under $15 and a new high in August.
There's no other way to put it or look at it at the moment.
For things to be different, you'd need something like a banking crisis to intervene in the markets, a prospect I undertake here:
Charles Schwab - The Harbinger Of The Next Crisis?
I believe that, all things considered, the risk side of the trade right now is people who are longing this top, regarding it as a dip to buy, expecting more highs.
Because people have capitulated, become greedy, and have taken their eyes off the clock.
You should remember that you're just standing in an equities bear market rally while central banks have their key rates pinned over 5% and no intention to cut.
This is bad news for stocks, and yet people are being told indexes are set to make a new all time high.
Repricing to the downside can come violently, aggressively, be gappy, and will give those on the wrong side of the trade no chance to get out.
Be very careful.

Alphabet's Stellar Performance Steals the Spotlight...Investor Enthusiasm Ignites as Alphabet's Stellar Performance Steals the Spotlight
Alphabet, the technological powerhouse, has ignited a blaze of excitement among investors with its latest financial report, revealing a striking showcase of accomplishments. With an impressive revenue tally of $74.6 billion and a robust $1.44 in diluted earnings per share, Alphabet has confidently outpaced Wall Street's predictions, sending its stock soaring in the aftermath of this announcement.
This surge in positive momentum isn't an isolated event but rather a continuation of a larger trend. Throughout the initial seven months of 2023, Alphabet's shares have outshone the Nasdaq Composite Index by an astonishing 50%, positioning the company as a beacon of success in the tech arena.
Amidst these resounding triumphs and bolstered by its trillion-dollar valuation, the pertinent query arises: Is this an opportune juncture to delve into an investment with this tech titan?
In the early reaches of 2022, as the Federal Reserve embarked on an assertive campaign of interest rate hikes to combat the burgeoning inflation threat, economists sounded the alarm for an impending recession. This climate of economic uncertainty prompted cautious corporate strategies, leading to curtailed marketing expenditures. The prevailing concern was that dwindling consumer demand might prompt individuals to prioritize essential essentials over discretionary splurges, rendering amplified advertising endeavors seemingly redundant.
In alignment with these cautious corporate maneuvers, Alphabet faced a dip in advertising revenue during the fourth quarter of 2022, with a slight residual dip spilling into the first quarter. However, the most recent quarter's records unveiled a promising uptick of 3% year-over-year in digital ad revenue. This resurgence paints a picture of Alphabet's prime driver – advertising – gaining momentum and veering towards a path of more normalized growth trajectories.
As economic pundits recalibrate their forecasts, lessening the odds of a 2023 recession, the burgeoning trend of escalating ad expenditures could potentially sustain its course across forthcoming quarters. Bearing in mind that ad revenue contributes a substantial 78% to Alphabet's overall company-wide earnings in Q2, this favorable development could undoubtedly bode well for the conglomerate's financial performance.
While Alphabet's advertising revenue strides modestly within single-digit percentages, a radiant star on its horizon is the Google Cloud Platform (GCP). This segment, responsible for a gamut of cloud services spanning computation, data storage, and AI tools, achieved a resplendent $8 billion in sales during the latest quarter – a robust surge of 28% in contrast to Q2 2022. This progression maintains a consistent rhythm from the preceding quarter.
A noteworthy watershed for stakeholders emerges in the form of GCP's burgeoning financial prowess. For the first time in its history, this segment garnered positive operating income within the initial quarter of the current year. Furthermore, the operating margin extended its boundaries to 5% during this latest three-month phase. Should GCP persevere along this trajectory and ultimately reach the commendable 28% operating margin precedent set by Amazon Web Services in 2022, Alphabet's holistic profitability stands poised for substantial amplification across forthcoming years.
With global cloud market forecasts predicting a staggering $2.4 trillion opportunity by 2030, GCP stands at a vantage point to steadfastly wield its leadership in this burgeoning industry. Presently positioned third in market ranking according to Statista, GCP finds itself ideally positioned to continually invest in fortifying its service portfolio for both present and future clientele, armed with a wealth of financial resources and access to top-tier technological talent at Alphabet's disposal.
Despite a meteoric ascent in the annals of 2023, Alphabet's stock remains alluringly valued. Currently, shares are traded at a trailing price-to-earnings (P/E) ratio of 28, situated beneath the 10-year average P/E multiple of 30.6. Amplifying this appeal, with a projected increase in net income, the forward P/E ratio emerges even more enticing at 23.9. These valuation metrics inherently furnish compelling rationales for contemplative investment in this reigning corporate giant.
Augmenting its charm, Alphabet showcases a robust financial stance as of June 30, boasting an impressive $118 billion in a confluence of cash, cash equivalents, and marketable securities, all resting snugly within its balance sheet. Moreover, its long-term debt strikes a modest chord at $14 billion. The company's consistent generation of substantial free cash flow further solidifies its stance as a stalwart stock suitable for the discerning investor to embrace and maintain in their portfolio.
Amidst a landscape characterized by its tantalizing valuation, robust financial posture, and an unwavering stream of cash flow, Alphabet emerges as an enticing prospect for those seeking a stable and propitious addition to their investment repertoire.

What about google stock?The stock descended in wave A, a strong decline, and the rebound was in wave B, and it is possible that wave C will complete a strong five-wave decline, thus completing a triple decline, and then preparing for the rise of a new impulse and making a larger historical peak.
Note.. The scenario fails if the price closes above the $152 area

Amazon - Greed, Just Like Speed, KillsFirst, I understand that Amazon had an excellent earnings report, whether analyst estimates were gamed to the downside and it was easy to beat notwithstanding.
What you have to be really careful of right now is the excess greed that abounds in the markets. Greed is the thing that kills accounts the fastest, and when you blow your account, there won't be any use for TradingView anymore, and nobody will be able to have fun until you can save up to reload.
I am not saying any kind of bearish commentary on Amazon, although you should have reservations on this company because a lot of its business model is just to serve as an export faucet for stuff made in the Chinese Communist Party's land.
And you have to be careful with anyone whose business is tightly knit to communist China, because the International Rules Based Order is chattering disaster about "de-risking" from China.
Because the narrative about "Taiwan Invasion" really means that the CCP is close to falling and everyone is thinking about how to take control of that country.
But to take control of China, you need someone Chinese, which means you need a handpicked appointment from the Republic of China who will serve the globalists.
All this, and the 24th year of persecution against Falun Dafa by the CCP's Jiang Zemin faction just completed on July 20. In 1999, Jiang began a full genocide and organ harvesting campaign against 100 million spiritual believers, and it's persisted to this day despite Xi Jinping never participating.
In fact, Xi's Anti-corruption Campaign has been hitting the corrupt officials involved in the persecution ever since he took power in 2012.
Consider that the next time you see the media going off about what a Mao Zedong Xi Jinping is.
Amazon's monthly provides some clarity. The most notable thing is that the 2021-2022 distribution bars during the rest of the market's bull run indicates a proper and clear topping pattern.
And despite that, price never took out the most critical of lows, the COVID pivot at $81.30.
Instead, it spared it by 13 cents. Because numerology.
What it means is that long term, $80 becomes a target.
What's notable about price action before today's earnings report pump is that Amazon maintained the July low, albeit barely.
And this creates three weekly lows of equal "support."
Which also becomes a target.
Bear in mind, with Nonfarm Payrolls also being tomorrow morning, you may get yourself a trade setup that looks something like what happened to AMD on Wednesday:
AMD - Greed Doth Bad Habits Breed
When its ER came in hot in premarket and at open, and turned into a huge sell off and red day:
So the point with this call is to say that the August '22 $146 pivot may really hold. And if it doesn't hold, it might just get raided.
Which makes buying the top tomorrow morning something that isn't a particularly intelligent thing to do.
Worse, it means that buying the dip may be trading in the wrong direction, while selling the dump's retrace might actually be an optimal short entry.
Just keep in mind that we may have as much as another 2-3% of downside left in the SPX before we retrade towards/take out the tops:
SPX - The Sound of a Shattering Iceberg
If the markets really get blown to pieces heading into the end of Q3 in accordance with the JP Morgan collar, stuff like Amazon is going to head to a 5-handle by next year.
SPX/ES - An Analysis Of The 'JPM Collar'
You'll know the truth, in my opinion, when Amazon breaks the $125 flat bottoms, price won't come back, just like what happened with Netflix:
Netflix - I Hope You Like Catching Knives
What I really want to tell you all is that life still seems stable, it seems like all there is to worry about is making money and entertainment. But our world may very well change overnight, with no warning at all.
And what we've all done while the cards were still face down will be what determines who wins the pot and who loses their stack.

Some Technical Areas For Tesla, Apple & AlphabetHi,
A little guide for you about Tesla, Apple, and Alphabet. Pointed out some key areas from where to take out some profits or if you are interested in some sort of stocks then a couple of scarious from where you can jump in. Not an idea post, more like an analysis but still, it should give you a little picture about them.
Tesla (TSLA)
Recently the Tesla stock has been respected by technical analysis quite nicely. Several calls have worked almost perfectly and short-term targets are reached fairly easily.
Currently, for me, the Tesla stock is in the middle of nowhere. My previous short-term target was around $300 and it has been reached, so I will wait for further price action. If the price goes above $300 then I will consider it as a breakout and I need to see a price action above that to make a decision.
The sweet spot for me is the $190-$220. If the price reaches there then I'm ready to take it but we need to see a quite good selloff - let's see.
So, if you are not in Tesla then wait for a breakout above $300 which can confirm further growth, or wait for a pullback/selloff to the mentioned lower price zone.
Apple (AAPL)
This year has been quite good for Apple, the gain from the bottom is 58%. In the first week of 2023, it bottomed and after that, very solid and consistent grind to higher levels - a new all-time high has reached.
If you are on it then short-, and mid-term investors can think about taking some profits because it has reached to the round number of $200. The round number can act as a resistance level and the price can be stuck there for a while or it can get a rejection to downwards. So, if you don't have a long-term plan with AAPL then there is a place to take out some profits.
If you don't have any Apple shares then you should wait. Firstly, how the $200 act and wait for the price action. If it gets a pullback then you can grab it from the previous highs which now start to act as support levels. These are not the strongest areas but at least you have something to stick with because to buy it from the current price can be quite a huge mistake considering short-term investment.
So, if you see a pullback then be ready to act around 170 to 180 dollars, and the strongest price zone is around ~$150.
Alphabet (GOOG)
Technically the last weekly candle close was a small breakout. $126.5 has been a minor horizontal price level. This level has been a short-term support level and a couple of months ago it acted, and stopped the price, as a resistance. Now, we have this level "smashed" with quite a solid weekly candle and if you are interested then technically you have a light-green light to take it during the retest of ~$126.
Stay cautious after you have seen a monthly or weekly close below this level.
Regards,
Vaido

GOOGL: Closing The Gap Soon?Hello Fellow Stock Traders, Here's a Technical Analysis of GOOGL!
Alphabet Inc. (GOOGL) has exhibited a notable price development by surpassing its Exponential Moving Average 50 (EMA50) and subsequently rebounding off the dynamic support level. This particular price action suggests a bullish trend in the stock. Moreover, there has been an identifiable formation of a descending broadening wedge, followed by a breakout of the upper trendline, accompanied by a bullish marubozu candlestick pattern. This breakout signifies the potential for an upward movement in the stock price.
Furthermore, the bullish outlook is reinforced by the emergence of a golden cross on the Stochastic indicator within the Neutral Area. The occurrence of a golden cross within this context typically indicates a higher probability of an upward movement toward the target area.
Taking these technical factors into consideration, the current price action and indicators point towards a positive outlook for GOOGL, suggesting the likelihood of an upward trajectory in the near term.
It is important to note that the roadmap will no longer be valid once the target/support area is reached.
Feel free to support the channel by clicking the rocket button and sharing your opinions in the comments below!
"Disclaimer: This analysis is intended solely for educational purposes and does not constitute a recommendation to take a long or short position on NASDAQ:GOOGL ".

Discover the Hottest USA Stock Market Sectors - Get Ready for anI couldn't wait to share the hottest USA stock market sectors set to sizzle this August. Brace yourself for an action-packed month with potential profits and exciting investment opportunities!
1. Technology Titans: The tech sector continues to dominate the market, with innovative companies leading the charge. From cutting-edge software solutions to breakthrough hardware advancements, this sector promises immense growth potential. Stay ahead by closely monitoring tech giants like Apple, Amazon, and Google.
2. Renewable Energy Revolution: The renewable energy sector is rising as the world shifts towards sustainable practices. Solar, wind, and hydroelectric power companies are experiencing a surge in demand, presenting a remarkable chance to invest in a greener future. Keep an eye on industry leaders such as Tesla, First Solar, and NextEra Energy.
3. Biotech Breakthroughs: The biotech sector is witnessing a wave of groundbreaking advancements in healthcare and pharmaceuticals. Companies focused on developing innovative treatments, vaccines, and therapies are gaining substantial attention. Keep a close watch on biotech giants like Moderna, Pfizer, and Johnson & Johnson.
4. E-commerce Explosion: The pandemic has accelerated the growth of the e-commerce sector, and it shows no signs of slowing down. Online retail giants are experiencing exponential growth as consumers embrace the convenience of digital shopping. Keep an eye on industry heavyweights like Amazon, Shopify, and eBay.
Now, here comes the exciting part! To ensure you don't miss any action this August, I encourage you to subscribe to our exclusive newsletter or follow our social media channels. By doing so, you'll receive regular updates, expert insights, timely tips on these hot sectors, and more.
Don't let this opportunity pass you by! Stay ahead of the curve and make informed investment decisions by subscribing or following.
Remember, August is shaping up to be a thrilling month in the stock market, and you don't want to miss out on the potential gains these sectors offer. Subscribe/follow now and get ready for an exhilarating ride!

Microsoft - Is The Top Already In?One of the key points to Microsoft is it is, in essence, a U.S. state-backed corporation, and one that is trading at more than $2.5 trillion market cap at present.
You're looking at a company that just set a new all time high while the overall market is not healthy and the macroeconomic fundamentals are actually bearish.
And so, we have to seriously ask ourselves if it's time to short God the top.
Microsoft's price action on the monthly is curious.
The price action is healthy and natural all the way from where it bounces to the top, and only becomes curiously strange when it gets to the top.
Why does a stock that bounces at the right place and forms a fully proper reversal pattern, which we see on the weekly:
Only sweep the All Time High?
Why doesn't it raid the ATH and run bigly larger like NVDIA did?
Well, the answer is actually quite clear when you overlay NVDA to MSFT:
In essence, NVDA at $480-450 is MSFT at $350. The difference in price action you see today is because NVDA was relatively weaker in the past, meaning MSFT was inordinately strong in the past.
Anything that reaches an extreme will reverse. If it reaches the extreme twice, it will reverse hard twice.
The geopolitical situation in the world is not healthy. There is a ton of sabre rattling between NATO and the Nation of China at the moment.
The western propaganda machine wants you to believe that Xi Jinping intends to invade Taiwan because he's very evil very super Mao Zedong++, but in reality it's more like the "International Rules Based Order" wants to use the fact that the Chinese Communist Party is rotten and unforgivable as a handle to depose Xi and have Taiwan invade the Mainland under the guise of international "aide".
Why this matters to you as a trader is because you're flirting with getting gapped down hard since Beijing daytime is New York night time.
If you want to be long right now you need to be hedged long volatility, or you're risking your life.
Moreover, Xi, in order to defend himself, his faction of Chinese nationalists, and China's 5,000 year history, can overthrow the CCP in a Gorbachev-style coup overnight, weaponizing the 24-year-long persecution and genocide of Falun Dafa by the faction belonging to former Chairman Jiang Zemin (it died this year).
The significance is major to traders because your beloved governments, banks, and corporations have stained their hands crimson flirting with the Jiang faction toadies in Shanghai (Babylon) in order to get all the benefits they desire.
Google the Neil Heywood story if you want to see a classic example of a British billionaire getting gibbed by the greatest evil of all time.
Much to do before the call's key points.
Before we continue, I examine the price action I expect to manifest in SPY (SPX Futures ETF) for the remainder of the month, which can serve as something of a compass for what lies ahead:
SPY - A Dip Is Coming. Maybe Buy It?
Back to MSFT:
This is a very hard setup to trade
Because the June high may have been a hard top, double and triple top or not (See TSLA July-September '22)
Lower lows lower highs indicates the dip is hard to buy
But the short may only take us to the $320 range.
Sweeping $300 is the key to a bullish continuation above the highs
Maintaining ~$280 is the key to continuing upwards at all.
Microsoft has a really notable catalyst in that its earnings are on July 25 postmarket, which means price action will manifest the morning of July 26, which just so happens to be when the next FOMC meeting is.
After July FOMC the next FOMC is deferred until September 20, 9 days short of quarter end, notable because of the notorious JPM Collar, which I discuss here:
SPX/ES - An Analysis Of The 'JPM Collar'
What I expect is we see a fairly violent correction on Microsoft back to the $300s before we can see any kind of further meaningful flirtation with a run over the $350 ATH.
But the June high may have been the top for the foreseeable future, as evidenced by the relationship between NVDA and MSFT.
Be careful. The time we have left for happy and normal days is so short you can almost count it on the fingers.
When things really emerge, Nasdaq 8,500 will be the least of your concerns, really.

Netflix - I Hope You Like Catching KnivesNetflix is that $200 billion company trading at $441.44 that everyone seem to have forgot about, even though it more than doubled in a year.
Personally, I think these streaming services are a colossal waste of your time and money. What you're watching is the intellectual equivalent of a Big Mac or a bag of potato chips, and permeated with the things of socialism and atheism.
And Netflix is really quite woke and some of the content is unforgivably degenerate.
You shouldn't look at warped mirrors and shouldn't cast your eyes on ugly things, or they'll twist your heart and your soul.
When it comes to the markets-at-large, I believe we're definitely going to see a correction, rather than a new all time high, which I detail in the two calls below:
Nasdaq NQ - A Fundamental and Technical Warning Signal
SPX/ES - An Analysis Of The 'JPM Collar'
If there's to be a new all time high, let's wait and see what Q4 has in store for us.
There's a lot of geopolitical risk in the markets right now. The War between the Russian Federation and NATO via Ukraine is a big one, and a bigger one is the situation in Mainland China with Xi Jinping and the Chinese Communist Party.
More or less, I believe the globalists want to topple the Party to have their men from Taiwan go in and take control of China and depose Xi.
But I believe Xi is likely to topple the Party himself before that can happen.
Big gaps will come that day and things will be very hard because Wall Street won't be in any kind of a risk-on mood.
The 24-year persecution against Falun Dafa launched by former Chairman Jiang Zemin and the Shanghai toad faction is something Xi can weaponize to implicate the entire world.
Because to do business in Shanghai you've needed the Jiang Faction's approval. To get its approval, you've had to dirty your hands in the persecution and swear vows to the Flag of Blood.
And unfortunately, most of the world has wanted what the Party has. Read the story of British billionaire Neil Heywood, who decided to court Jiang's minion Bo Xilai.
Bo told Heywood that to prove his loyalty he had to divorce his wife. Heywood refused, and so Bo's wife poisoned him.
Heywood died in 2011.
Bo Xilai was ruined in Xi's Anti-corruption Campaign in 2013, stripped of all his assets, and sentenced to life in prison in a CCP dungeon.
Gambling with the Party is one foot in the grave and the other in prison. Live a virtuous life instead.
Moreover, they always say zoom out. Looking at Netflix on the yearly, it's hard to say you're not in the crosshairs of a savage trend reversal.
And you can see these daily bars far more clearly on the weekly chart:
There might be that fat gap above that you have your eye on, but you're dealing with a very long and very steep ramp in the first place, and this is in a stock which stayed away from a true gap between April and August of '22.
Another notable factor is that the FINRA short volume for Netflix, while still notably low, is the highest it's been in three months and posted its first green month since April and only its second of '23.
Short volume
This is quite notable in light of the fact that June was one of the best months for equities in a long time
Netflix doesn't have an ETF, except for a 3x levered ETF on the Mexico exchange. Insignificant except for it fell from 5 pesos to 5 pennies.
What's sad is even if it Netflix was to fall 50% in value the thing would still only be worth like 30 cents. % base levered ETFs will kill you.
So, here's the call.
Netflix printed a proper daily pivot in mid June (you'll have to look yourself because I can't zoom the chart in for the post) and has been flirting inside that range ever since.
If she makes a new high I suppose then it's time for more uppy and you can buy calls at the top and feel pretty good.
But if she breaks the $420 range the next area to watch is the June low, which Netflix printed on a green candle and on the first day of the month at $393
After that, things might happen and happen fast.
If bearish momentum and level breaking manifests, then where I believe it will return to is the $180 to $160 range.
For Netflix to have a chance to return above $500, it will have to hold the $162.71 bottom.
If you can catch that falling knife you'll feel pretty smart if you can hold the bag for a few months.
But if you try to go long before the bottom you'll cut your hands and cut your hands some more.

Google Bull Run StartsBought NASDAQ:GOOG at 106 $ and my targets are as shown on the chart
The reason for me is because the price has already breakout the price channel and retest it
Please let me Know what do you think

Recent high point of Google stock at 2.382 on the Golden Divide!Recent high point of Google stock at 2.382 on the Golden Divide!
This chart shows the weekly candle chart of Google stock over the past year. The graph overlays the low point at the end of 2022 against the golden section. As shown in the figure, the recent high point of Google stock happens to be at 2.382 on the Golden Divide! In the past six weeks, Google stock has been vying for long and short positions around the 2.000 position on the golden section in the chart, but has not effectively touched the strong support below, which is the 1.618 position on the golden section! In the future, Google's stock is likely to strengthen again after hitting the 1.618 or 1.382 positions in the golden section of the chart!

GOOG Post earning Analysis|25th July 23I am pretty confident about price hitting $136 and then $138. Make sure to understand price action in depth.

$GOOGl Technical AnalysisNASDAQ:GOOGL has several bullish patterns forming. There is a Bull Flag consolidating, there is inverse head & shoulders pattern, and NASDAQ:GOOGL is above the 150 day moving average showing an uptrend.
GOOGLE How is it looking before the earnings?It has been very long since we last looked into Google (GOOG) but last time we did (November 07 2022) we gave a massive buy signal (see chart below) at the market's absolute bottom:
The stock price rose +49% since then, giving us one of the most successful low risk trades of the year. With the company reporting its Earnings today though, we shift back to the 1D time-frame where the stock has been trading within a clear Channel Up throughout this recovery phase. Based on the 1D MACD Bearish into Bullish Cross sequence, we may be at a Higher Low leg as on March 13.
As long as the price is trading within the Channel Up and the (dotted) Channel Down, we remain bullish, aiming at a +21% rise (standard inside the Channel Up) and a price target of $140.00. If the price breaks below the Channels' bottoms, we will sell, targeting the 1D MA200 (orange trend-line) at $106.50.
-------------------------------------------------------------------------------
** Please LIKE 👍, FOLLOW ✅, SHARE 🙌 and COMMENT ✍ if you enjoy this idea! Also share your ideas and charts in the comments section below! **
-------------------------------------------------------------------------------
💸💸💸💸💸💸
👇 👇 👇 👇 👇 👇
