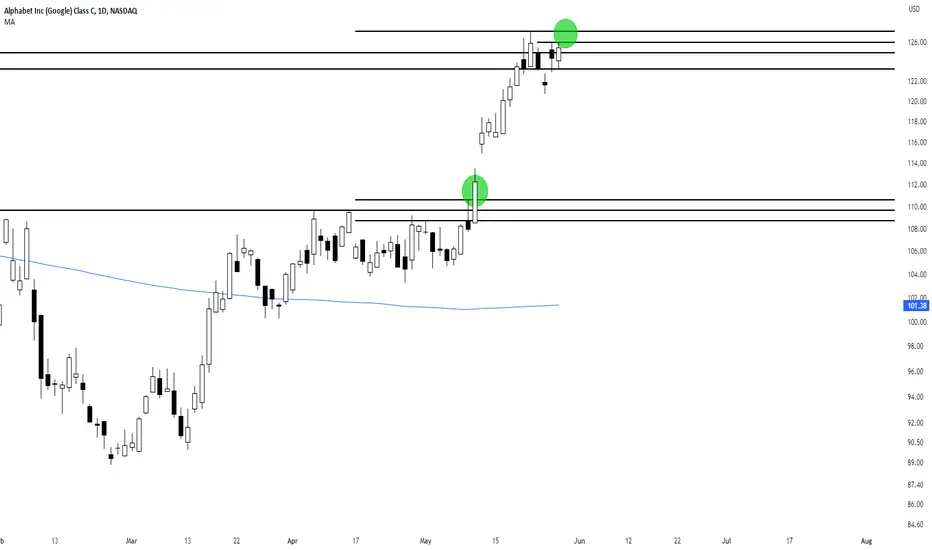
GOOGL Alphabet Options Ahead of Earnings ! Sell-Off Thesis !If you haven`t sold GOOGL here:
or reentered here:
Then analyzing the options chain and chart patterns of GOOGL Alphabet Inc prior to the earnings report this week,
I would consider purchasing the 115usd strike price Puts with
an expiration date of 2024-1-19,
for a premium of approximately $6.15.
If these options prove to be profitable prior to the earnings release, I would sell at least half of them.
While Google currently holds a dominant position in the search engine market, the landscape is dynamic and subject to change. If Microsoft successfully leverages its partnership with OpenAI to enhance Bing's capabilities, coupled with strategic marketing initiatives, it could potentially chip away at Google's market share over time.
You can read my full GOOGL Sell-Off thesis here:
Looking forward to read your opinion about it.

Google seems to be falling along with other Fintech and giants as we can see google is consolidating at its ATH so there are good chances that, this ticker falls down and retraces down to its preview supports
as we know there are some fundamental news also going on about some anti-republican activity and censorship on YouTube and other domains in this company so we can have some fall speculation on this company for a while.
please comment your opinions

GOOGLE - BULLISH SCENARIOAlphabet Inc is situated in the lower range of a robust and upward short-term trend, suggesting a potentially favorable buying opportunity. It is worth noting that if the lower trend floor at $117.50 is breached, it could indicate a slower pace of growth and potentially serve as an early warning for a shift in the trend. Based on the present short-term trend, the stock is projected to experience a 16.42% increase over the next three months. With a 90% probability, it is anticipated that the price will range between $136.79 and $157.66 at the conclusion of this three-month period.
Risk Disclosure: Trading Foreign Exchange (Forex) and Contracts of Difference (CFD's) carries a high level of risk. By registering and signing up, any client affirms their understanding of their own personal accountability for all transactions performed within their account and recognizes the risks associated with trading on such markets and on such sites. Furthermore, one understands that the company carries zero influence over transactions, markets, and trading signals, therefore, cannot be held liable nor guarantee any profits or losses.

Nasdaq - The Great Bear TrapIn recent analysis on the state of the markets, I note that the notion that we're "in a bull market" is actually really dangerous, and how, if you really want to see healthy markets into the future, you don't want to see a new all time high print yet, because we're just too far over the trend:
Nasdaq NQ - A Fundamental and Technical Warning Signal
Moreover, Q2 just finished strong, and with a new quarter, comes a new deployment of the algorithms. The infamous "JPM Collar" is something I discussed in a recent post:
SPX/ES - An Analysis Of The 'JPM Collar'
Namely that I believe it forecasts a serious correction in the markets. But at the same time, it has until September to even start, really.
And it's dangerous to be long right now because the VIX is so low and we've been in a bullish impulse inside of bearish market conditions for so long, which I note below
VIX - The 72-Handle Prelude
You can see the first manifestation of this principle has begun in both the VIX, and the UVIX 2x leveraged bull ETF:
You might look at that and think "lol it gave all its gains back" but this is actually what you want to see if it's going to run a bit.
I also have open calls for Tesla, which are short term, albeit significantly, bearish.
Tesla - What To Expect Until September?
And an open call on Netflix where I actually believe it will retrace to the $170s during the next major correction.
Netflix - I Hope You Like Catching Knives
So where we're at with Nasdaq futures is that it made lower highs while the SPX made higher highs:
The divergence is noise for the short term, but if you ask me, it means that in the long term, if we see a dump, and then a bounce, that Nasdaq will actually take out the high while SPX will be a laggard.
What Friday's price action showed is that both SPX and Nasdaq have begun to dump. If you ask me, this is because before we can go higher, we must go lower.
Sells have to be matched with buys and buys have to be matched with sells, after all.
And at this point, we haven't seen any downside in the markets since March. It's too extreme.
Two important areas of note is we have the daily pivot around 14,800 and the gap around 14,500.
Both of these are places that I expect to see attempts at bounces that will not come to fruition. Because you need to give people a chance to buy the dip and then for them to get stopped out.
I believe that the reason things will dump, and they may dump violently, and fast, is to crank the VIX and have all the permabears finally see their "opportunity" emerge to get short for "the crash."
Only for markets to bounce through the end of August while everyone with money is at the sea side and VIX dies a slow death back to a 9-handle while volatility gets sold off for free money again.
By then, nobody will want to be short anymore. Everyone will have capitulated. Then the fireworks can start, and early bears will miss the move, much to their consternation.
So, I believe that Nasdaq and tech stocks give the opportunity to short through the next few weeks.
On Wednesday, we have CPI, which has not mattered in months, but may matter a lot now while the markets pretend to care about whether the Fed hikes rates again.
Then we have FOMC on July 25 and a Nasdaq 100 "rebalance" on the 24th.
A recovery through the end of July and all the way through the end of August is a very likely scenario.
Until then, I believe we will see violent and significant downside, and it finally gives an opportunity trade puts and bear ETFs until you see really significant bullish movement in price at key levels, and then look for longs.
But the next time it's time to go long, it's only a scalp.
After Q3, the remainder of 2023 and the early part of 2024 is likely to be quite dangerous.
There are more important things in life than making money. Make sure you take good care of yourselves and your family and friends.
Make sure you make up for your regrets as soon as possible, lest you find yourself with no further chances to set right what was set wrong.

GOOGLE Approaching the bottom of the 6 month Channel Up.Google is under the 1day MA50 and is gradually turning into a buy opportunity.
The ideal level is as close to the bottom of the 6 month Channel Up as possible, with the RSI near the oversold 30.00 limit.
Buy after the MACD forms a Buy Cross, which was the confirmed signal in the previous two bottoms.
Target Resistance A at 129.50.
Follow us, like the idea and leave a comment below!!

$GOOG Short!Happy 4th to all you Americans! Hoping this short will work out, technicals are looking good. I have a NASDAQ:GOOG short coming in, here are the entries and exits for my positions followed by my rationale.
Entry: 128.61
TP1: 124
TP2: 120.05
TP3: 116.5
TP4: 113.37
Rationale:
1) Volume slowing: On the Weekly TF, the volume has significantly slowed down showing a lack of buyer conviction
2) Momentum is... good? Momentum for now is about 54 showing a sign for Buys yet, when cross compared to other indicators and liquidities, it paints a far different story.
3) Divergence: On D TF there is clear bearish divergence.
4) Wyckoff Distribution: Thus far, I am identifying the recent low as a ST MSOW, major show of weakness. A strong lack of conviction to move into higher regions. I expect a small bounce as last point of resistance but a short in inevitable.
Strong feeling about this call! Technicals look right to me, lets print boys.

Trading should be made simple. #GOOGLYou don't need a super complicated trading strategy to make money. You need a sound risk/money management, realistic expectations and abuncance of patience.
When price is below 20/50/200, you just simply stay in cash. When price is above 20/50/200.. wait until it has form a base and/or made a decent pullback. Wait.

GOOGLE: Hit the 1D MA50 after 3.5 months! Rebound ahead?Google hit two days ago the 1D MA50 for the first time since March 15th and is already rebounding. The 1D technicals are neutral (RSI = 49.273, MACD = 1.050, ADX = 30.515) indicating that the first buy in some time can be justified on the current level buy attention is required as the downside has technical extension potential.
We are taking this opportunity to place our first buy and target the R1 (TP = 130.00) but if 1D closes the candle under the MA50, we will realize the loss, sell with TP = 108.00 and then reverse to buying again (TP = 130.00) assuming the 1D MA200 holds as the long term Support.
The 1D RSI touched its HL trendline, which empowers buying on the current level.
## If you like our free content follow our profile to get more daily ideas. ##
## Comments and likes are greatly appreciated. ##

Google -> Pumping With The AI HypeHello Traders,
welcome to this free and educational multi-timeframe technical analysis .
On the weekly timeframe you can see that Google stock just retested and with a weekly bearish candle perfectly started to reject major previous structure at the $130 level.
You can also see that weekly market structure is still quite bullish, Alphabet is now retesting the 50% fibonacci retracement level and also previous weekly resistance which is now turned support at the $120 level so I simply do expect more continuation towards the upside from here.
On the daily timeframe you can see that Google stock just created and confirmed a daily head and shoulders reversal pattern so I am now just waiting for a break back above the neckline - then we would also have bullish market structure again - and then I simply do expect also a daily rally to retest the next resistance at the $130 level.
Thank you for watching and I will see you tomorrow!
You can also check out my previous analysis of this asset:

Peeking into Super SevensIn our previous paper , we outlined how investors can use CME's Micro S&P 500 Futures to hedge beta exposure and extract pure alpha.
The paper referenced that the Super Sevens stocks (Amazon, Apple, Google, Meta, Microsoft, Nvidia, and Tesla) will continue to outperform the broader S&P 500 index. Not only do these stocks benefit from passive investing and ESG investing, these firms also have solid fundamentals to back up their gargantuan valuations.
Each of the firms in the Super Sevens offer unique value drivers. Each firm is a market leader in its space and has demonstrated resilient earnings capacity and solid growth potential. Still, each also has its own set of risks. Notably, with the Super Sevens the value drivers outweigh the potential risks.
AMAZON
VALUE DRIVERS
• Blistering profits from AWS offering with dominant market share of 33%.
• Market dominance in e-commerce and solid supply chain network.
• Successful new categories: Kindle (publishing), Alexa (voice assistant), and Prime (video streaming).
POTENTIAL RISKS
• Heavy reliance on AWS for profits. Slowing growth in AWS due to slowdown in corporate IT spending.
• Low profit margins in e-commerce business. Slowing growth due to lower consumer spending.
• Rising competition in cloud services and e-commerce.
ANALYST PRICE TARGETS
• Across 54 analysts providing a 12-month price target, 42 (77%) having a strong buy rating, 7 (13%) of them have a buy rating, 4 (7%) suggest a hold, while just 1 (2%) has a strong sell rating.
• Average 12-month price target stands at 137, with a maximum of 220 and a minimum of 85.
TECHNICAL SIGNALS
• Technical signals point to momentum deeply in favour of Amazon shares. Oscillators point to buy and Moving averages point to a strong buy.
• In aggregate, technical signals point to a buy.
APPLE
VALUE DRIVERS
• Product category definers. Dominant and still growing iPhone demand.
• Solid eco-system which is extremely hard to displace.
• Control over both software and hardware enables specialized tailored improvements.
• Sticky services such as App store, Apple Pay, and potentially Apple BNPL.
POTENTIAL RISKS
• Apple is heavily reliant on external fabricators exposing it to supply-chain bottlenecks.
• Heavily dependent on iPhone sales.
• Rising dependence on future growth in unexplored new categories.
ANALYST PRICE TARGETS
• Across 42 analysts providing a 12-month price target, 22 (52%) having a strong buy rating, 6 (14%) of them have a buy rating, 13 (31%) suggest a hold, while just 1 (2%) has a strong sell rating.
• Average 12-month price target stands at 187, with a maximum of 220 and a minimum of 140.
TECHNICAL SIGNALS
• Technical signals point to solid momentum favouring long position in Apple shares. Oscillators point to buy and Moving averages point to a strong buy.
• In aggregate, technical signals point to a strong buy despite Apple trading at near its all-time-high.
GOOGLE
VALUE DRIVERS
• Google is the dominant search engine (86% market share).
• Phenomenally successful and effective ad-targeting capabilities.
• Heavy investments in future innovation enabling leapfrog into new verticals such as Android, Waymo (FSD & Maps).
• Successful early acquisitions such as YouTube, Android, Applied Semantics & DoubleClick (AdSense), Nest (Home Automation).
POTENTIAL RISKS
• Massive reliance on ad revenues via search for profits. Slowing ad spend as firms cut back on spending.
• Non-trivial dependence on cloud revenue for growth exposes them. Slowing cloud revenue growth due to lower corporate IT spending.
• Failure to expand into new domains such as social media, wearable tech, and gaming.
ANALYST PRICE TARGETS
• Across 52 analysts providing a 12-month price target, 40 (77%) having a strong buy rating, 7 (13%) of them have a buy rating, while 5 (10%) suggest a hold. None of the analysts have a sell rating.
• Average 12-month price target stands at 131, with a maximum of 190 and a minimum of 100.
TECHNICAL SIGNALS
• Technical signals point to decent momentum favouring Google shares but prices are at tiny risk of oscillating downwards. Oscillators point to neutral while Moving averages point to a strong buy.
• In aggregate, technical signals point to a buy.
META
VALUE DRIVERS
• Market monopoly on social media with high penetration across global markets on multiple platforms.
• Flagship Facebook platform continues to see growth with 2.9 billion monthly active users (MAU).
• Successful acquisitions have provided them with a wide suite of social media platforms – WhatsApp (2 billion MAU) and Instagram (2 billion MAU).
• Successful developer tools (Graph, Hydra, React) have allowed them to build useful SDK (Software Development Kit). Potential sources of enterprise revenue from these.
POTENTIAL RISKS
• Increasing competition from TikTok.
• Privacy concerns have a direct revenue impact e.g., Apple’s new privacy policies.
• Falling market share for flagship Facebook in advanced economies.
• High reliance on ad-sales. Slowing ad sales as firms cut back on spending.
• Shaky bet on the Metaverse which is starting to fade.
ANALYST PRICE TARGETS
• Across 60 analysts providing a 12-month price target, 39 (65%) having a strong buy rating, 7 (12%) of them have a buy rating, 10 (17%) suggest a hold, 1 (2%) sell rating, and 3 (5%) has a strong sell rating.
• Average 12-month price target stands at 281, with a maximum of 350 and a minimum of 100.
TECHNICAL SIGNALS
• Technical signals point to decent momentum favouring Meta shares. Oscillators signal neutral indicating a tiny risk of shares shedding gains while Moving averages point to a strong buy.
• In aggregate, technical signals point to a buy.
MICROSOFT
VALUE DRIVERS
• Sheer dominance of Windows (74% market share) & MS Office.
• Deep roots in MS Office enables the firm to straddle across consumers & enterprise.
• Diversified software offerings - cloud (Azure), gaming (Xbox), enterprise (Windows Server and SQL), search (Bing), productivity (Office), collaboration (Teams), and AI (through Open AI's ChatGPT).
• Active M&A activity to acquire assets - LinkedIn, OpenAI, GitHub, Skype, Mojang, Nokia, Activision-Blizzard (Pending).
• Besides Windows, Microsoft controls dev frameworks such as .Net further strengthening their grasp on SW dev.
POTENTIAL RISKS
• Limited success in hardware offerings unlike Apple.
• Multiple major acquisitions have fizzled – Skype and Nokia.
• Limited adoption in enterprise software.
ANALYST PRICE TARGETS
• Across 51 analysts providing a 12-month price target, 37 (73%) having a strong buy rating, 6 (12%) of them have a buy rating, 7 (14%) suggest a hold, while just 1 (2%) has a strong sell rating.
• Average 12-month price target stands at 345, with a maximum of 450 and a minimum of 232.
TECHNICAL SIGNALS
• Technical signals point to decent momentum favouring Microsoft shares. Oscillators are at neutral while Moving averages signal a strong buy.
• In aggregate, technical signals point to a strong buy.
NVIDIA
VALUE DRIVERS
• Market dominance in discrete GPU’s (80%).
• Early mover in AI hardware which gives them a lead over the competition.
• Raytracing, DLSS, Neural Network cores.
• Nvidia’s CUDA is the primary choice for training ML models.
• Market dominance in high-growth data centre graphics hardware (95%) and super-computing hardware.
• Successful enterprise partnerships – car manufacturers using Nvidia software.
• Emerging tech such as AI and VR require more graphics intensive processing driving demand for Nvidia’s products.
POTENTIAL RISKS
• Hardware-focused business model exposes it to supply-chain risks and bottlenecks.
• Extremely high P/E of 225 dependent upon expectations of future growth in AI.
• Losing market share in discrete GPUs and enterprise GPUs to AMD and Intel.
ANALYST PRICE TARGETS
• Across 50 analysts providing a 12-month price target, 36 (72%) having a strong buy rating, 6 (12%) of them have a buy rating, 7 (14%) suggest a hold, while just 1 (2%) has a sell rating.
• Average 12-month price target stands at 444, with a maximum of 600 and a minimum of 175.
TECHNICAL SIGNALS
• Technical signals point to solid momentum favouring long position Nvidia shares. Oscillators point to buy and Moving averages point to a strong buy.
• In aggregate, technical signals point to a strong buy despite Nvidia relentless and unrivalled price ascent.
TESLA
VALUE DRIVERS
• Early mover in EV’s with dominant market share in US (62%).
• Dedicated and loyal customer base.
• Vertical integration of EV value chain allows it to reduce reliance on external suppliers.
• Early investment in large factories that will allow them to scale output more efficiently.
• Huge and monetizable supercharger network by opening it up to other EV makers.
• Subscription model for software enables revenue generation after product sale.
• Long term vision has allowed Tesla to create entirely new products such as supercharger network, battery banks, home power backup and solar roofs.
• Tesla’s planned Robotaxi and entry into car insurance can be hugely disruptive.
POTENTIAL RISKS
• Increasing competition from automobile majors as well as Chinese EV firms.
• Tesla’s brand is deeply entangled with Musk’s reputation.
• Dependence on government incentives to make Tesla affordable.
• Continued access to battery metal minerals.
• Ongoing and unresolved production scaling challenges.
ANALYST PRICE TARGETS
• Across 46 analysts providing a 12-month price target, 18 (39%) having a strong buy rating, 5 (11%) of them have a buy rating, 17 (37%) suggest a hold, 1 (2%) has a sell rating, and a 5 (11%) hold a strong sell rating.
• Average 12-month price target stands at 201, with a maximum of 335 and a minimum of 71.
TECHNICAL SIGNALS
• Technical signals point to solid momentum favouring Tesla. Oscillators point to buy and Moving averages point to a strong buy.
• In aggregate, technical signals point to a strong buy.
SUMMARY
The Super Sevens are well positioned to continue outperforming the wider market. As mentioned in our previous paper , investors can use a beta hedge to nullify the effects of the broader market (S&P 500) and extract pure alpha from the growth of the Super Sevens.
MARKET DATA
CME Real-time Market Data helps identify trading set-ups and express market views better. If you have futures in your trading portfolio, you can check out on CME Group data plans available that suit your trading needs www.tradingview.com
DISCLAIMER
This case study is for educational purposes only and does not constitute investment recommendations or advice. Nor are they used to promote any specific products, or services.
Trading or investment ideas cited here are for illustration only, as an integral part of a case study to demonstrate the fundamental concepts in risk management or trading under the market scenarios being discussed. Please read the FULL DISCLAIMER the link to which is provided in our profile description.

Harvesting Alpha with Beta HedgingImagine this. Dark skies, earth tremors and thunder roars. Shelter is top priority. Size matters in a crisis. When the tsunami strikes and lightning splits the sky, investors shudder in fear; But the super seven stand tall, shielding investors from the fury.
Dramatic metaphors aside, we truly live in unprecedented times. Risk lurks everywhere.
List is endless. Unstable geopolitics. Sticky inflation. Recession expectations. Unprecedented deepening of yield curve inversion. Unfinished regional banking crisis. Weak manufacturing. Tightening financial conditions. Extremely divisive global politics, to just name a few.
Despite severe headwinds, US equity markets are roaring. YTD, S&P is up +15% and Nasdaq is up +32%.
At the start of 2023, the consensus was for US equities to be in doldrums dragged down by recession. Halfway through the year, markets are at the cusp of one of the best first half for US equity markets in twenty years.
This is among the narrowest and top-heavy rally ever. Only a sliver of stocks - precisely seven of them - defines this optimism. This paper will refer to these as the Super Sevens.
These are the biggest members of the S&P 500 index. Super Sevens are Amazon, Apple, Google, Meta, Microsoft, Nvidia, and Tesla.
This paper argues that the Super Sevens will deliver above market returns in the short term as investors seek safe haven from a vast array of macro risks.
The paper articulates a case study to demonstrate the use of beta hedging to extract alpha from holding long positions in Super Sevens and hedging them against sharp reversals using CME Micro E-Mini S&P 500 index futures ("CME Micro S&P 500 Futures").
THE RISE AND RISE OF SUPER SEVENS
Super Sevens have an outsized impact as S&P 500 is a market weighted index.
Merely five of these seven form 25% of the S&P 500 market capitalisation. At $2.9 trillion in market capitalisation, Apple is greater than all of UK’s top 100 listed companies put together.
If that were not enough, Apple's market capitalisation alone is greater than the aggregate market capitalisation of all the firms in the Russell 2000 index.
Nvidia has been soaring on hopes of AI driven productivity gains. On blow out revenue guidance, it has rallied $640 billion in market cap YTD. That increment alone is larger than the combined market cap of JP Morgan & Bank of America the two largest banks in the US.
The heatmap summarises analyst targets & technical signals on pathway for prices ahead:
In part 2 of this paper, Mint will cover the detailed analyst price forecasts, technical signals and summary narratives covering value drives and intrinsic risk factors.
WHAT DRIVES INVESTOR CONCENTRATION INTO THE SUPER SEVENS?
As reported in the Financial Times last week, two broad market trends appear to have fed into this investor concentration.
First, Passive investing. When funds merely deliver the performance of an index by replicating its composition, the higher the index weights, the more these passive funds buy into these names.
Second, ESG investing. Rising push towards ESG has forced investment into tech and away from carbon-heavy sectors such as energy.
Collectively, this has resulted in all types of investors – active, passive, momentum, ESG- all going after the same names.
Question is, what happens now? Will the broader market catch up with the Super Sevens? Or will the Super Sevens suffer a sharp pullback?
That depends on the broader US economy. Will it have a hard landing, soft landing, or no landing at all?
Given market expectations of (a) resilient earnings capacity, and (b) solid growth potential among Super Sevens, we expect that in the near to mid-term the Super Sevens will continue to outperform the broader market.
In ordinary times, investors could have simply established long positions in Super Sevens and wait to reap their harvests. However, we live in unprecedented times.
WE LIVE IN TRULY UNPRECEDENTED TIMES
Risks abound but no signs of it in equity markets. Historically, geopolitical instability, tightening financial conditions, and a deeply inverted curve could have led to crushing returns in the US equity markets. Not this time though.
Peak concentration
As mentioned earlier, bullishness in equity markets can be vastly attributed to just the Super Sevens. These seven have delivered crushing returns rising between 40% and 192% YTD. The S&P 500 index is market cap weighted. Super Sevens represent the largest companies in the index by market cap and their stellar performance has an outsized impact on the index.
Is this a bull run or a bear market clouded by over optimism among Super Sevens?
Deeply inverted yield curve
In simple words, it costs far more to borrow for the near term (2 year) relative to the borrowing for long term (10-year). The US Treasury yield curves have been inverted for more than a year now. The difference between the 2-Year and 10-Year treasuries is at its widest level since the early 1980s.
Inversion in yield curve has historically been a credible signal of recession ahead. When bonds with near term duration yield higher rates than those with longer-dated expiries, this precedes trouble in the economy.
Recession. What recession?
This period might go into the record books for the most long-awaited recession that is yet to come. For the last 12 months, experts have been calling for recession to show up in 3 months.
While manufacturing sector seems feeble, labour market remains solid. Corporate balance sheets are robust. Consumer finances and consumer confidence are in good health.
The VIX remains sanguine while the only fear indicator that appears unsettled is the MOVE index which indicates volatility in the bond markets. After having spiked earlier in the year, the MOVE is starting to soften as well.
BETA HEDGING FOR PURE ALPHA
In times of turbulence, risk management is not an afterthought but a necessity.
Hedge delivers the edge. When there are ample arguments to be made for bullish and bearish markets, taking a directional position can be precarious.
This paper posits Super Sevens holdings be hedged with CME Micro S&P 500 Futures. Hedging single stocks is nuanced. The stocks and the index do not always move in tandem. A given stock may be more volatile or less volatile relative to the benchmark. Beta is the sensitivity of the stock price relative to a benchmark.
Beta is computed from daily returns over a defined historical period. Stocks with high Beta move a lot more than the underlying index. Stocks that move narrowly relative to its underlying benchmark exhibits low Beta.
Beta hedging involves adjusting the notional value of a stock price based on its beta. Using beta-adjusted notional, hedging then involves taking an offsetting position in an index derivative contract to match the notional value.
TradingView publishes beta values computed based on daily returns over the last 12 months. The following table illustrates the beta-adjusted notional for the Super Sevens based on the last traded prices as of close of market on June 16th.
Beta hedging using CME Micro S&P 500 Futures enables investors to precisely scale their portfolio exposures to the index. A small contract size enables investors to manage risks with finer granularity.
CME allows conversion of micro futures into a classic E-mini futures position, and vice versa. Round the clock liquidity combined with tight spreads and sizeable open interest across the two front contract months, investors can enter and exit the market at ease.
BETA-HEDGED TRADE SET UP
In unprecedented times like today, markets may continue to rally or come crashing. To harness pure alpha, this paper posits a spread with long positions in Super Sevens hedged by a short position in CME Micro S&P 500 Futures expiring in September 2023.
This trade set-up gains when (a) Super Sevens rise faster than the S&P 500, or (b) Super Sevens suffers drop in value but falls lesser relative to S&P 500, or (c) Super Sevens gain while S&P 500 falls.
This trade setup loses when (a) Super Seven falls faster than S&P 500, or (b) S&P 500 rises faster than Super Seven, or (c) S&P 500 rises while Super Sevens pullback
Each CME Micro S&P 500 Futures has a multiplier of USD 5. The September contract settled on June 16th at 4453.75 implying a notional value of USD 22,269 (4453.75 * USD 5).
Effective beta hedge requires that notional of the hedging trade is equivalent to the beta-adjusted notional value of single stock. Given the beta-adjusted notional value of USD 2,561 for single shares in Super Sevens and the notional value for each lot of CME Micro S&P 500 Futures at USD 22,269, the spread trade requires:
a. A long position in 26 shares each across all the Super Sevens translating to a beta-adjusted notional of USD 66,576.
b. Hedged by a short position with 3 lots of CME Micro S&P 500 Futures which provides a notional exposure of USD 66,807.
The following table illustrates the hypothetical P&L of this spread trade under various scenarios:
MARKET DATA
CME Real-time Market Data helps identify trading set-ups and express market views better. If you have futures in your trading portfolio, you can check out on CME Group data plans available that suit your trading needs www.tradingview.com
DISCLAIMER
This case study is for educational purposes only and does not constitute investment recommendations or advice. Nor are they used to promote any specific products, or services.
Trading or investment ideas cited here are for illustration only, as an integral part of a case study to demonstrate the fundamental concepts in risk management or trading under the market scenarios being discussed. Please read the FULL DISCLAIMER the link to which is provided in our profile description.

Key Level Chart for $GOOGL | Fibonacci and Pivot PointsThese charts are good for swing traders, position traders and long term investors.

GOOG WEEKLY ANALYSIS after rejection of the price at the level of a resistance and the filling of an FVG '' Fare Value Gap'' at the level of this zone we will see a reversal of the price to fill this FVG for the continuation towards suppLy zone

Harnessing the AI Revolution: A Powerful Surge with NVIDIA, GoogThe future is now, and it's coded in the language of Artificial Intelligence. As investors, we have a unique opportunity to be part of this game-changing journey. My personal story began with NVIDIA, an industry leader in AI and graphics processing. Acquiring NVIDIA shares two months ago was akin to boarding a spacecraft destined for new frontiers. The ride has been exceptional, with returns exceeding my expectations.
But, the vast landscape of AI is not limited to one planet. There's a whole universe to explore, and I decided to broaden my horizons. Hence, I ventured further, incorporating three other stellar entities into my portfolio - Google, Microsoft, and IBM. These industry titans are carving their paths, harnessing AI to innovate, and influencing global trends.
My portfolio is not just an investment; it's a belief in a future shaped by AI, a testament to a revolution unfolding right before our eyes. Join me in this journey, as I share my insights, strategies, and perspectives on navigating these high-tech tides. Together, we can capitalize on the industry that is relentlessly and rapidly shaping our tomorrow. Remember, the revolution might be digitized, but the rewards are very real.

Google vs BingIf you haven`t sold GOOGL here:
Or bought it here:
Then you should know that the investment by Microsoft in OpenAI signifies a significant boost to their artificial intelligence capabilities. OpenAI's advanced technologies and expertise in AI research and development could potentially enhance the capabilities of Microsoft's Bing search engine. With access to powerful AI algorithms and resources, Bing may be able to offer more personalized and accurate search results, thereby attracting users who seek a more refined search experience.
Furthermore, Microsoft has been making strategic moves to expand its presence in various sectors, including cloud computing and enterprise services. By integrating Bing into its ecosystem of products and services, Microsoft can leverage its existing user base and partnerships to promote Bing as a viable alternative to Google.
In recent years, Google has faced scrutiny over data privacy concerns and antitrust issues, which could create an opportunity for Bing to gain traction among users seeking more privacy-focused alternatives. Additionally, Microsoft has been actively investing in marketing and advertising efforts to raise awareness about Bing and improve its market positioning.
While Google currently holds a dominant position in the search engine market, the landscape is dynamic and subject to change. If Microsoft successfully leverages its partnership with OpenAI to enhance Bing's capabilities, coupled with strategic marketing initiatives, it could potentially chip away at Google's market share over time.
If I had to buy some options, that would be the following puts:
2024-1-19 expiration date
$105 strike price
$3.25 premium
Looking forward to read your opinion about it!

TSLA NVDA AAPL AMZN GOOGL MSFT|Sp500 QQQ Price Level Trend Guide- CPI Data 830am EST tomorrow
- FOMC & PPI Wednesday
- TSLA side ways tightening range will break tomorrow, 4h 12 EMA full bull control guide
- NVDA bull break from falling wedge
- AAPL likely testing all time high again soon
- AMZN retracing almost all of its drop likely testing its recent high
- GOOGL weakest of the big tech still potential forming a daily downtrend
- MSFT in the middle still has potential to form that daily downtrend but QQQ needs to start its weekly consolidation
- SPY testing 0.65 golden pocket resistance
- QQQ gap filled looking for weekly consolidation soon


TSLA NVDA AAPL MSFT GOOGL AMZN Detail Trading Guide with Levels- most of all these big tech stocks and market itself are due for weekly consolidation so the most likely scenario for me in the next coming weeks is more so a sideways or slight dip action.
- the size of this consolidation pull back will determine our next move
- Tesla about to form its first monthly uptrend since ATH
- Nvidia potential 4h head and shoulders pattern
- AAPL & MSFT potentially testing ATH

New Google Pivot New long pivot on NASDAQ:GOOG forming around $127. Watch todays price action for confirmation.
Previous move through the pivot saw Google advance from $110 to $127.
NVDA TSLA MSFT GOOGL AAPL AMZN | Support & Resistance Guide- Support & Resistance guide for all 6 big tech stocks NVDA TSLA MSFT GOOGL AAPL AMZN
- psychological 1 trillion dollar level for NVDA 405
- TSLA wedge pattern still in play
- zero red flags on the chart for MSFT and AMZN need hourly downtrends to confirm for any signs of bears

Massive Breakout with Google - Arrival of the Golden CrossA great opportunity to buy Google a free cash flow surplus company that is undervalued. The stock is now ready for a massive breakout with the arrival of the golden cross.

Google - nice short setup is cookingI count GOOGL as start of wave circle C of iv where wave (1) is done and a pb in wave (2) is in action. Wave (2) is shortable from the 100 zone. A=C rule gives us a target of 60 for the whole wave iv correction. Would be a great long opportunity sometime in 2024-25. Longer-term count will be posted separately.

AI strategy drives NVDA MSFT GOOG METAAs we navigate through the ever-evolving world of technology, it is becoming increasingly evident that artificial intelligence (AI) is the driving force behind some of the biggest players in the market. Companies such as NVIDIA (NVDA), Microsoft (MSFT), Google (GOOG), and Meta Platforms (META) have all implemented AI strategies that have propelled them to the forefront of their respective industries. In this email, we will explore how these companies are utilizing AI to gain a competitive edge and what it means for their future growth potential. So, buckle up and let's dive into the world of AI and its impact on the stock market.
Additionally, it's crucial to have a long-term investment strategy and to not make emotional decisions based on short-term market fluctuations. It's also wise to diversify your portfolio across different industries and sectors to minimize risk. Seeking the advice of a financial advisor can also be helpful in making informed investment decisions.
Additionally, it's important to have a long-term investment strategy and not make emotional decisions based on short-term market fluctuations. It's also wise to consider factors such as the company's financial health, industry trends, and management team before investing in individual stocks. Diversification is key to managing risk, so it's advisable to have a mix of individual stocks and diversified portfolios in your investment portfolio. Finally, seeking the advice of a financial advisor can help you make informed investment decisions and manage your risk effectively.
