
Google trending higher Google in on a strong up tend over the last 4 months from $85 low and now at $117 and looking to break the $120 range

QQQ & Nvidia Stock Rising Wedge Resistance | CPI | GOOGL Event - NASDAQ:QQQ rising wedge pattern hitting resistance top this morning,
- NASDAQ:GOOGL 's AI event helped market bounced off todays intra-day low
- GOOGL talked about NVDA a little in its event making NVDA pop a little bit
- NASDAQ:NVDA also close to its top of the rising wedge
- CPI came in 4.9% estimate was 5% so came in slightly cooler
- PPI and jobs data tomorrow 8:30am EST

Google-> BreakoutHello Traders,
welcome to this free and educational multi-timeframe technical analysis .
On the weekly timeframe you can see that Google stock is finally breaking above a major previous weekly support/resistance level exactly at the $105 area.
You can also see that weekly market structure and moving averages are bullish, the next major resistance is sitting at the $120 level and it overall seems like the bottom is in for Google so I just do expect more continuation towards the upside.
On the daily timeframe you can see that with today's candle Google stock is up almost 5%, creating a massively bullish breakout and breaking all resistance towards the upside so I am now just waiting for a retest of the $105 level and then I do expect more continuation towards the upside.
Thank you for watching and I will see you tomorrow!
You can also check out my previous analysis of this asset:

GOOGLE : Long on breakout
As shown in the graph, I have summarized the various reasons why a Long trade could be opened on Google.
With the use of my indicators (LuBot , Predictum , LuExcess , LuTrender) and through graphical analysis, I identify a good entry pattern for a short-term trade.
The conditions for a Long entry are already valid, but one could enter at the actual break of the trendline for further confirmation.
The profit exit could be placed on the next resistance level that we find in the 117.50 area and the loss exit below the last lows to avoid holding a losing trade for too long.
The conditions for a Long are all there, but as we know, nothing is certain in trading. The important thing is that what we do always has a sense and a motivation and that the conditions are favourable. If the trade goes into loss patience, there will be other opportunities.
The market doesn't run away and the most important thing is always to keep calm and patience.

Apple AAPL - Brace Yourselves for $200. Seriously.Apple is something of a reverse canary in the coalmine when it comes to the Nasdaq, specifically because it's its highest weighted company at almost 14%. All these weeks everyone has been bearish, but yet, Apple is not in anything resembling a bear market.
Instead, everything about Apple from the monthly chart to the daily chart indicates that the January all time high of $182.93 is not very likely at all to be the all time high.
And this is under the circumstance wherein Apple extensively relies on what is effectively slave labor supplied by the notorious Chinese Communist Party, a problem really exacerbated by the regime employing that Zero-COVID stuff.
This is important because the situation with Apple's Foxconn factories and other Chinese factories and the new restrictions on chip makers means there is fundamental problems with this company going forward.
There's fundamental problems and yet it's set up to rally to a new all time high. Apple is more or less in "The Big Short."
Look up "China Quarantine Camps" or "COVID QR Code" on social media. The Chinese are literally being placed by the millions into huge concentration camps and every aspect of their daily life, from their ability to use public transit, their ability to go to work, their ability to purchase goods, their ability to use money, is entirely under the CCP's social credit system, lynch pinned around the colour of their QR code health pass.
And to think this is a system that the Western globalist establishment would like to install for all of us all over the world via central bank digital currencies... all I can say to readers is I hope you are intelligent enough to reject the Communist Party's things and its Marxist-Leninist "Theory of Evolution" and atheism stuff. If you want those things, you'll have to go with those things and experience what those things truly entail.
Personally, I'm calling a bear market rally, with Nasdaq going to 14,000. I suppose it'll be rather humiliating for me if this turns out to be incorrect and we keep dumping. However, fortune favours the bold, and at the same time, this is how bear markets work and there's a logic to the way they operate.
Nasdaq NQ - Unpopular Opinion #2,118: 14,000 is Coming
I also believe that stocks like Amazon and Meta are due for a fat rally
AMZN Amazon - Realistic Expectations In Both Doom and Gloom
Facebook/Meta - Too Much Bear, Not Enough Bull
Before you discount my supposition as hogwash, consider that McDonald's and Lockheed Martin just made all time highs just last month. And this is supposed to be a bear market where everything is going down.
So what's the rationale for saying Apple is going to set a new all time high?
Let's examine the monthly:
1. Apple set the low of the year in June, like everything else, but when it came time for September and October's scary index dumps, Apple remained very strong. October was actually a winning month overall.
2. Although this appears to have sharply reversed in November, it's worth noting we're a total of 4 trading days into the month. The November high as printed is not likely to remain the high.
3. In terms of range equilibrium for this market cycle, which I measure from anything's Coronavirus Disease 2019 pseudo-pandemic hysteria low to its all time high, Apple has not wanted to trade back to equilibrium. This all on its own tells me that the MMs are still heavy on the sell.
Looking at a weekly chart:
Inside the 2022 trading range we can see that Apple is currently trading at a deep discount. The magnification of the fractal shows us that not only is the prior statement true, but that the area below the October of 2021 pivot that led to the ATH has been worked extensively for the last several months.
On the daily, we can see with more clarity that the post-earnings pump was actually a major trade away from this genuine demand zone and back towards range equilibrium. It has since retraced, which is bullish.
If you understand how sell models work, you'll understand why this is "bullish" and not "bearish," and you'll understand why Apple continues to trade like it does and why it doesn't want to make a new low despite how excited everyone always is about the prospect of it crashing so they can buy cheap.
(Hint: When Apple is under $115, don't touch it. It's going to wind up like Facebook.)
But if you understand how sell models work, you'll also know why a new all time high on Apple is bearish, and not bullish.
What I would like to say to everyone is that bear markets rally and rally hard. They do this for a reason and the fundamental reason is that they're not bullish.
It sounds contradictory, right? "Why would something rally so hard if it's not bullish? How can that be?"
You are confused because when you see price go up, you think buying and when you see price go down, you think selling. Yet, if the banks and the funds traded like that, they would blow their account like you do and we would have ourselves a Lehman Brothers moment every 3 to 6 months and society would collapse.
When you see huge rallies like what's ahead you need to govern yourself strictly, and this means:
1. Don't get delusional and think you're in a new paradigm of everything going uppy. No, SPX is not going to 6,000 before Jan. 1 like David J. Hunter has been calling.
2. Check your greed before your greed checks your hide
3. Don't short or buy puts too early. Instead, buy them too late. A bullish Apple is as scary as a bullish Bitcoin.
4. The more complaining you see on social media and your signal groups about the Federal Reserve and "this ponzi," the higher things are going to go. The top is in when the charlatans and grifters start talking about getting long.
5. Buy the dip, but keep your risk low.
6. Make sure you take profits because this is no time to buy and hold.
Because what lies ahead after you see this go on for a bit and VIX hit numbers like 17 and 18, is this, which I called in August,
VIX - 9x8 = 72
The limit down that lies ahead is going to be vicious. Afterwards, North Americans will finally know what a real bear market feels like. It's not fun.

APPL - Daily chartWhen it reaches 166, there will be a
MACD cross over, which can be used for confirmation.
Note: This is for educational purpose.

NDQ - Double BottomNDQ has formed double bottom at 13,000 range, tGT 1 is 13150
With Central bank being neutral, NDQ will break the supply zone and will fly soon.

GOOG Cup and Handle FormationGOOG price is after a consolidation in price which lasted since beginning of November 2022 starting to look bullish. It is currently testing it's 200 moving average which is sitting at $103 per share price range. If the pattern is formed properly and bulls take over, we could see a potential rise in price to the $125-130 level.
Things to watch and consider:
1. My personal buy point for the GOOG stock would be retest of the 200MA, price levels between $102.5-$104. This buy will be 30% of the planned acquiring of the GOOG stock.
2. Second buy point would be above last known resistance sitting at $108.4 - $108.8 price range, which is also considered as top of the Cup and Handle Formation.
3. If this scenario is set to be false, my stop loss for this position will be just under the 200MA, sitting at price range between $102.5 and $100 per share.
4. If the scenario according to technical analysis seems to be working, my profit target would be in range of $125 to $127 per share, with possibility of moving my take profit level even higher if price is starting to move higher.
Just for everyone's thoughts, this is not financial advice and I am not a financial advisor, please do your Due Diligence before investing your hard earned cash.

Alphabet (Google) Ready to break up above the brim to $124.00Cup and Handle formed on Alphabet Inc.
The price action before that played to the Letter (no pun intended).
And now we are seeing a gradual increase in demand (buying) with the price ready to break above the brim level.
7=21
Price>200 - bullish
Target $124.00
SMC:
Sell Side Liquidity Order block has formed below the handle of the Cup, showing Smart Money coming in sweeping the selling side and buying into it, hence the upside over the last few days.
ABOUT
Alphabet Inc. is an American multinational conglomerate that was created in 2015 as a holding company for Google and several other subsidiaries.
The company's primary subsidiary is Google, the world's most popular search engine.
Alphabet is headquartered in Mountain View, California, USA.
The company's founders are Larry Page and Sergey Brin, who are also the co-founders of Google.
Alphabet has a market capitalization of over $1.5 trillion (as of April 2023).
Google is responsible for developing some of the most widely-used software products in the world, including the Android operating system, Google Maps, and Google Drive.
The company generates most of its revenue through advertising, with over 80% of its revenue coming from Google ads.
Alphabet has over 200,000 employees worldwide and is known for its unique company culture, which emphasizes innovation and collaboration.
The company is committed to sustainability and has set several ambitious goals, including a goal to operate on 100% renewable energy by 2030.
Alphabet is one of the largest technology companies in the world and is a member of the prestigious FAANG group of companies (Facebook, Amazon, Apple, Netflix, and Google).
The company is also a major player in the cloud computing industry, with Google Cloud Platform being one of the leading cloud computing services in the market.
Alphabet is known for its extensive research and development activities, with the company investing heavily in areas such as artificial intelligence, machine learning, and quantum computing.
The company is also active in the self-driving car industry through its subsidiary Waymo.

GOOGL Alphabet Options Ahead of EarningsI you haven`t sold GOOGL here, to buy it cheaper later:
Then analyzing the options chain of GOOGL Alphabet prior to the earnings report this week,
I would consider purchasing the $106.5usd strike price Calls with
an expiration date of 2023-6-16
for a premium of approximately $2.17.
If these options prove to be profitable prior to the earnings release, I would sell at least half of them.
I am interested to hear your thoughts on this strategy.

GOOGLE Ahead of a 1D Golden CrossAlphabet Inc (GOOGL) is about to form a Golden Cross on the 1D time-frame, which is when the 1D MA50 (blue trend-line) crosses above the 1D MA200 (orange trend-line). This is a very bullish pattern, that can be enough to break above the Channel up pattern that the stock has been trading in since the November 03 2022 market bottom. In that case we will target Resistance 1 at 122.50.
If however we get a candle close below the 1D MA200, we will sell towards the bottom of the Channel Up and then buy for a 115.00 Higher High target.
-------------------------------------------------------------------------------
** Please LIKE 👍, FOLLOW ✅, SHARE 🙌 and COMMENT ✍ if you enjoy this idea! Also share your ideas and charts in the comments section below! **
-------------------------------------------------------------------------------
💸💸💸💸💸💸
👇 👇 👇 👇 👇 👇

NASDAQ - Expecting a deeper pullbackHi there, traders!
After yesterday’s drop, the U.S. stock market got a breather on Tuesday evening as Big Tech earnings began to roll out, led by better than expected reports for Google and Microsoft.
Looking at things from a technical perspective, we do anticipate the price to continue dropping today due to some key trends on the Daily and 4H timeframes. If we see a consolidation underneath the 4H trendline, it’s likely that the price will continue to drop.
Remember, today is an important day for earnings reports, with Boeing reporting before the opening bell, and Meta and eBay set to report after the market closes. These reports have the potential to move the market, so keep an eye out!
We’ll be keeping a close watch on everything and will update you in the section below if anything changes. And as always, trade with care and let us know if you have any questions or concerns!

$SPY pre-market Resistance Rejection | $QQQ megaphone | $META ER- AMEX:SPY rejected from its pre-market highs and couldn't get over it then bears took over.
- NASDAQ:QQQ forming another megaphone pattern on 4h time frame
- NASDAQ:META Beat bullish earnings reaction
- NASDAQ:GOOGL fades all of its earnings gains and went red NASDAQ:MSFT held its gains.
- NASDAQ:AMZN earnings report tomorrow AH

Google -> Finally The BottomHello Traders,
welcome to this free and educational multi-timeframe technical analysis .
On the weekly timeframe you can see that Google stock just recently perfectly broke above and is now retesting a major previous weekly structure area which is now turned support at the HKEX:104 level.
You can also see that weekly market structure is now bullish, moving averages are also bullish and the recent price action on Alphabet stock just looks like a solid bottom formation so I simply do expect more continuation towards the upside from the current levels.
On the daily timeframe you can see that market structure is about to shift bearish so I am now just waiting for a clear bullish impulse and break above the daily HKEX:107 resistance before I then do expect more continuation towards the upside.
Thank you for watching and I will see you tomorrow!
You can also check out my previous analysis of this asset:

QQQ Falling Wedge Pattern | MSFT GOOGL Earnings Prediction | - NASDAQ:QQQ falling wedge pattern is about to break likely break tomorrow.
- QQQ & AMEX:SPY still trading in the same tight range for 3 weeks likely breaking this week with all the big tech earnings
- NASDAQ:MSFT NASDAQ:GOOGL Earnings report tomorrow AH

Market Outlook Analysis | Earnings Prediction | Support & Resist- QQQ Megaphone still in place
- NASDAQ:QQQ SKILLING:NASDAQ trading within 3 weeks range 320-312 area, likely breaking Tuesday
- Tuesday NASDAQ:MSFT NASDAQ:GOOGL Earnings prediction
- NASDAQ:AAPL broke out without much follow through, historically AAPL dips into earnings or after earnings if it moves up alot into it.
- advertising companies dont do well during recessions.
- AMEX:SPY still healthy daily uptrend that may change next week
- still holding my AMEX:SOXS ( NASDAQ:SOXX short )

GOOGLE +8%A massive profit driver for the company, this is the main ingredient in making Google a safe investment. Nearly 90% of Google's earnings and revenues come from search. These profits and revenues fund the projects Google hopes become future profit centers.

Next target to $41.09 for Alphabet ?Here is my point of view about Google.
Based on my Elliott Wave, the bear trend could come back the next week (April,17) after the optimistic Bull run from March,13.
We reach the the Fibonacci Ret 0.382% and the ii circle degree seems to be done after a complex correction in ABCDE.
And about the Time the Ret and Projection both are pointing April, 6 and 10.
My concern now it's the indicator DT Oscillator who seem to be not ready for a reversal now.. so it's might be sideway to down the week of April,17 and wait 1 more week to be ready for a reversal during the week April,24.
If this post was useful to you, do not forget to like and comment.❤️ 🙏
Kindly,
TradingX30
Y.F

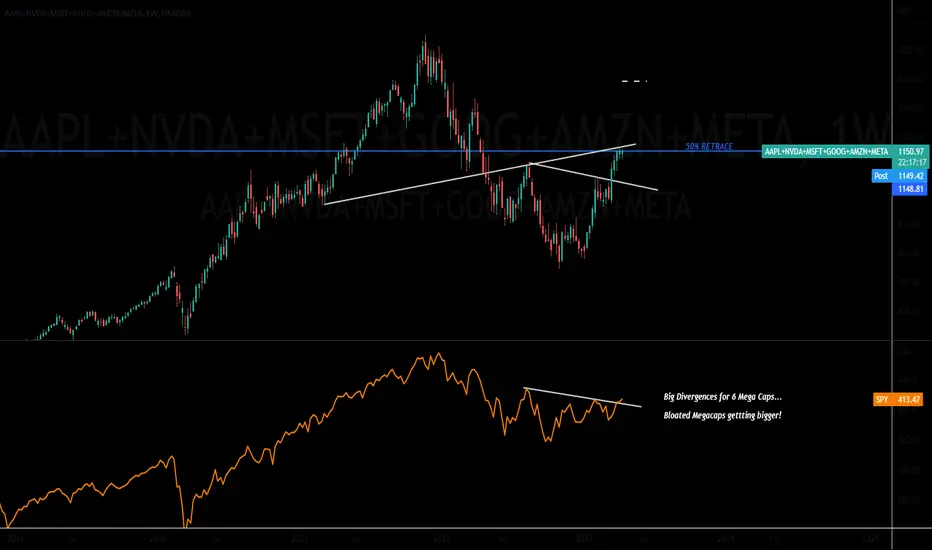
Big 6 Megacaps gaining all the money flow....Apple, Microsoft, Google, Amazon, Nvidia, Meta. these are the 6 stocks in the SPX that have been seeing all the moneyflow.
A concentration of capital in a few names does not make for a healthy stock market.
It leaves the markets vulnerable to a bigger decline if money is so concentrated in a few names.
the S&P500 is on the verge of a breakout but these massive names are at major resistance.
Without these names continuing their ascent, the SPX will likely not breakout.
Google -> Ready For The RallyHello Traders,
welcome to this free and educational multi-timeframe technical analysis .
On the weekly timeframe you can see that Google stock just recently broke above a quite obvious bearish trendline, breaking out of a multi-month downtrend.
You can also see that weekly market structure is bullish again, we already broke above the $100 resistance area and retested and rejected the area so everything seems very bullish on the weekly timeframe.
On the daily timeframe you can see that Google stock is retesting previous daily resistance at the FWB:108 area so I am now just waiting for a simple break and retest before I then do expect more continuation towards the upside.
Thank you for watching and I will see you tomorrow!
You can also check out my previous analysis of this asset:

BTC vs GOOGLHere are two similar patterns between bitcoin and google stock prices.
This can be a possible indicator, besides the two assets belong to the technology sector, which makes them assets with a similar adoption.
Obviously several external factors can influence the accuracy of the analysis, so don't take my analysis for granted.
NASDAQ:GOOGL
BITSTAMP:BTCUSD

AI - Running Away From The NazzyAn AI index, comprised of:
Shown in Blue
Google
Microsoft
NVIDIA
C3.AI
Nasdaq Shown in Orange
We see that they have broken away from the returns offered by the Nazzy Tech Index
Bottom of the Graph:
Spread between the above defined AI index and the Nazzy.
Has reached its All Time High..
Traders would have earned an additional 20+% by investing in the AI index in lieu of the Nazzy
Mind you, these companies have Zero additional profits resulting from AI, at this time.
How to profit from this?
Accepting ideas.
