Long $GOOGL, Too much pessimism priced in!- NASDAQ:GOOGL is one of the hated FAANG often get hit in the crossfire of misinformation campaign be it Ads related or Search related.
- NASDAQ:GOOGL is a verb and has lot of things going in favour. Leader in Quantum Computing, Healthy Growth in Cloud Services, Leader in Adtech, De-facto standard for Searches.
- Gemini is a decent LLM and I am seeing diversification of LLMs in the industry.
- Waymo is leader in autonomous vehicles.
- Google has invested in the future like SpaceX which could easily multiply its investment.
Fundamentally,
Year | 2025 | 2026 | 2027 | 2028
EPS | 9.54 | 10.18 | 11.71 | 13.21
EPS% | 18.93% | 6.71% | 15.10% | 12.81%
Base Case (Forward p/e ~ 20 )
Year | 2025 | 2026 | 2027 | 2028
Stock Price | $190 | $203 | $234 | $264
Bear Case ( Forward p/e ~ 15 )
Year | 2025 | 2026 | 2027 | 2028
Stock Price | $143 | $152 | $175 | $198
Bull Case ( Forward p/e ~ 25 )
Year | 2025 | 2026 | 2027 | 2028
Stock Price | $238 | $254 | $292 | $330
Comfortable buying NASDAQ:GOOGL < 160 and targeting $210-220 in 1-1.5 year timeframe.

GOOGL (Alphabet Inc.) – Medium-Term Position Trade SetupNASDAQ:GOOGL is showing strength as it revisits its previous all-time high, now aligning with the 50% Fibonacci retracement of the current wave. The price action suggests a bullish flip of resistance into support at the $153 zone, with clear signs of buyer defense—offering a compelling medium-term opportunity.
🔹 Entry Zone:
Around $153 (support zone)
🎯 Take Profit Targets:
🥇 $200
🥈 $230
🛑 Stop Loss:
Weekly close below $130

Alphabet (GOOGL) Shares Drop Over 7% in a Single DayAlphabet (GOOGL) Shares Drop Over 7% in a Single Day
According to the Alphabet (GOOGL) stock chart, yesterday’s main trading session opened around $163.70 but then saw a sharp decline, hitting an intraday low of approximately $148 per share. By the close, bulls managed to recover only a small portion of the losses. As a result, Alphabet (GOOGL) shares fell by more than 7% during the session – marking the worst performance among the S&P 500 constituents (US SPX 500 mini on FXOpen).
Why Did GOOGL Shares Fall?
The drop followed remarks by Eddy Cue, Apple’s Senior Vice President of Internet Software and Services, who:
→ noted a decline in search traffic on Safari;
→ revealed plans to expand Safari’s search capabilities using artificial intelligence.
These developments heightened concerns over Google’s dominance in search and its advertising revenue. According to media reports, analysts are warning of rising competition from AI-powered search platforms such as OpenAI, Grok, and Perplexity.
Technical Analysis of Alphabet (GOOGL) Shares
In our 23 April analysis, we identified a descending price channel and emphasised the psychological significance of the $150 level, which had served as a key support in 2024.
Since then, bulls showed confidence by pushing the price above the red channel. In addition, the chart has begun to outline a potential ascending trend channel (marked in blue).
However, yesterday’s statement from competitors shifts the outlook. The current GOOGL stock price is positioned at the lower boundary of the blue channel – which could act as support, reinforced by the psychological $150 level.
On the other hand, a bearish breakout below this area may revive the downtrend that began in February, potentially paving the way for a test of this year’s lows.
This article represents the opinion of the Companies operating under the FXOpen brand only. It is not to be construed as an offer, solicitation, or recommendation with respect to products and services provided by the Companies operating under the FXOpen brand, nor is it to be considered financial advice.

GOOG Simple Short TradeCRACK!
GOOG has now broken a key area with the potential to have a huge move down.
This is a very simple trade with great risk/reward.
Bulls!! Caution is in order!!

Google in trouble with Apple AI? Watch $146 next?Apple has confirmed it is actively exploring a redesigned web browser across iPhone, iPad, and Mac with a focus on AI-powered search. The potential shift away from Google as the default search provider on iOS devices, poses a direct risk to Alphabet’s search business.
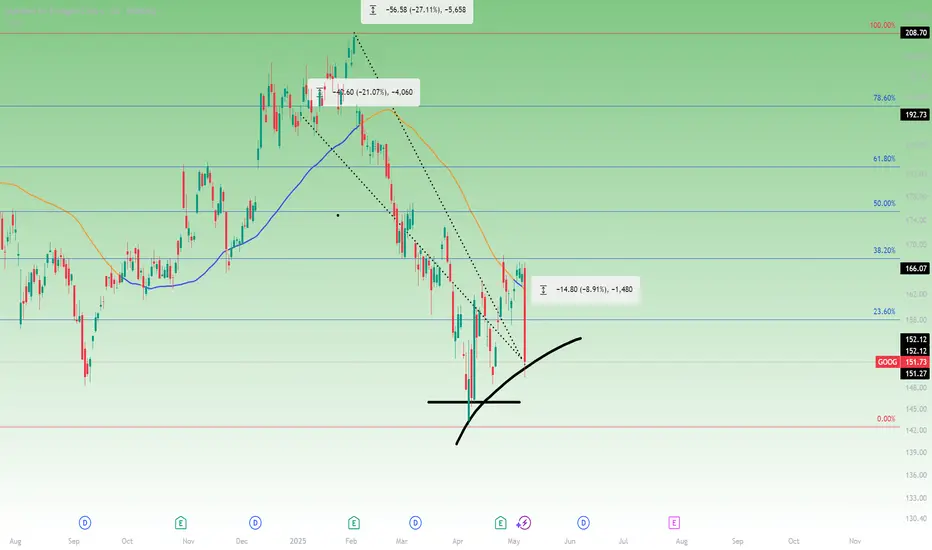
Alphabet shares fell $14.11 (-8.54%) to $151.09 USD on the news, breaking below the 50-day moving average at $162.00 and the 23.6% Fibonacci retracement from the February high and April low, after finding resistance at the 38.2%.
From its February high, Alphabet is now down 27.1%, with a year-to-date loss of 21.1%.
While the stock remains above its 2025 low of $140.53, downside levels to monitor include ~$145.90.
$GOOGL Breakdown – AI Risk Is No Longer "Future Tense"🚨 BREAKING: NASDAQ:AAPL confirms they are exploring AI-powered search within Safari after a decline in browser searches for the first time ever.
💥 NASDAQ:GOOGL is down over 8% intraday, cracking long-term trendline support and decisively below the 200DMA ($173).
📉 The setup is ugly:
Insiders sold post-earnings (again).
Trendline + moving average both lost.
Volume spike and vertical price action = capitulation risk ahead.
🔻 Downside momentum could accelerate if price fails to reclaim $155 quickly.

Stock Market Forecast | TSLA NVDA AAPL AMZN META MSFTStock Market Forecast | CME_MINI:NQ1! CME_MINI:ES1! QQQ SPY SP:SPX
Mag 7 Forecast TSLA NASDAQ:NVDA AAPL AMZN META MSFT

Google Ruling Could Be Very Bullish for TTDA U.S. judge has found Google guilty of illegally monopolizing the digital advertising technology markets. The monopolization of both the demand and supply sides has been a long-standing concern for the rest of the digital advertising sector.
This ruling may significantly benefit The Trade Desk (TTD), as it operates as an independent demand-side platform. The digital advertising market is projected to exceed $600 billion in 2025, and Google currently believed to be controls nearly 30% of that. Even a 5% slip in Google’s market share, with TTD capturing just 10% of that shift, could nearly double TTD's revenue. As a result, this ruling is can be considered very bullish for TTD, both in the medium and long term.
Technically, TTD recently tested the $40 level, a key support that has held since Q4 of 2020, indicating the stock is currently in a strong demand zone. With this news, the likelihood of that support holding and a bullish reversal increases.
Analyst consensus reflects an 85.8% upside potential. If the bullish scenario plays out, the horizontal level at $60 and the 200-day moving average could serve as key medium-term targets. From current levels to the 200-day SMA, the potential return is close to 50%.

Google stock oscillates below $170 after earnings releaseGoogle's stock managed to post a bullish gap of more than 3% in the last session, shortly after the company announced its quarterly results. Initially, it was reported that total sales for the last published quarter reached $90.23 billion, compared to the expected $89.12 billion. In addition, the company posted earnings per share of $2.81, beating expectations of $2.00. This positive outcome initially triggered a spike in investor confidence, but for now, the market sentiment has stabilized, and the stock is closing the week with a bearish candlestick on the chart.
Previous trendline break:
The recent consistent bullish movements in Google have been important in breaking a downward trendline that was previously dominant on the chart. For now, this has paved the way for a new bullish bias, and a new upward trendline could be forming, potentially becoming the most relevant technical structure for the stock in the coming sessions. However, it is important to note that this early bullish trendline still requires new price highs to confirm its strength.
ADX:
Although ADX oscillations remain above the neutral 20 level, the slope of the line has started to turn negative. This suggests that, despite the positive earnings, volatility may be beginning to decline, which could eventually lead to a sideways bias in the stock’s movements in the short term.
MACD:
The MACD histogram continues to show oscillations above the neutral 0 line, but it is becoming increasingly necessary for this to be sustained to confirm the buying strength reflected in the moving averages. If the MACD starts to decline, it could be interpreted as a bearish correction signal that may weigh on Google's price.
Key Levels:
$175: A relevant resistance aligned with the 100- and 200-period moving averages. Buying oscillations reaching this level could reactivate bullish momentum and give way to a new relevant uptrend.
$160: A nearby support zone aligned with the 23.6% Fibonacci retracement level. It could serve as a tentative barrier where potential short-term downside corrections might occur.
$143: A definitive support that coincides with the recent lows of the stock. A pullback toward this level could reactivate the previous bearish trend in this market.
Written by Julian Pineda, CFA – Market Analyst

Alphabet Shares Surge 6% In Premarket Amid Earnings BeatShares of Alphabet Inc. (NASDAQ: NASDAQ:GOOG ) spike 6% in Friday's premarket session amidst earnings beat.
Google parent Alphabet (NASDAQ: NASDAQ:GOOG ) reported first-quarter revenue and profit that exceeded analysts’ expectations, sending shares higher in extended trading Thursday.
The tech giants reported revenue of $90.23 billion, up 12% year-over-year and above the analyst consensus from Visible Alpha.1 Net income of $34.54 billion, or $2.81 per share, compared to $23.66 billion, or $1.89 per share, a year earlier, also topping Wall Street’s estimates. Google Cloud revenue rose 28% to $12.3 billion, while Search & Other segment revenue grew 10% to $50.7 billion.
Alphabet also raised its quarterly dividend by 5% to 21 cents, and announced an additional $70 billion in stock buybacks. Alphabet's Class A shares rose close to 5% in after-hours trading. The stock was down about 16% for 2025 through Thursday’s close.
Alphabet Reiterates Spending Plans as AI Features Expand Reach and Engagement
CEO Sundar Pichai said Search growth was driven by "engagement we’re seeing with features like AI Overviews, which now has 1.5 billion users per month" after launching in May 2024.2
“We do see a tremendous opportunity ahead of us across the organization,” CFO Anat Ashkenazi said, adding that Alphabet ended the quarter with more Cloud demand than it had capacity.
Technical Outlook
As of the time of writing, shares of NASDAQ:GOOG are up 5% in Friday's premarket trading, bouncing off from the critical support zone of $146. NASDAQ:GOOG 's next top is the $200 resistant a move that will deliver a stunning 29% in gains. All present metrics are pointing to a bullish campaign, the asset is already trading below key moving averages giving NASDAQ:GOOG room to capitalize on this technical to make a comeback.

GOOGLE: Attention!!! Bullish force assured!!Alphabet, Google's parent company, presented its results for the first quarter of the year this Thursday, in which it obtained a profit of $34.540 billion, representing a 46% increase compared to the $23.662 billion obtained in the same period of the previous year.
The company also exceeded expectations with its revenue figure, which stood at $90.234 billion, after registering a year-on-year increase of 12%, while the consensus expected it to be $89.120 billion. For its part, operating profit grew to $30.606 billion, with a margin of 34%.
In summary: VERY GOOD RESULTS, and if we add to this the favorable moment we are experiencing due to the TARIFF issue... it WILL go up, no doubt!
---> What is the technical aspect?
If we observe the H1 timeframe chart and its summary table, its trend was clearly bearish, but showing THE FIRST BULLISH SIGNALS. On Wednesday, the bullish force (Bull) signal appeared on the H1 chart, and yesterday, Thursday, it appeared on the H4 chart. Although its trend is still bearish, since its FORCE is now bullish, we can start thinking that its trend could change to BULLISH in the coming days if there are NO NEWS that get in the way.
---> Where do we make the entry?
As the results were published at the close of the American market, today it is most likely to open with a bullish GAP. Here we can do 2 things:
1) If the gap is small, enter at the opening.
2) If the gap is VERY LARGE, wait for a pullback during the day to enter at a better price.
--------------------------------------
Strategy to follow:
ENTRY: We will open 2 long positions in the current zone or taking advantage of a pullback in price (depending on the market gap).
POSITION 1 (TP1): We close the first position in the 183 zone (+12%)
--> Stop Loss at 148 (-8%).
POSITION 2 (TP2): We open a Trailing Stop type position.
--> Initial dynamic Stop Loss at (-8%) (coinciding with 148 of position 1).
--> We modify the dynamic Stop Loss to (-1%) when the price reaches TP1 (183).
-------------------------------------------
CLARIFICATIONS OF THE SETUP
*** How to know which 2 long positions to open? Let's take an example: If we want to invest 2,000 euros in the stock, what we do is divide that amount by 2, and instead of opening 1 position of 2,000, we will open 2 positions of 1,000 each.
*** What is Trailing Stop? A Trailing Stop allows a trade to continue gaining value when the market price moves in a favorable direction, but automatically closes the trade if the market price suddenly moves in an unfavorable direction by 1 a certain distance. That certain distance is the dynamic Stop Loss.
-->Example: If the dynamic Stop Loss is at -1%, it means that if the price makes a downward movement of -1%, the position will be closed. If the price goes up, the Stop Loss also goes up to maintain that -1% on the rises, therefore, the risk is increasingly lower until the position enters profits. In this way, very solid and stable trends in the price can be exploited, maximizing profits.

$GOOGL primed for a BIG MOVE!NASDAQ:GOOGL primed for a BIG MOVE! 🚀
Heading into earnings, this stock’s valuation has been overlooked—but strong results could flip the narrative fast! 💨
✅ Bounced off 2021 highs
✅ RSI at its lowest since COVID
✅ Major indicators curling upward
✅ Volume shelf launch incoming
✅ Wr% pendulum swinging
Momentum is building—are you ready? 👀
Not financial advice

GOOGL: A Resilient Bounce Sets Up the Next WaveGOOGL DAILY TECHNICAL ANALYSIS 📊
OVERALL TREND
📈 UPTREND — Price has rebounded off the April low with increasing bullish pressure, now holding above key short-term moving averages. A potential trend reversal is underway if momentum sustains above 155.
📉RESISTANCE ZONE
🔴 207.05 — PIVOT HIGH | SELL STOPLOSS
🔴 203.76 — SELL ORDER II
🔴 197.10 — SELL ORDER I
🎯ENTRIES & TARGETS
🟢 193.74 — EXIT BUY & TP 4
🟢 181.64 — BUY ORDER & TP 3
🟢 173.79 — BUY ORDER & TP 2
🟢 140.53 — BUY ORDER & TP 1
📈SUPPORT ZONES
🟢 150.92 — BUY ORDER 1
🟢 143.85 — BUY ORDER 2
🟢 207.05 — BUY STOPLOSS | PIVOT LOW
📈MOVING AVERAGE SUMMARY
✅ Short-Term MAs (10–50) — Bullish crossover confirmed, supporting upside
⚠️ Mid-Term MAs (100) — Still bearish, price must sustain above 156.70
🔴 Long-Term MAs (200) — Bearish, still weighing on broader structure
✍️STRUCTURAL NOTES
Price recently flipped bullish across 10–50 SMA/EMA clusters
Volume confirming strength, but needs follow-through above 162.48
Stochastic RSI (95.93) is overheated — expect short-term pullback or consolidation
MACD, Momentum, and AO all signal increasing buy-side control
Ichimoku Base Line (153.25) being tested — reclaiming it is bullish confirmation
TRADE OUTLOOK 🔎
📈 Bullish bias holds above 150.92 and especially above 155.63
🎯 Upside targets: 162.48 → 173.79 → 181.64
📉 Short-term rejection possible near TP1 — RSI and StochRSI nearing exhaustion
👀 Watch for a decisive break above 162.48 with volume for continuation
🧪STRATEGY RECOMMENDATION
CONSERVATIVE (Trend-Following):
— Buy Entry: 155.63
— TP Levels: 162.48 / 173.79 / 181.64
— SL: Below 150.92
HIGH-RISK SCALP (Momentum Pullback):
— Buy Dip: 150.92 or 143.85
— TP: 155.63 / 162.48
— SL: Below 140.35
“Discipline | Consistency | PAY-tience”

Alphabet (GOOGL) Shares Hover Near Psychological LevelAlphabet (GOOGL) Shares Hover Near Psychological Level Ahead of Earnings Report
On 31 March, we noted that bearish sentiment could push Alphabet’s (GOOGL) share price towards the psychological level of $150. As the current price chart suggests, GOOGL is now trading close to that very level.
Moreover, the price is approximately equidistant from the recent highs and lows (marked A and B), which may be interpreted as a sign of balanced supply and demand — and a wait-and-see stance from market participants ahead of Alphabet’s Q1 earnings release (scheduled for tomorrow, 24 April).
Awaiting the GOOGL Earnings Report
With the Nasdaq 100 index (US Tech 100 mini on FXOpen) having fallen by around 13.5% since the beginning of the year, investors are approaching tech earnings with caution. According to Barron’s, three key themes are expected to dominate the narrative:
→ management forecasts amid continued uncertainty around the White House’s tariff policy;
→ plans for major capital investment in AI-related infrastructure;
→ signs of softening consumer demand.
Given the current climate of uncertainty, Alphabet’s earnings report could prove particularly influential — serving as a benchmark for shaping market expectations ahead of other major tech company reports.
Technical Analysis of Alphabet (GOOGL)
The $150 level has served as key support throughout 2024, and over the coming days it may act as a springboard for a new price movement, potentially driven by the earnings results.
From a bearish perspective, the market remains in a downward trend (indicated in red) following a breakout below the lower boundary of a previously active rising channel (marked in purple) that had held since last autumn. However, if Alphabet’s management maintains an upbeat outlook for 2025, this could give the bulls the confidence to challenge the upper limit of the red channel.
This article represents the opinion of the Companies operating under the FXOpen brand only. It is not to be construed as an offer, solicitation, or recommendation with respect to products and services provided by the Companies operating under the FXOpen brand, nor is it to be considered financial advice.

GOOG Alphabet Options Ahead of EarningsIf you haven`t bought GOOG before the previous rally:
Now analyzing the options chain and the chart patterns of GOOG Alphabet prior to the earnings report this week,
I would consider purchasing the 170usd strike price Calls with
an expiration date of 2025-7-18,
for a premium of approximately $4.35.
If these options prove to be profitable prior to the earnings release, I would sell at least half of them.

GOOGL 1H Swing Long Conservative Trend TradeConservative Trend Trade
+ long impulse
+ 1H / 1D level coincide
+ T2 level
+ support level
+ biggest volume 2Sp-
Calculated stop limit
1 to 2 R/R take profit
Daily Trend
"+ long impulse
+ JOC test / T2 level
+ support level
+ 1/2 correction"
Monthly Trend
"+ long impulse
+ T2 level
+ support level
- before 1/2 correction"
Yearly Trend
"+ long impulse
- T1 level
- resistance level"

GOOGL Weekly Options Trade Plan 2025-04-17GOOGL Weekly Analysis Summary (2025-04-17)
Below is our integrated analysis for GOOGL weekly options trading based on the current options data and the multiple model reports:
──────────────────────────────
Comprehensive Summary of Each Model’s Key Points
• Grok/xAI Report – Observes that although the 5‐minute chart shows a hint of short‐term bullishness, the daily chart is clearly bearish (price below the 10 EMA and RSI around 41) and news catalysts (antitrust concerns) add further downside bias. – Highlights a significant concentration of put open interest around the $150 strike and recommends buying the $150 put at a premium of about $0.24 with an entry at open. – Suggested profit target at roughly a 50% premium increase and a stop loss if the premium falls by about 25% (or if the price fails to break key resistance).
• Claude/Anthropic Report – Confirms a moderately bearish bias with price trading below all key daily EMAs and negative regulatory news intensifying the downside. – Points to the heavy open interest in the 150 puts and emphasizes that although max pain is at $155 (a theoretical pull toward higher prices), the aggressive negative catalyst trumps this signal. – Recommends a put trade with guidelines for profit-taking (roughly a 100% premium gain) and a 50% premium stop-loss; entry to be made at market open.
• Gemini/Google Report – Notes the strong bearish daily setup (price clearly below the 10/50/200 averages and near key supports around $150) combined with negative antitrust headlines. – While acknowledging some short-term consolidation on the 5-minute chart, the report favors a bearish play and selects the $150 put (even though its premium of $0.24 is a bit below the “ideal” $0.30–$0.60 range). – Recommends entering at open with specific targets (aiming for around a 100% return on premium or an exit if the underlying fails to break levels) and strict stop-loss discipline.
• Llama/Meta Report – Summarizes that the technicals (including MACD and RSI on both timeframes) and high volatility (VIX ~32.64) combine for a moderately bearish setup. – The heavy put open interest at $150 further reinforces this view. – Recommends buying the $150 put at market open with a modest profit target (around a 50% gain on premium) and a stop-loss if the underlying rallies above key resistance levels.
• DeepSeek Report – Emphasizes that despite the max pain at $155, the technical breakdown below key moving averages and significant negative news support a bearish trade. – Recommends buying weekly (0DTE) $150 puts at the current premium of $0.24, with exit parameters tied to breaching immediate support or achieving a 50% gain in premium. – Notes that risk management is crucial given the 0DTE nature and high volatility.
────────────────────────────── 2. Areas of Agreement and Disagreement Between Models
• Agreement: – All models share a moderately bearish outlook driven by a combination of: ○ Price performance below key moving averages and declining daily RSI. ○ Negative news catalysts (antitrust issues and breakup concerns). ○ Heavy put open interest at the $150 strike, aligning with technical support. – Each model favors a single-leg, naked put strategy on GOOGL weekly expirations, with an entry at market open.
• Disagreement: – There is some variation in the selection of profit target and stop loss levels: ○ Grok/xAI and DeepSeek lean toward a profit target near a 50% premium gain and a tighter stop loss, while Claude/Anthropic and Gemini reference a slightly larger profit target (up to 100% gain) paired with a 50% stop loss. – There is a mild conflict with the max pain theory (which is bullish at $155) versus the consensus technical and news story indicating further downside. However, all models agree that the negative catalysts outweigh the theoretical pull toward max pain.
────────────────────────────── 3. Conclusion and Trade Recommendation
• Overall Market Direction Consensus: – The integrated view is moderately bearish. Although intraday charts hint at short-term consolidation, the dominant daily technicals, high volatility, and strongly negative news set the stage for further downside pressure.
• Recommended Trade: – We recommend buying a single-leg, naked put option. – Selected Instrument: GOOGL weekly option with a $150 strike (0DTE expiring on 2025-04-17). – Premium: The current ask is $0.24 per contract. Although this is slightly below the ideal range, the risk/reward profile is favorable given the strong technical and sentiment bias. – Entry Timing: Enter at market open. – Profit Target: Aim for a premium increase to approximately $0.36 (a ~50% gain). – Stop-Loss: Set a stop-loss around $0.12 (roughly a 50% reduction in premium), or exit if the underlying rallies decisively above the intraday resistance levels (around $152). – Confidence Level in the Recommendation: Approximately 70%.
• Key Risks and Considerations: – The max pain level at $155 could introduce some intraday upward pressure. – High implied volatility (VIX at 32.64) means rapid moves could quickly hit stop-loss triggers. – The 0DTE nature of the option calls for strict monitoring; if GOOGL fails to break below key support levels early on, exit the position promptly. – Overall market reversals or unexpected news can rapidly change the trade dynamics.
────────────────────────────── 4. TRADE_DETAILS (JSON Format)
{ "instrument": "GOOGL", "direction": "put", "strike": 150.00, "expiry": "2025-04-17", "confidence": 0.70, "profit_target": 0.36, "stop_loss": 0.12, "size": 1, "entry_price": 0.24, "entry_timing": "open" }
Disclaimer: This newsletter is not trading or investment advice but for general informational purposes only. This newsletter represents my personal opinions based on proprietary research which I am sharing publicly as my personal blog. Futures, stocks, and options trading of any kind involves a lot of risk. No guarantee of any profit whatsoever is made. In fact, you may lose everything you have. So be very careful. I guarantee no profit whatsoever, You assume the entire cost and risk of any trading or investing activities you choose to undertake. You are solely responsible for making your own investment decisions. Owners/authors of this newsletter, its representatives, its principals, its moderators, and its members, are NOT registered as securities broker-dealers or investment advisors either with the U.S. Securities and Exchange Commission, CFTC, or with any other securities/regulatory authority. Consult with a registered investment advisor, broker-dealer, and/or financial advisor. By reading and using this newsletter or any of my publications, you are agreeing to these terms. Any screenshots used here are courtesy of TradingView. I am just an end user with no affiliations with them. Information and quotes shared in this blog can be 100% wrong. Markets are risky and can go to 0 at any time. Furthermore, you will not share or copy any content in this blog as it is the authors' IP. By reading this blog, you accept these terms of conditions and acknowledge I am sharing this blog as my personal trading journal, nothing more.

Google - Fantastic Bullish Break And Retest!Google ( NASDAQ:GOOGL ) just looks amazing:
Click chart above to see the detailed analysis👆🏻
For more than a decade, Google has been trading in a rising channel formation, perfectly respecting all market structure. Now, Google is about to retest the previous all time high once again and with a sharp correction of about -25%, this offers a significant bullish reversal setup.
Levels to watch: $150
Keep your long term vision,
Philip (BasicTrading)

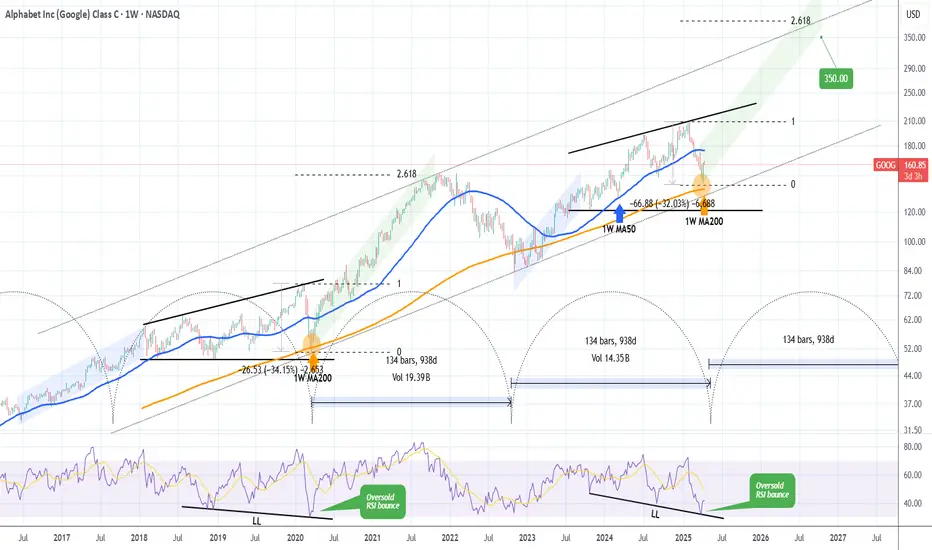
GOOGLE's generational bottom made. This is how it reaches $350.Alphabet Inc. (GOOG) almost tested last week its 1W MA200 (orange trend-line). That level has been holding for more than 2 years (since March 13 2023) and it's been the main Support of the Bull Cycle that followed the November 2022 Inflation Crisis bottom.
The pattern is almost like the Ascending Triangle that led to the March 2020 COVID crash, which was the most recent time before the late 2022 bottom that the stock made contact with the 1W MA200. As you realize, all those times have been what we call 'generational bottoms', thus extremely good long-term buy opportunities. And as you see they've been on extremely tight time symmetry, all took place roughly every 2.5 years.
If the pattern continues to repeat itself, then we may witness a rally (green Channel Up) similar to the one that peaked on November 2021 and reached the 2.618 Fibonacci extension. As a result, setting a $350 Target would be more than realistic based on this pattern.
-------------------------------------------------------------------------------
** Please LIKE 👍, FOLLOW ✅, SHARE 🙌 and COMMENT ✍ if you enjoy this idea! Also share your ideas and charts in the comments section below! This is best way to keep it relevant, support us, keep the content here free and allow the idea to reach as many people as possible. **
-------------------------------------------------------------------------------
💸💸💸💸💸💸
👇 👇 👇 👇 👇 👇
Can Efficiency Topple AI's Titans?Google has strategically entered the next phase of the AI hardware competition with Ironwood, its seventh-generation Tensor Processing Unit (TPU). Moving beyond general-purpose AI acceleration, Google specifically engineered Ironwood for inference – the critical task of running trained AI models at scale. This deliberate focus signals a Major bet on the "age of inference," where the cost and efficiency of deploying AI, rather than just training it, become dominant factors for enterprise adoption and profitability, positioning Google directly against incumbents NVIDIA and Intel.
Ironwood delivers substantial advancements in both raw computing power and, critically, energy efficiency. Its most potent competitive feature may be its enhanced performance-per-watt, boasting impressive teraflops and significantly increased memory bandwidth compared to its predecessor. Google claims nearly double the efficiency of its previous generation, addressing the crucial operational challenges of power consumption and cost in large-scale AI deployments. This efficiency drive, coupled with Google's decade-long vertical integration in designing its TPUs, creates a tightly optimized hardware-software stack potentially offering significant advantages in total cost of ownership.
By concentrating on inference efficiency and leveraging its integrated ecosystem, encompassing networking, storage, and software like the Pathways runtime, Google aims to carve out a significant share of the AI accelerator market. Ironwood is presented not merely as a chip, but as the engine for Google's advanced models like Gemini and the foundation for a future of complex, multi-agent AI systems. This comprehensive strategy directly challenges the established dominance of NVIDIA and the growing AI aspirations of Intel, suggesting the battle for AI infrastructure leadership is intensifying around the economics of deployment.

SPX WEEKLY 7TH APRIL 2025Welcome to SPX weekly. I have deeply discussed the price action here. If you have any doubts, feel free to leave a message or comment below.
NOTE:DO NOT SHORT

Thoughts on US equities. Not looking good at all. Expecting more sellside distribution on US equities. We need to go towards any discount levels

OptionsMastery: Looks like a good buy on GOOGLE!🔉Sound on!🔉
📣Make sure to watch fullscreen!📣
Thank you as always for watching my videos. I hope that you learned something very educational! Please feel free to like, share, and comment on this post. Remember only risk what you are willing to lose. Trading is very risky but it can change your life!
