Update of FBIt's gone, this chart won't return upward again, crossed down lower bond of yellow channel and keeps falling until the middle of red channel. No entry at above 150.
GOOGLNot financial advice.
The essence of investing & trading is the intelligent and patient preying on the greed, fear, impatience, addiction and ignorance of the majority. It's definitionally Darwinian.

GOOGL Earnings Miss | YouTube revenue disappointsYouTube has more than 2bn monthly users.
YouTube revenues rose 14% to $6.9bn, below the $7.5bn expected by analysts.
YouTube revenue disappoints on growing TikTok competition concerns and Ukraine war which impacted YouTube ads.
GOOGL 23% increase in revenue in Q1 to $68bn, but below forecasts for $68.1bn.
In 2021, revenues increased 34%.
Considering the above, future growth is not so sure.
I expect a retracement to the $2100 level.

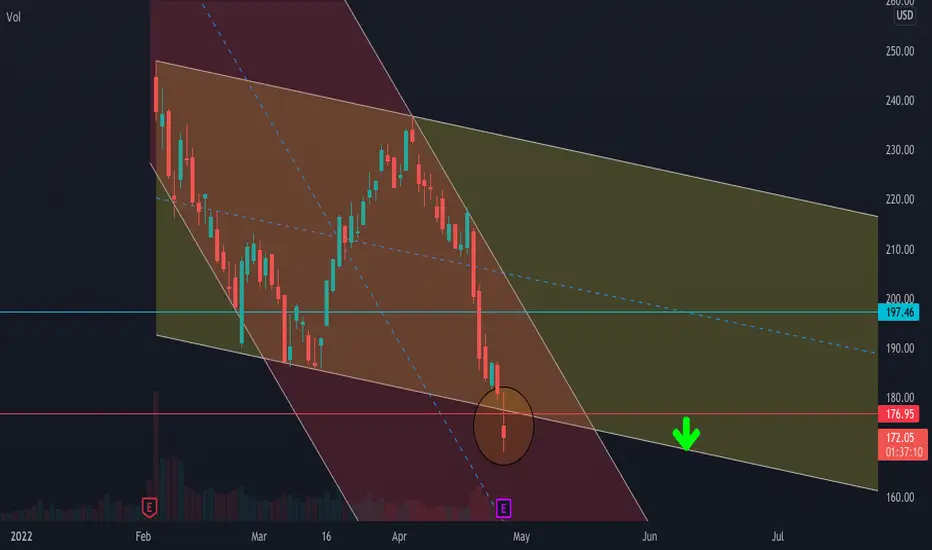
GOOGLE ready for LONGHello Traders, here is the full analysis for Google, let me know in the comment section below if you have any questions.
The ellipse could represent a possible zone with good risk/reward to accumulate long position.
Please note that all the information and publications hera are not meant to be, and do not constitute, financial, investment, trading, or other types of advice or recommendations. What you will find here, are only views of a Cat passionate about Finance.

The Bears Come For Google Well, well, well, this is precisely what I was talking about in my post about big tech. This is just a short post, showing some levels. These overheated stocks are finally getting a taste of profit-taking. Netflix managed to actually break below its 200 week moving average. If Google does the same, another 50%+ drop is possible. On the conservative side, Google can simply head towards the 200 MA and bounce. However, I really think there are some people sitting on enormous profits that have yet to start realizing those gains. Let's see! Will GOOGLE tank another 50-80% from here?
I am of the general opinion that markets will need to return to pre-COVID levels (at best) in order to correct current inflation, and in order for the economy to begin sorting itself out with significant policy change. This is because the market has largely been propped up due to money printing and QE.
This is meant for speculation and entertainment only, not financial advice.
-Victor Cobra

Beginning of an End / UpdateAs forecasted, Tesla crossed down the resistance bond (in post market). It may fall below 850 by the end of this week.
Late May at around $730 is good for buying (short-term view).

More than %50 in one month!A dramatic sharp increase is expected, recommended for mid-term, growing up to around 30-35.


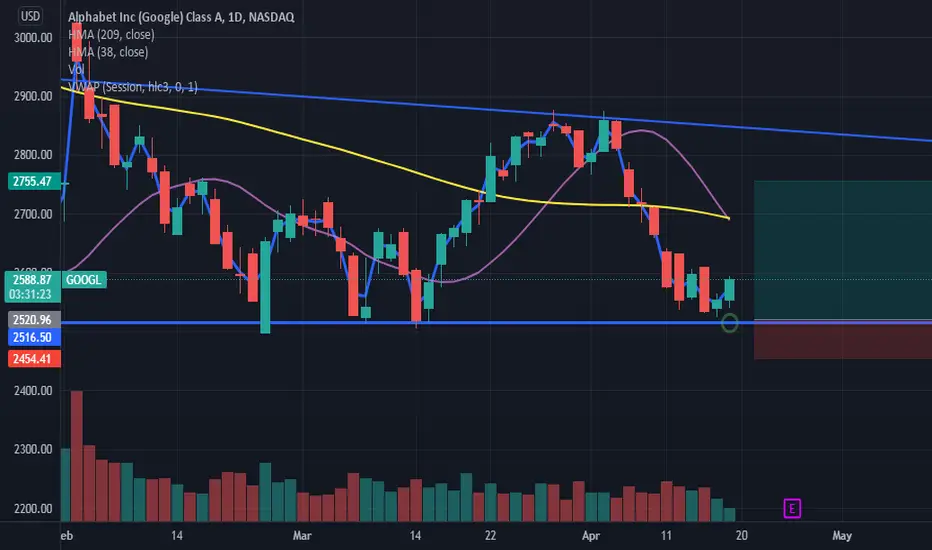
Google broken through key support? Alphabet
Short Term - We look to Sell at 2458.30 (stop at 2544.79)
Preferred trade is to sell into rallies. Previous support level of 2500.00 broken. Trading volume is increasing. The bias is still for lower levels and we look for any gains to be limited. Trading has been mixed and volatile. We look to set shorts in the early trade.
Our profit targets will be 2173.56 and 2014.00
Resistance: 2500.00 / 2800.00 / 3000.00
Support: 2300.00 / 2000.00 / 1800.00
Disclaimer – Saxo Bank Group. Please be reminded – you alone are responsible for your trading – both gains and losses. There is a very high degree of risk involved in trading. The technical analysis, like any and all indicators, strategies, columns, articles and other features accessible on/though this site (including those from Signal Centre) are for informational purposes only and should not be construed as investment advice by you. Such technical analysis are believed to be obtained from sources believed to be reliable, but not warrant their respective completeness or accuracy, or warrant any results from the use of the information. Your use of the technical analysis, as would also your use of any and all mentioned indicators, strategies, columns, articles and all other features, is entirely at your own risk and it is your sole responsibility to evaluate the accuracy, completeness and usefulness (including suitability) of the information. You should assess the risk of any trade with your financial adviser and make your own independent decision(s) regarding any tradable products which may be the subject matter of the technical analysis or any of the said indicators, strategies, columns, articles and all other features.
Please also be reminded that if despite the above, any of the said technical analysis (or any of the said indicators, strategies, columns, articles and other features accessible on/through this site) is found to be advisory or a recommendation; and not merely informational in nature, the same is in any event provided with the intention of being for general circulation and availability only. As such it is not intended to and does not form part of any offer or recommendation directed at you specifically, or have any regard to the investment objectives, financial situation or needs of yourself or any other specific person. Before committing to a trade or investment therefore, please seek advice from a financial or other professional adviser regarding the suitability of the product for you and (where available) read the relevant product offer/description documents, including the risk disclosures. If you do not wish to seek such financial advice, please still exercise your mind and consider carefully whether the product is suitable for you because you alone remain responsible for your trading – both gains and losses.

Google (NASDAQ: $GOOG) Just Search It, Mi Amigo! 🍕Alphabet Inc. provides various products and platforms in the United States, Europe, the Middle East, Africa, the Asia-Pacific, Canada, and Latin America. It operates through Google Services, Google Cloud, and Other Bets segments. The Google Services segment offers products and services, including ads, Android, Chrome, hardware, Gmail, Google Drive, Google Maps, Google Photos, Google Play, Search, and YouTube. It is also involved in the sale of apps and in-app purchases and digital content in the Google Play store; and Fitbit wearable devices, Google Nest home products, Pixel phones, and other devices, as well as in the provision of YouTube non-advertising services. The Google Cloud segment offers infrastructure, platform, and other services; Google Workspace that include cloud-based collaboration tools for enterprises, such as Gmail, Docs, Drive, Calendar, and Meet; and other services for enterprise customers. The Other Bets segment sells health technology and internet services. The company was founded in 1998 and is headquartered in Mountain View, California.

Trade Setup For Google stockGoogle stock is likely to keep dropping for now.
Going back to 2020 Covid19 zone.

Can $GOOGL avoid the inevitable?$GOOGL reports next week. On Friday, the stock broke the last big support area at $2490 and looks extremely vulnerable. In case of a miss or poor guidance, the recent bullish cycle may come to a sudden stop and the price may reach $2100 quickly. A strong report coupled with good guidance may offer an oversold bounce to $2600-2650. We would rather buy some calls rather than puts given $GOOGL's history

GOOGLE FORCASR- on the weekly chart : the price broke the level downward with a very big red candle
- on the daily chart : a very big candle in the last day of the week with an important volume
- personal opinion : the big red candle with the big volume under the level could indicate the sellers their profit and an equal big green candle will appear next or could also indicates the presence of the sellers that will push the price even lower
- best move : wait until we see a confirmation on the 15 min chart on monday . and that confirmation is if the price breaking the VWAP and went up then go in as buyers . but if it got broken with a brearish movment then sell

GOOGLE UPDATE - on the daily chart : massiive red candle put the price down but didnt hit the stop loss yet
- best move : dont do anything until today's candle form
GOOGLE UPDATE (HOLD YOUR POSITION)- on the daily chart : a very descent green candle appeard yestrday with a more important volume assuring us that the uptrend will continue
- personal opinion : the up trend will continue for the next few days
- best move : Hold your position and fill up your pockest with money

GOOGLE UPDATE (BUY/DOUBLE)- on the daily chart : google gave us a strong green candle after bouncing of the level confirming the new uptrend
- best move : buy now or double your position if you could
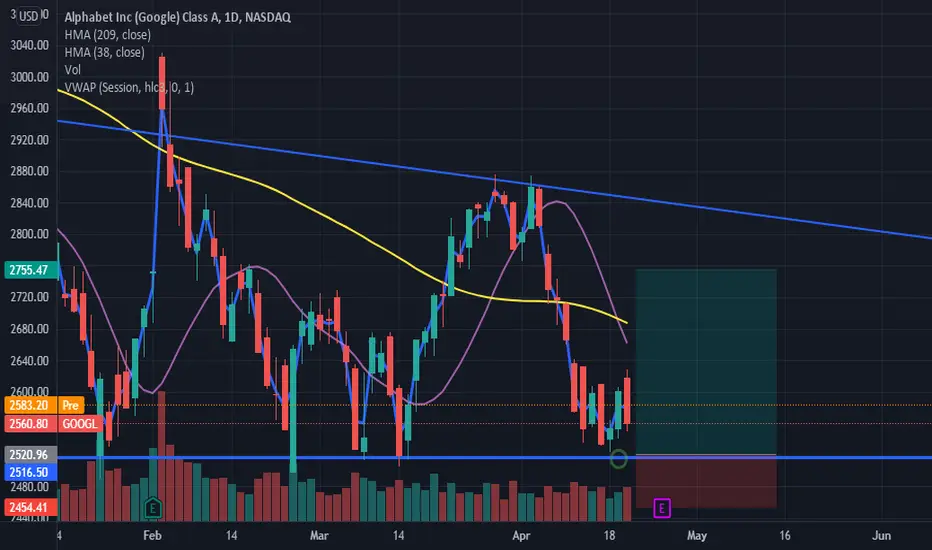
Google Ready to Bounce?Alphabet
Short Term - We look to Buy at 2524.87 (stop at 2472.74)
We look to buy dips. Previous support located at 2500.00. The medium term bias remains bullish. Although this gives the medium term bias a mild bearish edge, we expect intraday trading to continue to be mixed and volatile. Trading close to the psychological 2500.00 level.
Our profit targets will be 2677.46 and 2826.06
Resistance: 2700.00 / 2850.00 / 3000.00
Support: 2500.00 / 2400.00 / 2220.00
Disclaimer – Saxo Bank Group. Please be reminded – you alone are responsible for your trading – both gains and losses. There is a very high degree of risk involved in trading. The technical analysis, like any and all indicators, strategies, columns, articles and other features accessible on/though this site (including those from Signal Centre) are for informational purposes only and should not be construed as investment advice by you. Such technical analysis are believed to be obtained from sources believed to be reliable, but not warrant their respective completeness or accuracy, or warrant any results from the use of the information. Your use of the technical analysis, as would also your use of any and all mentioned indicators, strategies, columns, articles and all other features, is entirely at your own risk and it is your sole responsibility to evaluate the accuracy, completeness and usefulness (including suitability) of the information. You should assess the risk of any trade with your financial adviser and make your own independent decision(s) regarding any tradable products which may be the subject matter of the technical analysis or any of the said indicators, strategies, columns, articles and all other features.
Please also be reminded that if despite the above, any of the said technical analysis (or any of the said indicators, strategies, columns, articles and other features accessible on/through this site) is found to be advisory or a recommendation; and not merely informational in nature, the same is in any event provided with the intention of being for general circulation and availability only. As such it is not intended to and does not form part of any offer or recommendation directed at you specifically, or have any regard to the investment objectives, financial situation or needs of yourself or any other specific person. Before committing to a trade or investment therefore, please seek advice from a financial or other professional adviser regarding the suitability of the product for you and (where available) read the relevant product offer/description documents, including the risk disclosures. If you do not wish to seek such financial advice, please still exercise your mind and consider carefully whether the product is suitable for you because you alone remain responsible for your trading – both gains and losses.

GOOGL wait for breakdown 2490GOOGL wait for the price level 2490 and it is a good entry to May's short

GOOGLE BUY- on the weekly chart : a hard dive down in the past few weeks back to the level of resistance
- on the daily chart : the price been moving down with steady a strong movements as we can see in those red candles but as we can notice in the past 3 days , a green candle warning us about the lost of selling pressure
- on the 15 min chart : a breaking of the VWAP upwards early this morning confirm the lost of selling pressure
- personal opinion : the lost of selling pressure might be a warning that the big players are getting ready to take their profits, i give it a 85% that in the next few days the price will know a strong climb upwords
- best move : wait until we see a breaking of the VWAP on the 15 min chart tomorrow . when that happens open a position as a buyer and dont sell until it reachs the upper level
contact me if you want me to keep an eye and update you daily on a stock/crypto/forex/future.... of your choice

We study the possible supports of Google.Google
The current price fails to break $ 3,000 with a decreasing high of 1 week.
We study the possible supports of Google.
S1 $ 2,400
S3 $ 2'100
S3 $ 1,800
S4 $ 1,550 / $ 1,300
(Maxi support pre Covid Crisis 2020)
what will be the springboard support for Google?
For information contact us privately.
Lpi.sa

Beginning of an End!Rising so many competetors in EV market kills TESLA's profitability, add it on its CEO's recent political activities....
_ Don't buy it more than $700.

Google's (GOOG) Support and Resistance Lines In this map we are seeing consecutively google stock has went up after hitting support lines. The same pattern is for resistance lines. In these terms Google's stock is close to current resistance lines. That being said there's room for a jump in stock price. The overall prediction is that this stock will be falling into support lines within the next few months.

GOOGL ShortIm bearish on GOOGL, 3 tops and 3 bottoms logged.
....
Market direction is indecisive.
Until Russia signs diplomacy things will get better.
This war will cost us a recession if we don't stop it now...
Rsi crossing downwards..
Market Cap increasing and trend line broken upwards. Not exactly sure what the cause might be for this.
