Google - Fantastic Bullish Break And Retest!Google ( NASDAQ:GOOGL ) just looks amazing:
Click chart above to see the detailed analysis👆🏻
For more than a decade, Google has been trading in a rising channel formation, perfectly respecting all market structure. Now, Google is about to retest the previous all time high once again and with a sharp correction of about -25%, this offers a significant bullish reversal setup.
Levels to watch: $150
Keep your long term vision,
Philip (BasicTrading)

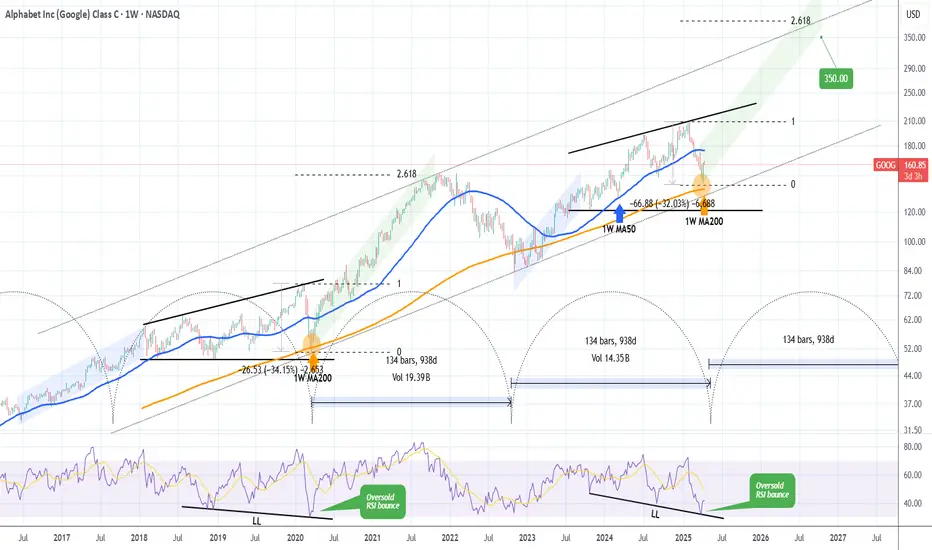
GOOGLE's generational bottom made. This is how it reaches $350.Alphabet Inc. (GOOG) almost tested last week its 1W MA200 (orange trend-line). That level has been holding for more than 2 years (since March 13 2023) and it's been the main Support of the Bull Cycle that followed the November 2022 Inflation Crisis bottom.
The pattern is almost like the Ascending Triangle that led to the March 2020 COVID crash, which was the most recent time before the late 2022 bottom that the stock made contact with the 1W MA200. As you realize, all those times have been what we call 'generational bottoms', thus extremely good long-term buy opportunities. And as you see they've been on extremely tight time symmetry, all took place roughly every 2.5 years.
If the pattern continues to repeat itself, then we may witness a rally (green Channel Up) similar to the one that peaked on November 2021 and reached the 2.618 Fibonacci extension. As a result, setting a $350 Target would be more than realistic based on this pattern.
-------------------------------------------------------------------------------
** Please LIKE 👍, FOLLOW ✅, SHARE 🙌 and COMMENT ✍ if you enjoy this idea! Also share your ideas and charts in the comments section below! This is best way to keep it relevant, support us, keep the content here free and allow the idea to reach as many people as possible. **
-------------------------------------------------------------------------------
💸💸💸💸💸💸
👇 👇 👇 👇 👇 👇
Can Efficiency Topple AI's Titans?Google has strategically entered the next phase of the AI hardware competition with Ironwood, its seventh-generation Tensor Processing Unit (TPU). Moving beyond general-purpose AI acceleration, Google specifically engineered Ironwood for inference – the critical task of running trained AI models at scale. This deliberate focus signals a Major bet on the "age of inference," where the cost and efficiency of deploying AI, rather than just training it, become dominant factors for enterprise adoption and profitability, positioning Google directly against incumbents NVIDIA and Intel.
Ironwood delivers substantial advancements in both raw computing power and, critically, energy efficiency. Its most potent competitive feature may be its enhanced performance-per-watt, boasting impressive teraflops and significantly increased memory bandwidth compared to its predecessor. Google claims nearly double the efficiency of its previous generation, addressing the crucial operational challenges of power consumption and cost in large-scale AI deployments. This efficiency drive, coupled with Google's decade-long vertical integration in designing its TPUs, creates a tightly optimized hardware-software stack potentially offering significant advantages in total cost of ownership.
By concentrating on inference efficiency and leveraging its integrated ecosystem, encompassing networking, storage, and software like the Pathways runtime, Google aims to carve out a significant share of the AI accelerator market. Ironwood is presented not merely as a chip, but as the engine for Google's advanced models like Gemini and the foundation for a future of complex, multi-agent AI systems. This comprehensive strategy directly challenges the established dominance of NVIDIA and the growing AI aspirations of Intel, suggesting the battle for AI infrastructure leadership is intensifying around the economics of deployment.

SPX WEEKLY 7TH APRIL 2025Welcome to SPX weekly. I have deeply discussed the price action here. If you have any doubts, feel free to leave a message or comment below.
NOTE:DO NOT SHORT

Thoughts on US equities. Not looking good at all. Expecting more sellside distribution on US equities. We need to go towards any discount levels

OptionsMastery: Looks like a good buy on GOOGLE!🔉Sound on!🔉
📣Make sure to watch fullscreen!📣
Thank you as always for watching my videos. I hope that you learned something very educational! Please feel free to like, share, and comment on this post. Remember only risk what you are willing to lose. Trading is very risky but it can change your life!

The analysis focuses on the short-term to medium-term timeframe.The analysis focuses on the short-term to medium-term timeframe.
Tug-of-War Between Bulls and Bears: At the current price of 157.04, the market is in a tug-of-war between buyers (bulls) and sellers (bears).
Bulls are defending key support levels near 152.48 (Fibonacci 100% retracement of Wave C) and 154.34 (Expanded Flat target). A hold above these levels could signal a potential reversal.
Bears are attacking resistance levels at 160.31 (Fibonacci 100% projection of Wave C) and 162.82 (Expanded Flat target). A break below 152.48 could accelerate downward momentum.
Recent Price History: The market has been in a downtrend recently, with the price dropping from 191.18 (July 10, 2024) to 157.04. Key Fibonacci levels (e.g., 161.8% retracement at 159.84) and Elliott Wave patterns (e.g., Diagonal Ending Downward Candidate) have guided this decline. Momentum indicators (e.g., RSI at 47.51) suggest the downtrend may be losing steam, but the MACD histogram turning positive hints at a potential short-term bounce.
Current Sentiment (Technical & News):
Technical Indicators: Mixed signals. RSI (47.51) is neutral, while MACD shows a bullish crossover (histogram turning positive). The price is below key moving averages (e.g., 200-day SMA at 167.35), indicating a bearish bias.
News Sentiment: Mixed to slightly negative. Ad revenue pressures and regulatory risks weigh on sentiment, but long-term growth catalysts (AI, cloud) provide optimism. Analysts maintain a "Buy" rating despite near-term challenges.
Synthesis: The technical picture aligns with the news—short-term bearishness (price below MAs, ad revenue concerns) but potential for a reversal if support holds (undervaluation, bullish MACD).
Key Levels & Momentum:
The price is currently below the 50-day SMA (161.89) and 200-day SMA (167.35), signaling bearish dominance.
Momentum is fading (RSI neutral, Stochastic not oversold), but the MACD histogram suggests a possible short-term bounce.
2. Elliott Wave Analysis (Contextualized to Current Price)
Relevant Elliott Wave Patterns:
Diagonal Ending Downward Candidate (Valid): Suggests the downtrend may be nearing completion, with Wave 5 potentially ending near 152.48-154.34 (Fibonacci 100% projection).
Expanded Flat Upward Candidate (Potentially Valid): If the price holds above 152.48, this pattern could signal a corrective rally toward 162.82.
Wave Count vs. Indicators/Sentiment:
The Diagonal Ending pattern contradicts the bearish news sentiment but aligns with oversold technicals (RSI, MACD). This divergence suggests a potential reversal if support holds.
The Expanded Flat pattern would confirm a bullish reversal if the price breaks above 160.31.
Near-Term Projections:
Downside: A break below 152.48 could extend losses to 148.36 (161.8% Fibonacci projection).
Upside: A hold above 152.48 and break above 160.31 could target 162.82 (Expanded Flat target) and 167.35 (200-day SMA).
3. Strategy Derivation (Realistic, Actionable NOW, News Considered)
Primary Strategy: WAIT (due to conflicting signals).
Why Wait? The technical setup is mixed (bullish MACD vs. bearish MAs), and news sentiment is neutral-to-negative. The upcoming Q1 earnings could add volatility.
If Price Holds Support (152.48-154.34):
BUY with confirmation (e.g., break above 160.31).
Entry Zone: 154.34-156.13 (Fibonacci 78.6% retracement).
Stop-Loss: 151.44 (below recent low).
Take Profit: TP1 at 160.31 (Fibonacci 100%), TP2 at 162.82 (Expanded Flat target).
Risk/Reward: ~1:2 for TP1.
If Price Breaks Below Support (152.48):
SELL with confirmation (e.g., break below 150.06).
Entry Zone: 152.48-151.44.
Stop-Loss: 154.34 (above support).
Take Profit: TP1 at 148.36 (161.8% Fibonacci), TP2 at 145.90 (Wave 5 projection).
News Context Check:
Earnings uncertainty and ad revenue pressures favor caution. Reduce position size if trading.
4. Trade Setup (Actionable, Realistic, News Aware)
Direction: WAIT (watch key levels).
Key Levels to Watch:
Upside: 160.31 (breakout confirmation).
Downside: 152.48 (breakdown confirmation).
News Reminder: Be mindful of Q1 earnings and ad revenue trends.
5. Summary Section
✅ Investor / Long-Term Holder Summary:
Key Support: 152.48 (accumulation zone if held).
Long-Term Outlook: Undervalued (DCF: $260 vs. $157). Focus on AI/cloud growth.
Action: Wait for pullback to 152.48 or break above 167.35 (200-day SMA).

GOOGL - Elliott Wave Final ShowdownGOOGL has dropped over 27.28% , reaching a minor profit-booking zone. The $150 level serves as a key demand zone, where a potential price reversal could occur. The formation is either expanded flat or a running flat on the daily timeframe chart.
Confirmation is best observed near the lower trendline of the parallel channel. If bearish momentum persists, prices may decline further to the $142-$140 range before a strong rebound. Once the correction ends, the upside targets are $168, $180, and $195.
A new low will form if the previous low is breached. Further research will be uploaded soon.

Alphabet (GOOGL) Stock Hits 2025 LowAlphabet (GOOGL) Stock Hits 2025 Low
As seen on the Alphabet (GOOGL) stock chart, the price has dropped close to $156—a level not seen since September 2024.
Since the start of 2025, the stock has fallen by more than 18%.
Why Is GOOGL Falling?
As mentioned earlier today, overall market sentiment remains bearish due to the White House’s tariff policies.
For Alphabet (GOOGL), the situation has worsened today due to the following developments (as reported by the media):
➝ Google has admitted liability and agreed to pay $100 million in cash to settle a US class-action lawsuit accusing the company of overcharging advertisers, according to Reuters. Alphabet shares dropped 4.4%.
➝ Google’s division was found guilty of anti-competitive behaviour in India related to its app store billing system.
Technical Analysis of Alphabet (GOOGL)
In February, we noted investors’ negative reaction to the company’s earnings report, which led to a bearish gap (marked by a red arrow).
Since then, bears have maintained control, pushing the price below the lower boundary of the ascending channel that had been valid since 2023. Key signals include:
➝ The $170 level (near the bearish gap on 10 March) acted as resistance on 25 March.
➝ Bears showed little reaction to bulls at the $160 level and have kept the price contained between two downward-sloping red lines.
Bears may now be targeting the psychological level of $150. If bulls want to maintain control over GOOGL’s long-term uptrend, they need to take action soon.
This article represents the opinion of the Companies operating under the FXOpen brand only. It is not to be construed as an offer, solicitation, or recommendation with respect to products and services provided by the Companies operating under the FXOpen brand, nor is it to be considered financial advice.

GOOGLE Bottom confirmed. Laying eyes on $220.Alphabet Inc. (GOOG) has been trading within a Channel Up since the July 10 2024 High. Last week, the Bearish Leg touched the pattern's bottom, completing a -23.92% decline from the top, which is almost symmetrical to the previous Bearish Leg (-23.32%).
At the same time the 1D RSI got oversold (<30.00) and recovered on a Bullish Divergence, while the 1D MA50 (blue trend-line) crossed below the 1D MA100 (green trend-line), forming a Bearish Cross. Last time we had this formation was September 06 2024 and 1 day later, the bottom (Higher Low of the Channel Up) was formed.
Among all this, the 1W MA100 (red trend-line) is holding, which is the market's long-term Support since July 12 2023. As a result, we expect the new Bullish Leg to start and as the previous one did, target the 1.236 Fibonacci extension at $220.00.
-------------------------------------------------------------------------------
** Please LIKE 👍, FOLLOW ✅, SHARE 🙌 and COMMENT ✍ if you enjoy this idea! Also share your ideas and charts in the comments section below! This is best way to keep it relevant, support us, keep the content here free and allow the idea to reach as many people as possible. **
-------------------------------------------------------------------------------
💸💸💸💸💸💸
👇 👇 👇 👇 👇 👇

U.S. Big Tech 10 (NYSE FANG+) Index. Another Day. Another DollarThe remarkable performance of U.S. large cap equities in the past two years was closely tied to the dominance of tech-related sectors, exemplified by companies akin to those in the high-performing NYSE FANG+ Index ICEUS:NYFANG .
The NYSE FANG+ Index (“Index”), also known as the NYSE U.S. Big Tech 10 Index, is a rules-based, equal-weighted equity benchmark designed to track the performance of 10 highly-traded growth stocks of technology and tech-enabled companies in the technology, media & communications and consumer discretionary sectors.
The Index undergoes a reconstitution quarterly after the close of the third Friday in March, June, September and December (the “Effective Date”).
The NYSE FANG+ Index provides exposure to 10 of today’s highly-traded tech giants
Access the index through a futures and options contract designed to help you increase or reduce exposure to this key group of growth stocks in a capital-efficient manner.
Ten constituents of The U.S. Big Tech 10 (NYSE FANG+) Index as of Friday, December 9,
2022 (10% equal weighting):
Meta NASDAQ:META
Apple NASDAQ:AAPL
Amazon NASDAQ:AMZN
Netflix NASDAQ:NFLX
Microsoft NASDAQ:MSFT
Google NASDAQ:GOOGL
Tesla NASDAQ:TSLA
NVIDIA NASDAQ:NVDA
Snowflake NYSE:SNOW
Advanced Micro Devices NASDAQ:AMD
The main technical weekly graph indicates The U.S. Big Tech 10 (NYSE FANG+) Index remains aboму 200-day SMA (so far), following the upside path that has been taken in early 2023 after 50 percent decline in 2022.
--
Best wishes,
@PandorraResearch Team

GOOGL: Bullish Bounce Before a Bigger Drop? Here's My RoadmapGoogle NASDAQ:GOOG NASDAQ:GOOGL is shaping up to look bullish in the short term, and I believe that in the next few weeks to months, we could see a solid upside move - before things could turn ugly again later on. Let me explain why.
Big picture: we’re currently in a Wave (2) corrective structure, which is playing out as a complex WXY correction (marked in orange). This type of correction follows a 3-3-3 wave pattern, and everything we’ve seen so far fits that structure. Since the top in February, NASDAQ:GOOGL has dropped around 24% , which is significant - but also not unexpected within this context.
What’s interesting now is that we’ve just printed a bullish divergence on the RSI for the first time in this move down. That’s the first green flag. The second? The lower wick, which I currently mark as sub-wave ((a)) has been very well respected so far. That’s the second sign that this could be the turning point - at least temporarily.
I’m expecting a move up in the coming weeks toward the 2024 VAH, around $178, where we could see a first rejection. From there, the price should continue higher in a 3-wave structure toward Wave ((b)), likely reaching between $187.80 and $196.30 (the 61.8% to 78.6% retracement zone).
But let’s be clear: this is not the start of a new bullish trend. After Wave ((b)), I expect a 5-wave move to the downside, completing Wave ((c)) - and that means lower prices ahead , potentially in Q3, Q4 2025 or even into 2026.
Until then, I’m keeping a close eye on this structure. As long as the current Wave ((a)) low holds, this short-term bullish scenario remains valid. If we get a strong breakout in the coming days / weeks, I’ll be looking to enter on a retest, targeting that $187.80–$196.28 zone.
Let’s see if the market plays it my way.
Make sure to follow me for future updates on this scenario and other setups !

Goog make or break trendlineDid you know this market geometry/symmetry:
When a (strong) trendline is broken, the market will fall equal distance or more from the trendline as from the peak to the breakpoint.
If google breaks (or has it?) it could fall another 20% and meet the long term trendline, if doesnt then the recent breakpoint would
become resistance

Sabah Research Goes Long on Google: EW 2.0 Signals 45% Upside !Sabah Equity Research is taking a bullish stance on Alphabet (GOOGL) as Elliott Wave 2.0 suggests a 45% upside from current levels. With the stock trading at an attractive valuation, this presents a strong opportunity for long-term investors.
Elliott Wave 2.0 Predicts the Next Leg Up
After completing a healthy ABC correction, Alphabet is now primed for a Wave 3 expansion, historically the most powerful phase in the Elliott cycle. The technicals suggest that GOOGL’s recent consolidation is a launchpad for the next move higher.
Catalysts for Growth
Massive Cybersecurity Acquisition
Google’s parent company, Alphabet, is set to acquire Wiz, a leading cloud security firm, for over $30 billion—its largest deal ever. This strengthens Google’s cloud security dominance and accelerates revenue growth.
Undervalued Growth Potential
Despite its leading position in AI, cloud computing, and search, Alphabet trades at a discount compared to peers. This disconnect presents a compelling buying opportunity before sentiment catches up.
AI and Cloud Expansion
Google’s aggressive push into AI and cloud services positions it for massive future gains. With rising demand for AI-driven search, advertising, and enterprise solutions, Alphabet’s growth runway remains robust.
The Trade Setup: Positioning for the Upside
With Elliott Wave 2.0 pointing to a 45% rally, Sabah Equity Research sees Alphabet as a strong long-term play. The combination of cheap valuation, a game-changing acquisition, and a favorable technical setup makes this an ideal entry point.
Smart money is accumulating—will you? 🚀

Google -GOOG at a critical junctureGoogle -GOOG at a critical juncture
If this asset breaks above the trendline sustainably, I will expect this asset to push further to the north.
The TL will become support level and my SL will be below the TL as shown on my chart.
Trade with care
GOOGL ON SUPPORT: 23% BOUNCE IMMINENTNASDAQ:GOOGL GOOGL has consolidated significantly over the last few weeks and, like the NASDAQ, has also taken a beating. Due to the now attractive valuation, the continued stable growth and earnings growth, GOOGL is still a good investment.
Technically, we have reached a trend line and a weaker horizontal support with a further support area at around USD 150. We are already seeing the first RSI divergence. The Bollinger Bands (not shown in the chart, otherwise it would be confusing) are also far overstretched and make a bounce likely. There is also an open gap at $192 - $203.
I would open about 50% of the actual trading position now and the rest when the price falls into the green box, which I still consider to be a possible consolidation area. If the price turns immediately, we are still in with half.
Target Zones:
$192.00
$205.00
Support Zones:
$165.00
$150.00

Alphabet Stock (GOOGL): Bounce Incoming?There is growing potential that a major price top has formed, particularly after the break below the November low, which has increased the probability of this scenario. The move down from the February high appears to be a three-wave structure, and I am watching for a bounce from the current region. However, this could simply be a B-wave in the yellow scenario, setting up for much lower prices.
At this stage, it's too early to confirm a major top with certainty. The structure of the next rally will provide crucial insights. The current downward move is not yet a clear five-wave decline, leaving the door open for higher prices in the white scenario. However, even that becomes increasingly unlikely with a break below $157.50.
For now, the working thesis is that a major top has formed, but confirmation of new highs would only come with a break above $196.69. In the short term, the price should ideally react to the current region, but we need to see a break above $173 (closing the last gap) to indicate a local low is in place. If that happens, we could be in a B-wave, which would likely target the $183 to $196 zone before the next major decision point.

GOOGL upside potentialTechnicals
GOOGL has yet to close below a major trendline, indicating potential continuation of the uptrend.
Fair Value Gap (FVG) Target: There is an inefficiency in price that could act as a magnet for an upward move. If buyers step in at support, the next target will be filling this gap.
Fundamentals
Revenue Growth: Q4 2024 revenue came in at $96.5 billion (+12% YoY), driven by strength in Search, YouTube Ads, and Google Cloud.
AI Investments: Alphabet plans to invest $75 billion in AI infrastructure this year, boosting its competitive edge.
Profitability: Operating income rose 33% YoY, with improving margins (32%).
Market Rotation: Strong institutional interest in mega-cap tech stocks supports potential upside.

The only tech stock I’d consider buying right nowThis analysis is provided by Eden Bradfeld at BlackBull Research.
We’ve seen the S&P, NASDAQ and every other American index get slammed in the last couple of days. Some people are panicking. A lot of people are panicking. If you go on Twitter (sorry — X dot com) you will find a lot of people who listened to a recommendation from a guy on YouTube about a trash stock like say, IonQ or HIMS, and are now fairly upset said YouTube guy (or Twitch guy, or whatever) got it wrong.
Frankly, a correction is a healthy thing because it allows investors to purchase good companies at more reasonable multiples.
I have no idea where the market goes from here. I can’t see the future. I admit this sell-off has me adding tech stocks (and other American stocks) to my watch-list, and I’ll continue to monitor them.
A lot of tech stocks — the bulk of what has fallen as of late — still aren’t in that zone for me yet. Amazon still trades at a current multiple of 35x earnings and a fwd multiple of 28x — I can’t find much value in that, especially when I consider that Google, a company with +$83 billion in net profit and a 32% operating margin, can be acquired for 16x fwd earnings (I had to check those numbers too just to be sure — when you’ve still got things like Palantir trading “to the moon” (and back), 16x⁴ seems like a reasonable price for the dominant advertising platform in the world).
Here’s Buffett, in his 2008 essay — Buy American, I am:
A simple rule dictates my buying: Be fearful when others are greedy, and be greedy when others are fearful. And most certainly, fear is now widespread, gripping even seasoned investors. To be sure, investors are right to be wary of highly leveraged entities or businesses in weak competitive positions. But fears regarding the long-term prosperity of the nation’s many sound companies make no sense. These businesses will indeed suffer earnings hiccups, as they always have. But most major companies will be setting new profit records 5, 10 and 20 years from now.
Buffett was right, of course. If you purchased stocks in 2008 and held them you would’ve done pretty well (as long as you didn’t buy Lehman Brothers!). The GFC saw stocks fall 48% from their peak — if we are indeed heading towards that territory there is more room to fall. I have no idea — examining the basket of tech stocks I look at, the only one that presents any value is Google. It’s reasonable at 16x fwd earnings. If it traded at 12x earnings, it would be a bargain - in my opinion. How low can you go?

Google Update - Trade this range and new ATH Identified Update video on the google Long that has been planned since early FEB. The level has now been hit and we got a nice reaction off that level . In this video I look into where I think we go next and how price plays out .
In the video I use the following tools TR Pocket FIB , 0.618 FIB , Pivots , Parallel Channel and the Fixed range Vol Profile.
If we stay range bound inside the channel then we have the potential to see a new high on google at the top of the channel in confluence with 1-1 ext + tr pocket expansion .
Watch the video and mark the levels on your chart and ensure to set your alerts .
Dont forget to Boost the chart Please and i welcome any questions TY

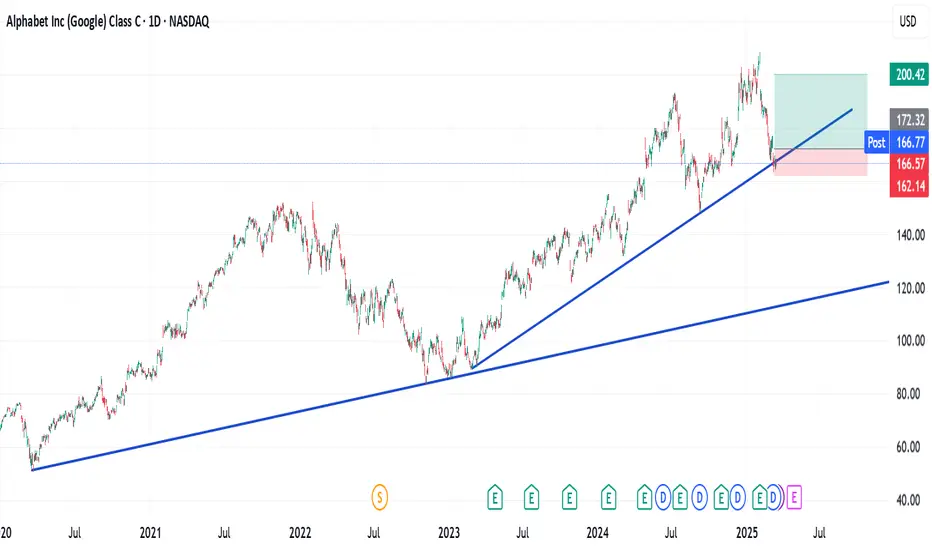
Alphabet Inc. (GOOGL) – Bullish Reversal Opportunity📉 Google stock has corrected ~16.9% from its $207 high last month, now testing a strong trendline support.
With bullish RSI divergence and major AI investments ahead, this could be a prime buy-the-dip opportunity!
📊 Trade Setup:
🔹 Entry Price: $171.80 (Current Price)
✅ Take Profit 1: $190 (Short-term resistance)
✅ Take Profit 2: $207 (Previous high)
✅ Take Profit 3: $220+ (Analyst average price target)
🔹 Stop-Loss: $165 (Below trendline)
🔹 RSI: Bullish divergence – signaling potential upside momentum
📈 Why Google?
AI & Cloud Expansion – $59B AI revenue expected by 2028 (Morgan Stanley)
Waymo Growth – Autonomous vehicle expansion into Miami (2026)
YouTube & Digital Ads – Performance Max driving revenue gains
Strong Cloud Business – Competing with AWS & Microsoft Azure
🔹 Analyst Insights:
Average Price Target: $210.62, implying a 23.66% upside from the current price.
High Price Target: $250.00, suggesting significant growth potential.
Consensus Rating: Moderate Buy based on evaluations from 43 analysts.
🔹 Regulatory Caution: DOJ lawsuits are a concern, but long-term AI & cloud growth remain strong.
📌 Key Levels to Watch:
Holding support at $165? This could trigger a major upside move.
Break above $190? Momentum could accelerate toward $207+
📢 Google is not just a search company—it’s an AI, cloud, and automation powerhouse. With strong support, favorable analyst forecasts, & major catalysts ahead, this could be a prime accumulation zone! 🚀

Google is going to its Google thing. Bullish 4hHistorical severely oversold area.
Welcome to the MAX PAIN (looking at the greed&Fear at 11 today)
At this max fear stage it’s hard for the herd to see wood for the trees and things also the perfect phase to pickup a contrarian play.
👇
🔹 **Trade Direction:** Long (Potential Reversal)
🔹 **Entry:** $170 - $173 (Current Zone)
🔹 **Stop Loss:** $165 (below recent support)
🔹 **Target 1:** $182 (key resistance level)
🔹 **Target 2:** $192.50 (prior swing high)
📊 **Probability & Justification:**
- **Momentum Shift:** Oversold conditions with multiple strong buy signals across timeframes.
- **Indicators:** Stochastic RSI deeply oversold, with RSI on daily at 27.16—historically near bounce zones.
- **Moving Averages:** Price trading below key moving averages but stabilizing.
- **Volume Profile:** Signs of potential accumulation; need confirmation.
⚠️ **Risk Considerations:**
- A breakdown below $165 invalidates the setup.
- Bearish sentiment still dominant; a confirmed higher low is needed.
- Strong resistance ahead at $182; partial profit-taking recommended.
📉 **Bias:** Cautiously bullish—confirmation required for trend shift.

Google Likely On SupportGOOGL is likely finding support on $174. It's following the panic trend right now as almost everything Computer/Tech has been sold deep into support bids. GOOGL finding support here along with AMZN at $214 leads to my theory IXIC is ready to break resistance.
If it fails to hold $174, then the major support at $148 should lift it back up towards it's final target (or next major support) of $252.
Good luck!
