S&P 500 index Rising wedgeS&P 500 is forming a rising wedge which will be a nasty drop in all markets if it plays out. I will be looking to buy the dip, but im going to wait till I see a proper bottom forming. With covid, all the money printing and the general boom we have seen in the market lately, a correction is due (might even see a flash crash).
This may also affect the crypto market

PRE presearch google alternative Thought ProcessPRE presearch google alternative Thought Process on Possible Price Action.
This video shows my thought process on how I think PRE will move
this is for entertainment only - not financial advice

PRE presearch google alternative Thought Process on Possible ...PRE presearch google alternative Thought Process on Possible Price Action.
This video shows my thought process on how I think PRE will move
this is for entertainment only - not financial advice

GOOG sold by ARK InvestOn October 20, ARKQ, part of the Ark invest fund lead be Cathie Wood sold 1,858 shares of GOOG, for a total value of 0.2031 of its portfolio.
Most of the time, when Ark starts a sell, it tends to continue it for multiple days.
Was this the top for Alphabet?
My price target is the 2700usd support.
I`m looking forward to read your opinion about it.

Google - Tech - 10 Year NoteVolatility in the notes (10Y @ 1.66) showed-up as a pause day for growth tech. With earnings one week away, a melt-up would benefit from resistance in the bonds.


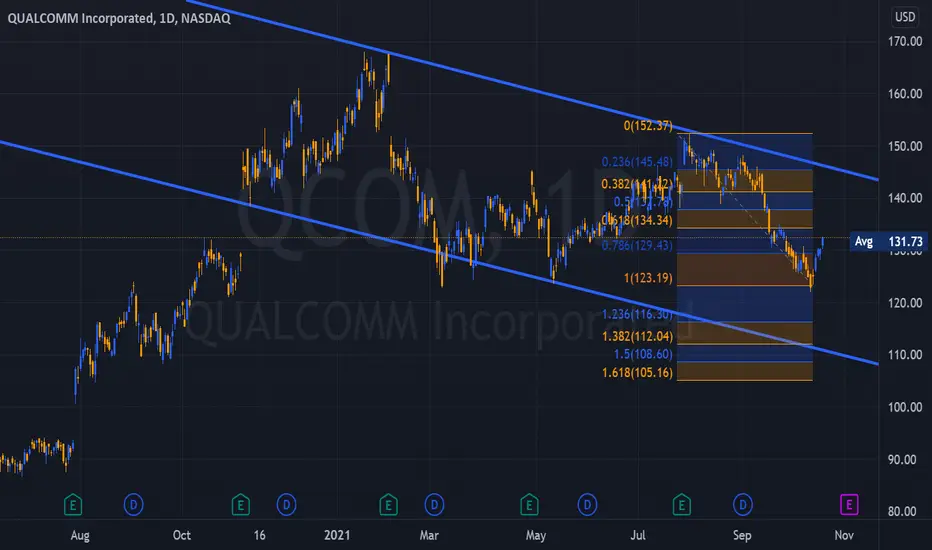
QCOM - First Apple, Now GOOGLEGoogle chose Samsung to partner in the Exynos Extension - the Tensor.
While Exynos has had its detractors over the years, with good reason, the Tensor is an
entirely new beast.
No Taiwanese Manu is required, South Korea is safer.
Another number of Nails in the QOCM coffin.
Google is going to capture large amounts of Market share from everyone - Including the iMob.
The phones are, IMHO, quite nice in appearance and performance.
Integration is the Key.
No other TECH company on the planet can match Google.
They are finally, fully committed to entering the market and their new Flagship... it is a remarkable
piece for Kit @ $899, well below its competitors.
The combination of exceptional Software and Solid, robust hardware, will provide an experience
unlike any other. Mid-Band 5G will rip as T-Mobile finally begins to integrate the Licenses from their
merger with Sprint.
The Pixel 6 is the world's first truly international Smart Phone and seamless carrier switching the
competition lacks and will for a period of time.
QCOM will continue to lose Market Share, their attempt to enter the Smart Phone Market was less
than spectacular.
Our strategy is to build a Put Calendar spread in QCOM from 140 to 150.
We believe QCOM will be moving far lower in Price as Google gains immense Market share with the
introduction of the Pixel 6 and Pixel 6 Pro.
I'm watching the Google Pixel Live Stream and am impressed with a very Non-Apple presentation.
Believe this to be a Game Changer with QCOM in the 90s once again - HK
Google - Inverse ConfirmedFound resistance above the .236 Break Target. Setting up a Doji above support as the market takes a moment to regroup.
*Correction" Earnings for Google is Tuesday October 26th.

SPX 500 analysisI posted a graph on a higher timeframe before we had a decent drop in all markets:
And I still stand by that, but on the lower timeframe, I see a falling wedge forming. The price action indicates to me that we are going to break up sooner rather than later, so this yellow arrow I have on my chart is somewhat what I expect :)

GOOG - 2nd Neckline TestMSFT catalyst, FB recovery, TSLA parabolic - - GOOG inverse set-up, earnings Nov 4th, 2021

GOOG - Neckline Back TestGOOG found support at the pattern break level and held stable after yesterday's push-up.


Google - DailyIf the 61.8% retracement holds up at the support, a good chance that this will continue upwards.
Will be watching this stock in case this does hold.
We have an interesting week next week for fundamentals / news.

Google - WeeklyThis one is a slow mover, it has been bullish ever since its listing.
Any pullback I would expect to be sudden and fast.
Overall it makes sense for this to continue going up, no point trying to guess for a reversal.
The last resistance could make for a break and retest to continue going up.

GOOGLE - Monthly ChartEngulfing candle on the previous close, any significance will be confirmed on the weekly.

Do you think the "Google Mania" will keep going up? Today we will take a look at GOOGL.
a) Since the bottom of the 2020 pandemic, the price has been on a major rally, gaining more than 150%
b) The basic formations we have been observing are corrective structures ranging from 25 to 40 days before new impulses coming.
c) Currently, we can see a new corrective pattern above the broken ascending channel.
d) If the pattern we have been observing keeps working as in the past, then this should be another situation where a bullish resolution may come.
e) What are our filters? First, the green horizontal line, we will ONLY consider this view as active if the price reaches that level.
f) The invalidation level will be below the current corrective structure. (2600.00)
g) To define targets, we have used Fibo Extensions; we have two levels that can be used as take-profit zones.
h) Based on previous behavior, we can expect a resolution between 100 and 150 days.
Thanks for reading!

Law of vibration - GOOGLESell zone is marked.
I expect support on the green fan or on the blue.
Elliot waves traders will probably see an ABC in it? I do not know, tell me in the comments

Google, 7 OCT - Elliott waves | Gann | Astrology $GOOGAlphabet, as expected, bounced off the 20 week MA (in red), and we closed longs at Gann level 2651. But the count hints at more downside in the mid-term.
Since the ATH, price declined in ABC patterns, so that we can assume a WXY or a complex ABC is unfolding.
If correct, sellers may step in at the 20D MA again. A possible area is the blue box (.618 to .786 Fib).
Ascendant conjuncts natal Jupiter on 9 OCT. The following trading days 11-12 OCT have higher probability for bearish price action. We may watch out for an expansion of volatility again. A short idea could be interesting at that point, however needs further confirmation.
______________
www.constellations.trade
In my analyses I combine Elliott waves, Gann theory, and planetary aspects to identify turning points in the markets & derive high-probability trading ideas. The strategy is to build leveraged exposure when markets are likely to expand, and to use options premium decay for consistent income when markets may contract and range.
Open an account here if you'd like to support my work:
TastyTrade
America's best Options, Futures and Crypto broker
start.tastyworks.com
Deribit
The world's most liquid Bitcoin options platform
www.deribit.com
Binance
10% off trading fees with this link:
accounts.binance.me
These abbreviations in the chart describe ideas that are provided as educational information and do not constitute financial advice:
STO = sell to open
BTC = buy to close
BTO = buy to open
STC = sell to close
TD = Theta Decay (for example a strangle or iron condor)
Disclaimer:
The views and ideas expressed in this analysis are that of the maker. They are provided as educational information and do not constitute financial or trading advice.

GOOG - Google buy zones ... long term.Global long Term
Green zone - BUY IN1
Green zone - BUY IN2
Red Line - Stop Loss ( Trigger ! )

GOOGLE Alphabet | Fundamental Analysis + NEXT TARGET Alphabet, the parent company of Google, is one of the largest technology businesses in the world. If you had invested $1,000 in the company's IPO back then, your investment would be worth about $63,500 today.
That's great news for early investors, but those who don't already own Alphabet may wonder if it's too late to buy stock in this FAANG company. Today we'll look at a few convincing judgments to buy Alphabet, as well as one reason to sell it, to see if it's still a good long-term investment.
First, the company is a powerful energy in online advertising.
Alphabet's expansive ecosystem includes the world's most popular search engine, a mobile operating system (Android), a streaming video site (YouTube), a Web browser (Chrome), and an e-mail platform (Gmail).
All of these platforms support Google's core advertising business, which sells search, display, and video ads on all of its platforms. According to eMarketer, Google is likely to account for 28.6 percent of all digital ad spending worldwide this year, putting it in the first place, ahead of Facebook's 25.2 percent.
All of Google's smaller competitors and Facebook - such as Alibaba, Amazon, and Tencent Holdings - still hold single-digit shares of the digital advertising market. So any business looking to advertise online is likely to visit Google and Facebook before considering other platforms.
Last year, Alphabet's ad revenue from Google grew 9% to $146.9 billion, or 80% of the company's total revenue, even though the pandemic caused businesses to buy fewer ads. In the first half of 2021, Google's ad revenue grew 50% year over year to $95.1 billion as the negative factors associated with the pandemic subsided.
Second is the growth of Google Cloud.
Google's advertising business slowed temporarily in 2020, but Google Cloud revenue grew 46% to $13.1 billion as cloud usage accelerated during the pandemic. In the first half of 2021, segment revenues grew another 50% year over year to $8.7 billion.
Google Cloud is not yet profitable, according to Canalys, and it still ranks a distant third in the cloud infrastructure market behind Amazon Web Services (AWS) and Microsoft Azure.
But Google Cloud continues to expand and win over an expanding listing of major partners, including Target, Home Depot, Twitter, and PayPal. Many of these customers probably don't want to support Amazon's most profitable business (as they compete with its retail business) or tie themselves to other Microsoft enterprise services.
Google Cloud's profitability should expand as it improves, but until then it can subsidize its growth with its more profitable advertising business. According to Research and Markets, the global cloud computing market will grow at a compound annual growth rate (CAGR) of 19.1 percent from 2021 to 2028, so Google's cloud business could grow faster than its core advertising business for the foreseeable future.
Third, it's a reasonable valuation of the company.
Analysts expect Alphabet's revenues and profits to grow 37% and 72%, respectively, this year, amid an easy comparison to the impact of the pandemic on the advertising business. Next year, they expect revenues and profits to grow 17% and 5%, respectively, as comparisons with last year normalize.
Based on these expectations, Alphabet is trading at 26 times earnings guidance and 7 times sales guidance, making it more reasonably valued than many of the more "bloated" growth stocks in the tech sector.
But there is still one cause for concern: antitrust risks.
Alphabet's core businesses look strong, but a series of antitrust battles could undermine its growth.
Last October, the U.S. Department of Justice filed an antitrust suit against Google for allegedly monopolizing the online search and search-based advertising market, and is reportedly preparing to file a second antitrust suit to address Google's dominance in certain advertising technologies. Two separate coalitions of states have also filed their lawsuits against Google over its search and advertising business.
The European Commission previously investigated Google Shopping, Google AdSense, and Android, after which it accused Google of using these platforms to drive competitors out of their respective markets. These antitrust investigations led to three separate fines totaling more than $8 billion and forced Google to stop bundling its third-party apps with new Android devices in Europe. If the DOJ case follows a similar path, Google could face even more fines and demands to unbundle its ecosystem.
Google also bears additional antitrust encounters in Australia, India, and South Korea, and more countries may join the process. All of these pressures could prevent investors from paying a higher premium for Alphabet stock.
Alphabet's antitrust problems can't be ignored, but they don't negate its strengths just yet. Alphabet will likely continue to grow, even if fines and new restrictions get in its way.
In a worst-case scenario, Alphabet could be split into several smaller companies. Nevertheless, Alphabet investors would likely get new shares of these smaller companies that could continue to grow on their own without being tied to Google's sprawling ecosystem.

GOOGLE REACCUMULATION!Hello my beauties.
I think Google is completing a phase of reaccumulation, and it might jump above the trading range soon. The arrows do not indicate exact price action, and the trade setup needs to be verified through accurate observation of the developing event in the price action.
If you find this idea to be helpful like, follow, and drop a comment below if you'd want me to analyse a different pair.
Consider supporting me if you think I am providing you with value.
Peace.
Luca, TrickleDownFX

in 15min A high probability of market reversalas the chart showed there is a break in the resistance so it can be return to up
Also the pitchfork gives a good return sign
