Law of vibration - GOOGLESell zone is marked.
I expect support on the green fan or on the blue.
Elliot waves traders will probably see an ABC in it? I do not know, tell me in the comments

Google, 7 OCT - Elliott waves | Gann | Astrology $GOOGAlphabet, as expected, bounced off the 20 week MA (in red), and we closed longs at Gann level 2651. But the count hints at more downside in the mid-term.
Since the ATH, price declined in ABC patterns, so that we can assume a WXY or a complex ABC is unfolding.
If correct, sellers may step in at the 20D MA again. A possible area is the blue box (.618 to .786 Fib).
Ascendant conjuncts natal Jupiter on 9 OCT. The following trading days 11-12 OCT have higher probability for bearish price action. We may watch out for an expansion of volatility again. A short idea could be interesting at that point, however needs further confirmation.
______________
www.constellations.trade
In my analyses I combine Elliott waves, Gann theory, and planetary aspects to identify turning points in the markets & derive high-probability trading ideas. The strategy is to build leveraged exposure when markets are likely to expand, and to use options premium decay for consistent income when markets may contract and range.
Open an account here if you'd like to support my work:
TastyTrade
America's best Options, Futures and Crypto broker
start.tastyworks.com
Deribit
The world's most liquid Bitcoin options platform
www.deribit.com
Binance
10% off trading fees with this link:
accounts.binance.me
These abbreviations in the chart describe ideas that are provided as educational information and do not constitute financial advice:
STO = sell to open
BTC = buy to close
BTO = buy to open
STC = sell to close
TD = Theta Decay (for example a strangle or iron condor)
Disclaimer:
The views and ideas expressed in this analysis are that of the maker. They are provided as educational information and do not constitute financial or trading advice.

GOOG - Google buy zones ... long term.Global long Term
Green zone - BUY IN1
Green zone - BUY IN2
Red Line - Stop Loss ( Trigger ! )

GOOGLE Alphabet | Fundamental Analysis + NEXT TARGET Alphabet, the parent company of Google, is one of the largest technology businesses in the world. If you had invested $1,000 in the company's IPO back then, your investment would be worth about $63,500 today.
That's great news for early investors, but those who don't already own Alphabet may wonder if it's too late to buy stock in this FAANG company. Today we'll look at a few convincing judgments to buy Alphabet, as well as one reason to sell it, to see if it's still a good long-term investment.
First, the company is a powerful energy in online advertising.
Alphabet's expansive ecosystem includes the world's most popular search engine, a mobile operating system (Android), a streaming video site (YouTube), a Web browser (Chrome), and an e-mail platform (Gmail).
All of these platforms support Google's core advertising business, which sells search, display, and video ads on all of its platforms. According to eMarketer, Google is likely to account for 28.6 percent of all digital ad spending worldwide this year, putting it in the first place, ahead of Facebook's 25.2 percent.
All of Google's smaller competitors and Facebook - such as Alibaba, Amazon, and Tencent Holdings - still hold single-digit shares of the digital advertising market. So any business looking to advertise online is likely to visit Google and Facebook before considering other platforms.
Last year, Alphabet's ad revenue from Google grew 9% to $146.9 billion, or 80% of the company's total revenue, even though the pandemic caused businesses to buy fewer ads. In the first half of 2021, Google's ad revenue grew 50% year over year to $95.1 billion as the negative factors associated with the pandemic subsided.
Second is the growth of Google Cloud.
Google's advertising business slowed temporarily in 2020, but Google Cloud revenue grew 46% to $13.1 billion as cloud usage accelerated during the pandemic. In the first half of 2021, segment revenues grew another 50% year over year to $8.7 billion.
Google Cloud is not yet profitable, according to Canalys, and it still ranks a distant third in the cloud infrastructure market behind Amazon Web Services (AWS) and Microsoft Azure.
But Google Cloud continues to expand and win over an expanding listing of major partners, including Target, Home Depot, Twitter, and PayPal. Many of these customers probably don't want to support Amazon's most profitable business (as they compete with its retail business) or tie themselves to other Microsoft enterprise services.
Google Cloud's profitability should expand as it improves, but until then it can subsidize its growth with its more profitable advertising business. According to Research and Markets, the global cloud computing market will grow at a compound annual growth rate (CAGR) of 19.1 percent from 2021 to 2028, so Google's cloud business could grow faster than its core advertising business for the foreseeable future.
Third, it's a reasonable valuation of the company.
Analysts expect Alphabet's revenues and profits to grow 37% and 72%, respectively, this year, amid an easy comparison to the impact of the pandemic on the advertising business. Next year, they expect revenues and profits to grow 17% and 5%, respectively, as comparisons with last year normalize.
Based on these expectations, Alphabet is trading at 26 times earnings guidance and 7 times sales guidance, making it more reasonably valued than many of the more "bloated" growth stocks in the tech sector.
But there is still one cause for concern: antitrust risks.
Alphabet's core businesses look strong, but a series of antitrust battles could undermine its growth.
Last October, the U.S. Department of Justice filed an antitrust suit against Google for allegedly monopolizing the online search and search-based advertising market, and is reportedly preparing to file a second antitrust suit to address Google's dominance in certain advertising technologies. Two separate coalitions of states have also filed their lawsuits against Google over its search and advertising business.
The European Commission previously investigated Google Shopping, Google AdSense, and Android, after which it accused Google of using these platforms to drive competitors out of their respective markets. These antitrust investigations led to three separate fines totaling more than $8 billion and forced Google to stop bundling its third-party apps with new Android devices in Europe. If the DOJ case follows a similar path, Google could face even more fines and demands to unbundle its ecosystem.
Google also bears additional antitrust encounters in Australia, India, and South Korea, and more countries may join the process. All of these pressures could prevent investors from paying a higher premium for Alphabet stock.
Alphabet's antitrust problems can't be ignored, but they don't negate its strengths just yet. Alphabet will likely continue to grow, even if fines and new restrictions get in its way.
In a worst-case scenario, Alphabet could be split into several smaller companies. Nevertheless, Alphabet investors would likely get new shares of these smaller companies that could continue to grow on their own without being tied to Google's sprawling ecosystem.

GOOGLE REACCUMULATION!Hello my beauties.
I think Google is completing a phase of reaccumulation, and it might jump above the trading range soon. The arrows do not indicate exact price action, and the trade setup needs to be verified through accurate observation of the developing event in the price action.
If you find this idea to be helpful like, follow, and drop a comment below if you'd want me to analyse a different pair.
Consider supporting me if you think I am providing you with value.
Peace.
Luca, TrickleDownFX

in 15min A high probability of market reversalas the chart showed there is a break in the resistance so it can be return to up
Also the pitchfork gives a good return sign

Google, 1 OCT - Elliott waves | Gann | Astrology $GOOGAlphabet approaches Gann level 2651 and we can count 5 waves to the downside (green count).
The 20 week MA (red) is located below at 2630.
An idea would be to reduce short exposure on Gann level and further observe if buyers step in.
Ascendent conjuncts natal Mercury today, however it stands in trine to natal North Node. Mars squares natal Venus on 2 OCT. Overall rather mixes signals.
Alphabet’s Waymo received a license to offer self-driving rides in California, an important development for the company. Until 8 OCT the Irish govt. is to decide on joining OECD corporate tax proposals, which may impact Alphabet’s margins so that we need to be careful with long positions.
______________
www.constellations.trade
In my analyses I combine Elliott waves, Gann theory, and planetary aspects to identify turning points in the markets & derive high-probability trading ideas. The strategy is to build leveraged exposure when markets are likely to expand, and to use options premium decay for consistent income when markets may contract and range.
Open an account here if you'd like to support my work:
TastyTrade
America's best Options, Futures and Crypto broker
start.tastyworks.com
Deribit
The world's most liquid Bitcoin options platform
www.deribit.com
Binance
10% off trading fees with this link:
accounts.binance.me
These abbreviations in the chart describe ideas that are provided as educational information and do not constitute financial advice:
STO = sell to open
BTC = buy to close
BTO = buy to open
STC = sell to close
TD = Theta Decay (for example a strangle or iron condor)
Disclaimer:
The views and ideas expressed in this analysis are that of the maker. They are provided as educational information and do not constitute financial or trading advice.

Google, 29 SEP - Elliott waves | Gann | Astrology $GOOGAlphabet hit resistance at Gann level 2861 and began to lead the market in yesterday’s selloff. As expected from the Nasdaq analysis we can recognise an unfolding wave (c), which is reflected in GOOG as well.
If the green count is accurate, GOOG may have completed wave iii, so that we can look for a potential wave iv with a retrace to the .382 Fib level (blue box).
Waves 4 are hard to trade but due to their choppiness we may profit from a brief contraction of implied volatility when selling premium.
If wave C continues to unfold we may look at the next levels for potential supports:
- 2699, wave (a)=(c) equality
- 2651 Gann level
- 2549 and 2559, Gann level & 1.618 Fib level
On 29 SEP three minor Mars/Moon constellations occur.
Correlations: DXY continues its exceptional strength as yield spiked, but Gold and Bitcoin has started to rise again, which could potentially be an early indicator that USD may begin to slow. EURUSD is at support level as well. A declining USD would help the yield-sensitive tech sector.
______________
www.constellations.trade
In my analyses I combine Elliott waves, Gann theory, and planetary aspects to identify turning points in the markets & derive high-probability trading ideas. The strategy is to build leveraged exposure when markets are likely to expand, and to use options premium decay for consistent income when markets may contract and range.
Open an account here if you'd like to support my work:
TastyTrade
America's best Options, Futures and Crypto broker
start.tastyworks.com
Deribit
The world's most liquid Bitcoin options platform
www.deribit.com
Binance
10% off trading fees with this link:
accounts.binance.me
These abbreviations in the chart describe ideas that are provided as educational information and do not constitute financial advice:
STO = sell to open
BTC = buy to close
BTO = buy to open
STC = sell to close
TD = Theta Decay (for example a strangle or iron condor)
Disclaimer:
The views and ideas expressed in this analysis are that of the maker. They are provided as educational information and do not constitute financial or trading advice.

GoogleTuesday, 21 September 2021
15:15 PM (WIB)
Google is on very good Bullish move at this time. I need to set up several purchase orders when the market open.
Best regards.
RyodaBrainless
"Live to Ride and Ride to Live"
FLOWWhat is Flow?
Flow is a fast, decentralized, and developer-friendly blockchain, designed as the foundation for a new generation of games, apps, and the digital assets that power them. Flow is the only layer-one blockchain originally created by a team that has consistently delivered great consumer blockchain experiences: CryptoKitties, Dapper Wallet, NBA Top Shot.
Good Project. Last news was a Partnership with Google :
cointelegraph.com
-------------------------------------------------------------------------
Trading Parts :
-------------------------------------------------------------------------
Buy : Now
Rebuy : 20$
TP1 : 39$
TP2 : 59$
Stop Loss : 17.5$
-------------------------------------------------------------------------
Like always follow TheKing for safety.
Happy Tr4Ding !

$GOOGL - Up and to the right - boring chartGoogle's chart is about as boring as it gets. Very tight channel up and to the right. Great long-term hold.


$GOOGL -- A look at your favorite search engine.... AM I RIGHT?No witticisms rn. Just these pretty colors showing how the googster is hanging out in this channel until further notice.

ALPHABET Inc. ( Google ) - Fundamental Analysis - Next target Investors are probably already familiar with FAANG stock, having seen how these five companies - Facebook, Amazon, Apple, Netflix, and Alphabet - led the Nasdaq Index to all-time highs over the past decade. The importance of these five tech companies cannot be exaggerated, and even through the pandemic, the FAANG five contributed to the tech index reaching new all-time highs.
But if there is one among these five companies whose stock is worth thinking about buying today, it is Alphabet. Originally known as Google, or the "G" in the FAANG acronym, the company altered its name six years ago to show it was far from a conventional business. Even though Google is still a major part of Alphabet, the company is made up of many diverse businesses that explore various technologies and industries.
All of the above, as well as the fact that Alphabet's performance is excellent, is a good reason not to hesitate to buy shares in this Internet giant.
Alphabet's financial results are impressive, which illustrates why the company's stock has nearly doubled in the last year alone. Revenue was $90.3 billion in 2016 and more than doubled to $182.5 billion by 2020, while net income rose from $19.5 billion to $40.3 billion in the same period. What's more, capital spending has remained fairly constant even as operating cash flow has increased, resulting in the company's free cash flow growth over the past few years.
The company has shown that it can still grow quickly, with revenues in the second quarter of fiscal 2021 up 62% year over year. Increased technology adoption and digitalization have been important contributing factors to this growth, but Alphabet was already on a consecutive growth path before the pandemic began. Net income for the quarter more than doubled from the previous year to $18.5 billion, and the company's semiannual net income of $36.5 billion already exceeded net income for all of 2019.
The great thing about Alphabet is not just its financial performance, but how the company is committed to improving everyone's lives in so many ways. The pandemic showed just how innovative the company has been, as Google teams launched more than 200 new products and features. Google Maps added a COVID-19 layer displaying case information to help people plan their routes, and Google Meet, the company's video conferencing software, became free to anyone with a Gmail account.
CEO Sundar Pichai suggested a look at new products and systems during the company's latest earnings conference call. A new artificial intelligence system called Lambda with natural communication features will help make communication and computing more accessible to everyone. The upcoming 12th version of Android is designed to improve speed and energy efficiency as well as personalize devices. YouTube Shorts, a short video format similar to the popular TikTok, has been introduced in more than 100 countries and has garnered more than 15 billion daily views.
Alphabet is also investing $10 billion over the next five years to strengthen cybersecurity, as it is now a critical area for many companies and governments. Don't forget that the tech giant also has a division called Other Bets, which is making ambitious investments in new technologies such as self-driving cars and data analytics in healthcare.
This is just a snapshot of the loudest headlines in recent weeks about Alphabet's activities. It would take an entire book to cover everything.
Alphabet's culture is based on "moonshots" that help the company develop related or new technologies and turn them into mature, thriving businesses. In fact, the company is not interested in making only incremental changes to its products and services, but rather in seeking revolutionary changes that can take technology to the next level.
Thus, the company does not shy away from risky projects and encourages a culture of innovation that can lead to the discovery of disruptive technologies that can secure the future. That is what makes the future so exciting for the investor in Alphabet.
The great news is that the company still has a long growth streak in store. Digital ad spending, which last year accounted for nearly 29 percent of the U.S. market share of Google, is up 12.2 percent year over year in 2020 and shows signs of continuing growth.
Alphabet continues to invest in new technology and is steadily enhancing its cloud services, search engine, and other features. Given that the pandemic is a tailwind for technology adoption, investors should be confident that the company can continue to deliver results. The company's stock is relatively inexpensive, it trades at 26 times forward earnings, and the company will likely be able to deliver solid revenue and net income growth for years to come.

GOOGLE First buy signal within the Channel Up.Pattern: Channel Up on 1D.
Signal: Buy (1/2 position) as the price hit and rebounded on the 4H MA50 (red trend-line). Second buy on the 1D MA50 (blue trend-line). This buy pattern has been holding for the majority of 2021.
Target: 3000 (just over the 1.5 Fibonacci extension, which is the extension target on all MA50 bounces).
Most recent Google signal:
** Please support this idea with your likes and comments, it is the best way to keep it relevant and support me. **
--------------------------------------------------------------------------------------------------------
!! Donations via TradingView coins also help me a great deal at posting more free trading content and signals here !!
🎉 👍 Shout-out to TradingShot's 💰 top TradingView Coin donor 💰 this week ==> Vergnes
--------------------------------------------------------------------------------------------------------

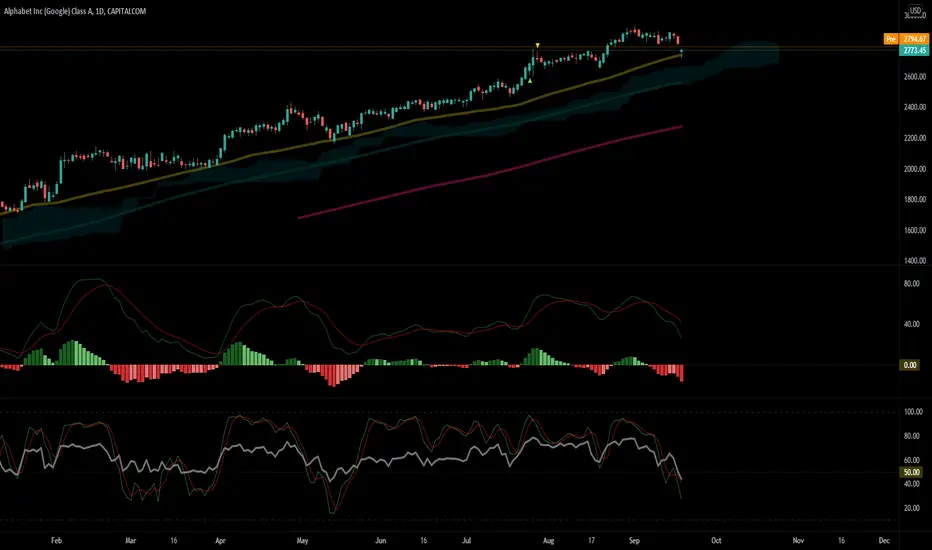
Google Shares Can Fall From Parabolic MoveTraders,
Google (Alphabet) had one the best runs since covid-19 crash last year. The move has just been nothing short of the best parabolic one in any stock in recent times. However it may be about to change. For the first time, Google price action has started to show sign of a correction.
And we know that when a parabolic moves corrects it usually is a quick one too. 😃
Both charts and algos are telling the same story. So this is something I will be watching next week as it may start a new domino effect and lead us into a great profitable short opportunities.
Rules:
1. Never trade too much
2. Never trade without a confirmation
3. Never rely on signals, do your own analysis and research too
✅ If you found this idea useful, hit the like button, subscribe and share it in other trading forums.
✅ Follow me for future ideas, trade set ups and the updates of this analysis
✅ Don't hesitate to share your ideas, comments, opinions and questions.
Take care and trade well
-Vik
____________________________________________________
📌 DISCLAIMER
The content on this analysis is subject to change at any time without notice, and is provided for the sole purpose of education only.
Not a financial advice or signal. Please make your own independent investment decisions.
____________________________________________________

Google Short Positions big time frame (Daily + Monthly)Hi all
Google on a very high price and 10 different indicators that I use tell me it will go down from here
I use big stop loss so I can hold a sneak attack and take that big down move to the take profit.
I also see how sooner than later we will hear the Fed reduce his support or some other news that will help this and all markets to make some big down movement and let the market "back to normal" after.

GOOG cool-off coming?Looking to establish a LONG position in Google.
Couple of great value zones marked on the shorter and longer timeframes.
Very good chance GOOG just keeps pushing on - but prepared for either scenario as per TA.
** NOT FINANCIAL ADVICE **

$GOOGL daily getting rejected at key fib and pivot $GOOGL daily getting rejected at key fib and pivot

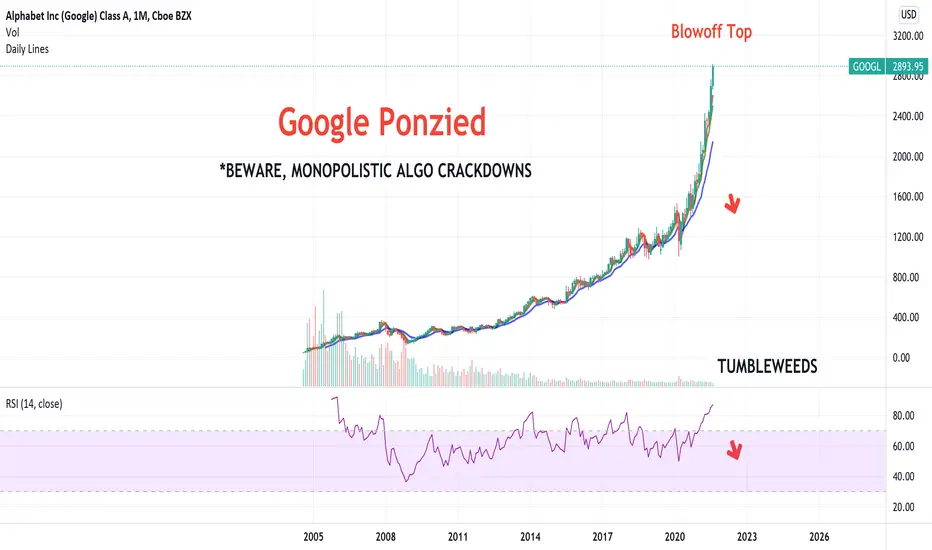
Google Ponzied - Algorithm Crackdown - Ponzi Pogs"only buys fam". The chants of neverending gluttony. #echochambers in the #metaverse.
Algorithms get busted. HODL ponzi pogs & stonks for broke. *valuation matters
Go Small Caps!! #MSOgang #cannabisreform Jobs & Justice!!!!!!
googElliot wave for goog show me this path, and I suggest sell this market by stop one candle creat above resistance

ETH: $3,300 to $14,000 and $35,000 RoadmapBitcoin Investors see Ethereum 2.0 as the gateway to new economies

HBAR Cup & Handle103 Days consolidation, Cup & Handle formation in progress, fundamentally strong project and has ties with many big names like Google, IBM, VISA
