GOOGL TRADE IDEA (07/24)
🚨 GOOGL TRADE IDEA (07/24) 🚨
💥 Big institutional flow. 1 DTE. High gamma = high reward (⚠️ high risk too)
🧠 Quick Breakdown:
• Call/Put Ratio: 2.44 → ultra bullish
• Weekly RSI climbing (67.3) 📈
• Daily RSI falling from 77.5 → 🔻 short-term pullback risk
• Reports split: trade or wait? We’re in.
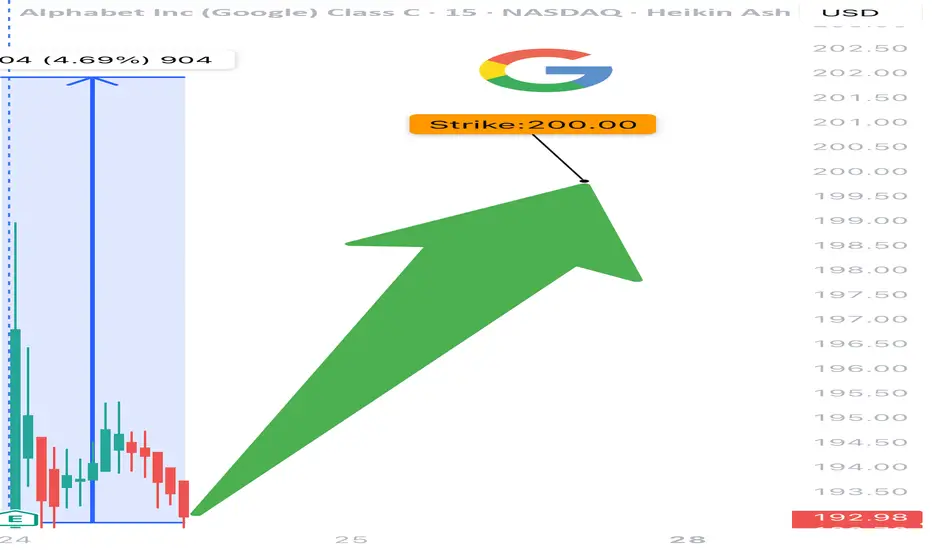
💥 TRADE SETUP
🟢 Buy GOOGL $200 Call exp 7/25
💰 Entry: $2.09
🎯 Target: $3.14–$4.18 (50–100%)
🛑 Stop: $1.25
📈 Confidence: 70%
⚠️ Expiry in 1 day = tight execution needed. Gamma can cut both ways. Watch it like a hawk. 👀
#GOOGL #OptionsFlow #CallOption #GammaSqueeze #TechStocks #UnusualOptionsActivity #TradingView #StockAlerts #BigMoneyMoves #DayTrading #OptionsTrading
Googlelong
GOOG Earnings Setup (2025-07-23)
📈 GOOG Earnings Setup (2025-07-23) 🚀
🔥 STRONG BULLISH BIAS – 85% Confidence
Alphabet (GOOG) is set to report after market close. Here’s why this setup is 🔥:
⸻
📊 Fundamental Highlights:
• 💸 TTM Revenue Growth: +12.0%
• 🧾 Profit Margin: 30.9%
• 💯 Earnings Beat Rate: 8/8 last quarters
• 📈 EPS Est: $8.95
• 🎯 Forward P/E: Attractive in the AI-dominant market
👉 Score: 9/10
⸻
🔍 Options Market Flow:
• 🚀 Heavy Call buying at $195 strike
• 💰 Implied Move: ±5.12%
• 🛡️ Light Put hedging at $190 shows cautious optimism
• 📉 IV Rank: 0.75 (Elevated but tradable)
👉 Score: 8/10
⸻
🧭 Technicals:
• 🔺 RSI: 73.32 (strong momentum)
• 🔼 Above 50/200 MA
• 🔵 Support: $190.00
• 🔴 Resistance: $200.00
👉 Score: 8/10
⸻
🌍 Macro/Sector Tailwinds:
• 🌐 AI & Ads tailwind still fueling growth
• 📡 Sector leadership + resilient biz model
👉 Score: 9/10
⸻
🛠️ Trade Idea (High Conviction)
🔹 Ticker: NASDAQ:GOOG
🔹 Direction: CALL
🔹 Strike: $195.00
🔹 Expiry: 07/25/2025
💵 Entry Premium: $3.95
🎯 Target Premium: $11.85 (200%)
🛑 Stop: $1.98 (50%)
📅 Entry: Before 07/23 Close (Pre-Earnings)
⸻
📌 Risk-Reward
• Max Loss: $395 per contract
• Target Gain: $1,190 per contract
• Break-even: $198.95
• ⏳ Time-sensitive: Close post-earnings if flat (avoid IV crush)
⸻
🚨 Summary
💥 GOOG looks primed for an upside breakout. Strong fundamentals + bullish technicals + aggressive options flow make this a top-tier earnings play.
🔔 Watch $195–$200 zone post-earnings.
💬 Drop your thoughts 👇 — are you playing GOOG this earnings?

Alphabet - The textbook break and retest!📧Alphabet ( NASDAQ:GOOGL ) will head much higher:
🔎Analysis summary:
If we look at the chart of Alphabet we can basically only see green lines. And despite the recent correction of about -30%, Alphabet remains in a very bullish market. Looking at the recent all time high break and retest, there is a chance that we will see new all time highs soon.
📝Levels to watch:
$200
🙏🏻#LONGTERMVISION
Philip - Swing Trader

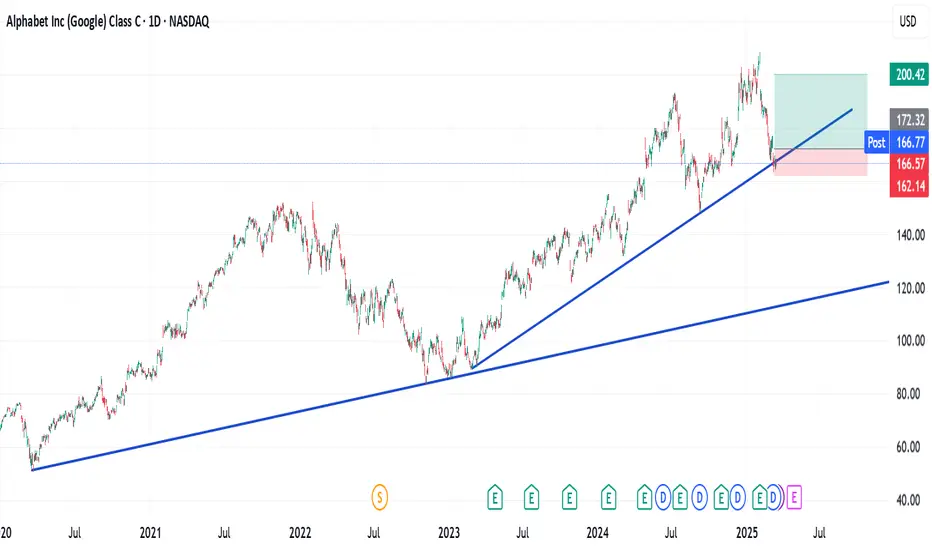
$141 Stop, $207 Target — Bullish Setup on GOOGL with 1.4RMarket Context
Alphabet Inc. (GOOGL) is showing renewed bullish momentum on the 2-week chart. After a healthy correction earlier in the year, price action is now turning decisively upward, reclaiming its long-term trendline and bouncing off a major support level. This setup suggests a shift in market sentiment from consolidation to breakout mode, with significant upside potential.
Key Technical Levels
• Key Support – $151.90
This zone has acted as a major demand level and was tested multiple times. The recent bounce from here reaffirms its strength and underscores the market’s willingness to buy dips at this level.
• Stop Loss – $141.49
Positioned just below the Key Support, this stop loss accounts for volatility while protecting against a full breakdown. A close below this level would invalidate the bullish thesis.
• Resistance Level 1 (TP1) – $191.91
This price level marks a prior swing high and represents the first bullish target.
• Resistance Level 2 (TP2) – $207.32
A clear breakout beyond TP1 sets up the path toward this higher resistance, which also aligns with historical supply from mid-2021.
• Trendline Reclaim
The multi-year ascending trendline, breached temporarily, has now been reclaimed with conviction — a strong bullish signal on higher timeframes.
Trade Setup
• Entry Zone: $168.00 – $169.00
• Take Profit 1 (TP1): $191.91 (approx. 14% upside)
• Take Profit 2 (TP2): $207.32 (approx. 23% upside)
• Stop Loss: $141.49 (just below Key Support)
• Risk–Reward Ratio: Approximately 1.43
Price Action & Trend Confirmation
After establishing a series of higher lows, GOOGL has rebounded from the $151.90 zone with strength, forming a bullish engulfing candle on the 2W chart. This move brought the price back above the long-term trendline — a textbook bullish signal when viewed on a macro timescale. The structure now favors trend continuation, especially if the price holds above the $168–$170 zone in the short term.
Risk Management and Strategy
The stop loss below $151.90 is deliberately placed at $141.49 to avoid premature exit from minor volatility. This level is safely beneath the most recent swing low and gives the trade breathing room to develop. A partial exit at TP1 locks in gains while preserving capital for the extended move to TP2, where major resistance could trigger broader market attention.
Conclusion
GOOGL is setting up for a high-probability breakout from a clean technical base. With the price respecting long-term support, reclaiming the trendline, and establishing bullish momentum, the path of least resistance is upward. The trade offers a solid reward-to-risk profile and aligns with institutional-style setups often seen prior to extended rallies.
In short: GOOGL looks ready to move, and this is a setup bulls won’t want to ignore.

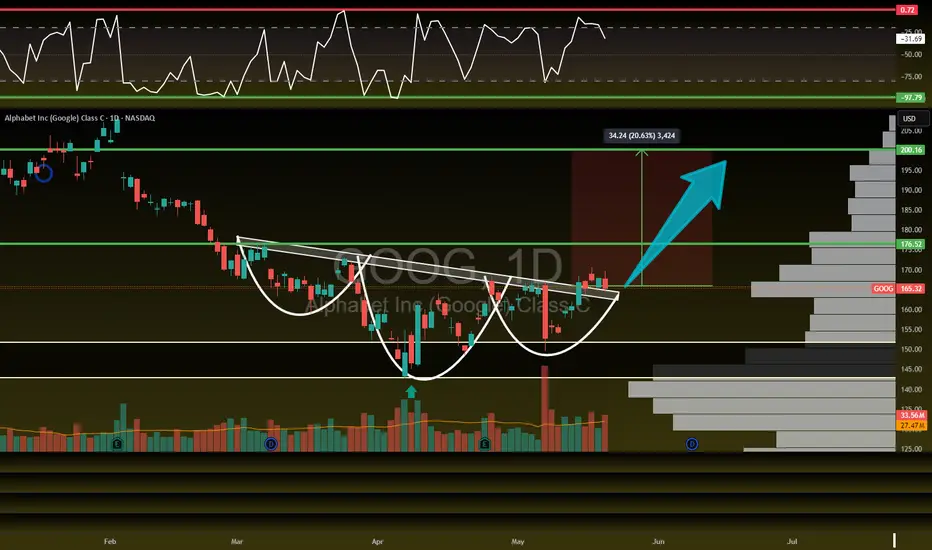
Google primed for a 20% move!NASDAQ:GOOG NASDAQ:GOOGL looks COILED! 🚀
Currently retesting Inverse H&S breakout and H5_S Indicator here.
Bounce will lead us too...🎯$176.52📏$200.16
- Volume shelf launch
- Bullish WR%
- Bullish weekly uptrend
- Severely undervalued
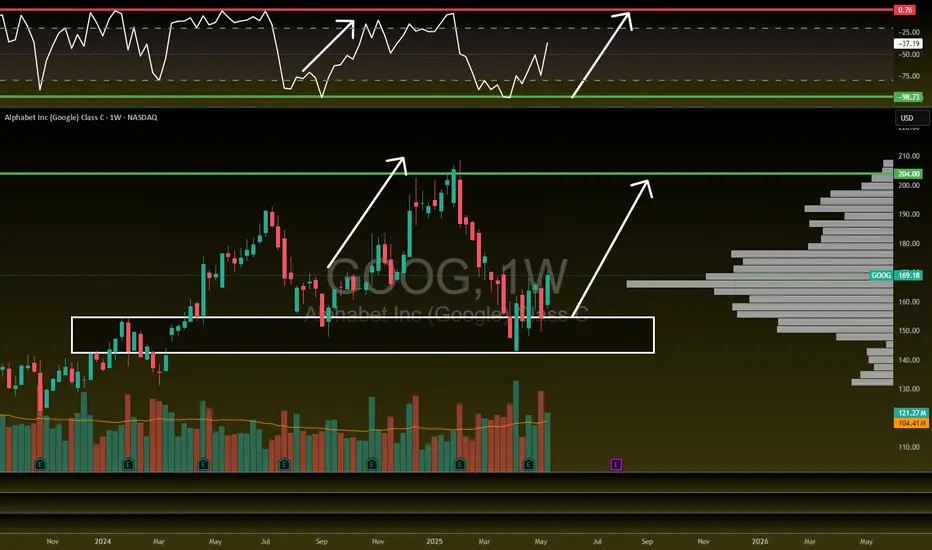
Google to $200!NASDAQ:GOOG NASDAQ:GOOGL
We are uptrending back to ATHs on Google here after they have lagged this whole rally and are the CHEAPEST MAG 7 STOCK!
- Volume shelf launch
- Rising Wr%
- Bouncing off key S/R zone
- H5 Indicator is about to flip to green and make a bullish cross
- Volume is climbing
- Bullish engulfing candle
- Daily looks great as well
Target is $200
$GOOG Trade Alert! 20% Upside🚨 H5 Trade Alert: NASDAQ:GOOGL NASDAQ:GOOG
PT: $176.52 🎯
MM: $200 📏 by July 29th ⏲️
- Green H5 Indicator
- Inverse H&S Breakout
- Volume Shelf Launch
- Increasing Volume
- Lagging Rally
- Cheapest MAG7
- Weekly Trend Rising
Not financial advice

$GOOGL primed for a BIG MOVE!NASDAQ:GOOGL primed for a BIG MOVE! 🚀
Heading into earnings, this stock’s valuation has been overlooked—but strong results could flip the narrative fast! 💨
✅ Bounced off 2021 highs
✅ RSI at its lowest since COVID
✅ Major indicators curling upward
✅ Volume shelf launch incoming
✅ Wr% pendulum swinging
Momentum is building—are you ready? 👀
Not financial advice

Google -GOOG at a critical junctureGoogle -GOOG at a critical juncture
If this asset breaks above the trendline sustainably, I will expect this asset to push further to the north.
The TL will become support level and my SL will be below the TL as shown on my chart.
Trade with care
Is GOOGL Setting Up for a Rebound?The corrective move continues, offering potential opportunities for strategic entries. If the dip extends, these key levels could present buying opportunities:
📉 Entry Points:
🔹 165
🔹 158
🔹 150
🔹 135-130 ⚠️ Possible deeper entry point???
📈 Profit Targets:
🔹 175
🔹 181
🔹 190
Will GOOGL find support at these levels and bounce back, or is there more downside ahead? Stay prepared and manage your risk wisely.
Disclaimer: The information provided is for educational purposes only and does not constitute investment advice. Trading involves significant risks, and past performance is not indicative of future results. Always conduct your own analysis and consult a financial advisor before making any investment decisions.

Google Update - Trade this range and new ATH Identified Update video on the google Long that has been planned since early FEB. The level has now been hit and we got a nice reaction off that level . In this video I look into where I think we go next and how price plays out .
In the video I use the following tools TR Pocket FIB , 0.618 FIB , Pivots , Parallel Channel and the Fixed range Vol Profile.
If we stay range bound inside the channel then we have the potential to see a new high on google at the top of the channel in confluence with 1-1 ext + tr pocket expansion .
Watch the video and mark the levels on your chart and ensure to set your alerts .
Dont forget to Boost the chart Please and i welcome any questions TY

GOOGLE Long PlanSo here is our plan for entering a Google long position. And you know what the old saying is "plan your trade, and trade your plan".
We will be looking long and hard at the volume profile when we reach that area.
Our last Google trade that we posted it all the Take Profit points, and was great.
So mark this on your chart and set alerts.

GOOG 4TH FEB READ DESCRIPTION Google is showing no sign of loss of momentum on Daily, Weekly & Monthly.
Again since it is All Time High so we ill have to understand the risk involved here.
I will Scalp here with stocks for a quick 10% move
NOTE: DO NOT TRADE OPTIONS

Google shares Alphabet's (Google) expected Q4 2024 metrics include: Google Properties revenue at $63.43B (+10.9% YoY), Google Cloud at $12.14B (+32.1%), YouTube ads at $10.16B (+10.4%), and Google Search & Other at $53.18B (+10.7%). Total revenue is forecasted at $81.38B (+12.5% YoY).

GOOGLE - Trade Analytics InsideNASDAQ:GOOGL looking like a SNACK! 🤤
🔹Green H5 Indicator
🔹Triangle breakout
🔹Bullish Wr%
🔹Volume shelf launch
🎯$203🎯$217 before March! ⏲️
Not financial advice

Google I Potential positive growth in the ascending channel Welcome back! Let me know your thoughts in the comments!
** Google Analysis - Listen to video!
We recommend that you keep this pair on your watchlist and enter when the entry criteria of your strategy is met.
Please support this idea with a LIKE and COMMENT if you find it useful and Click "Follow" on our profile if you'd like these trade ideas delivered straight to your email in the future.
Thanks for your continued support!Welcome back! Let me know your thoughts in the comments!

GOOGLE: Where are they going after earnings? Let's talk about itWHERE WILL GOOGLE GO AFTER THEY REPORT EARNINGS ON TUESDAY?!
NASDAQ:GOOG NASDAQ:GOOGL
In this video, we will review 3 key items that give us the best probability of predicting where they will go.
1⃣ See if it meets my "High Five Setup" trade strategy
2⃣ Why it's BUY according to my Valuation Metric Tool (6/6 score) I WANT A DIP!
3⃣ Look aHEAD to find out 👇
Video analysis 4/5. Stay tuned!🔔
Like ❤️ Follow 🤳 Share 🔂
Is this MAG7 name finally going to play catchup to its siblings? Drop a comment below.
Not financial advice.

THE STOCK GAUNTLET HAS BEGUN! GOOGLE 1/17⚔️🛡️ THE STOCK GAUNTLET HAS BEGUN! ⚔️🛡️
STOCK/TRADE UPDATE: 1/17
1⃣ NASDAQ:GOOG NASDAQ:GOOGL
Show some love: ❤️
LIKE | FOLLOW | SHARE | BOOKMARK IT
🔔 Hit the bell to be notified when each video drops!
NFA #tradingstrategy #HIGHFIVESETUP
NASDAQ:GOOG NASDAQ:GOOGL

Googling Gains: Long Trade Insights for AlphabetNASDAQ:GOOGL is a MUST HOLD for future gains.
Following up on last week's call, price did hit our ideal entry point and we are now long and strong. Stop loss has been re-adjusted at break even. Any bystanders, below is the ideal entry STRATEGY
Bullish time at mode trend has just been confirmed.
* Expiry is set for the end of November
* Targets of $189 and $201's at first.
* Ideal entry DCA low $170’s
* Stop at $169

Google is Taking a Break and accumulating for the 2nd run !Google returns to the inflection zone we had previously studied. This is good news because, after pulling back, we got a bounce in the same inflection zone.
What does this mean?
It means that the price is more than ready to continue its upward trend; however, it is just forming an accumulation pattern, where it could resume its upward movement at any moment.
Key points to follow:
Markets, in general, are bullish, and we are in a week of high market euphoria, which could support the price to continue rising.
Google continues to report positive news within the company.
Google’s prices have increased, indicating that higher figures may be reported in their next earnings report.
In my opinion, Google will remain in an accumulation range this week—it's a pattern where the price will hold steady this week before its next bullish run.
Thank you for supporting my analysis. TRADE SAFE! Best regards."

**Ticker:** goog **Trade Type:** long **Entry Price:** 178.71 *
**Ticker:** goog
**Trade Type:** long
**Entry Price:** 178.71
**Stop Loss:** 178.34
**Take Profit 1:** 181.77
**Take Profit 2:** 183.76
**Risk/Reward Ratio:** 8.3
**Timeframe:** 1h
**Monthly Status:** green inside bar
**Weekly Status:** green inside bar
**Daily Status:** green
**Hourly Status:** green NASDAQ:GOOG

Google - It Is Bullish Either Way!Google ( NASDAQ:GOOGL ) will follow one of two scenarios:
Click chart above to see the detailed analysis👆🏻
Google just perfectly followed the anticipated bullish break above the previous all time high, the retest and the bullish continuation towards the upside. Even if we see another retest of the breakout level, Google remains in an overall uptrend and the path of least resistance is higher.
Levels to watch: $200, $150
Keep your long term vision,
Philip (BasicTrading)

$GOOG $GOOGL IS A GIFT RIGHT NOW. YOU WILL SEE! NASDAQ:GOOG NASDAQ:GOOGL
IS A GIFT. YOU WILL SEE!👀
1.) High Five Setup
2.) Inverse H&S Breakout/will retest and fill earnings GAP then head to the Measure Move (MM) of $193.
3.) They just demolished earnings and everyone was bullish until the market decided to pull back. Everyone just forgot about the ones who reported first out the MAG7.
What do you think? Is this the easiest trade you've ever seen? IMO it's definitely one of them haha
"BE GREEDY WHEN OTHERS ARE FEARFUL"-WB
NFA
