Google In Talks To Seize Major Stake In UK Challenger MonzoAlphabet, the parent company behind Google, is reportedly on track to seize a major stake in the digital retail bank Monzo as it leads investors in a fresh funding round.
Alphabet will leverage its independent growth fund Capital to pour between £300 million and £500 million into the UK-founded challenger, valuing it above £4 billion, Sky News reports.
Also set to include new and existing investors, sources tell Sky News that the round could close before the end of the year, however final details are yet to be released.
The challenger last raised over £377 million ($500 million) in December 2021 in a Series H funding round led by Abu Dhabi Growth Fund, with participation from Accel, General Catalyst, Goodwater, Passion Capital, Octahedron and Thrive along with new investors Coatue and Alpha Wave Ventures.
Last month, Sky News reported that Monzo was looking to raise £300 million in fresh funds through a share sale, and is believed to have engaged with a number of blue-chip investment funds.
The move is thought to be clearing the way for the challenger to go public, while ex-Cash App head Conor Walsh and Brolly founder Phoebe Chibuzo Hugh have been brought on-board to lead both its product and market expansions.
It’s not clear when or where Monzo will induce a stock market floatation, but Alphabet and its long history of acquiring companies that go public inching ever closer into its ownership structure could provide the finishing touches to its final preparations.
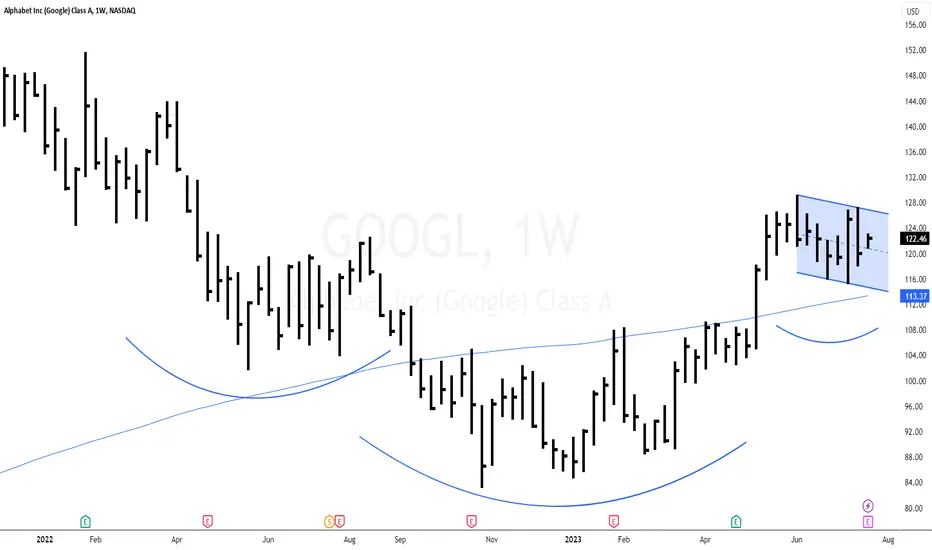
Price Momentum
GOOGL is trading near the top of its 52-week range and above its 200-day simple moving average.
What does this mean?
Investors have been pushing the share price higher, and the stock still appears to have upward momentum. This is a positive sign for the stock's future value.
Googlelong

Trade setup_20% wave in GOOGLEGoogle is all set to move up in wave V of 3 towards the 150$ mark.
On the way up watch out for levels 131.9 and 134. If the stock surpasses them with ease that would reduce the probability of this bounce being an "X" wave and the stock will make it to the 150 mark.
Note*- do your own study/research before taking up any financial positions.

Google Set to Announce Positive 3Q Earnings - Time to Long GOOG!I am thrilled to share with you that Google (GOOG) is anticipated to announce positive 3Q earnings, and I couldn't be more excited about the potential this brings for all of us.
Google, being one of the most influential companies in the tech industry, has consistently demonstrated its ability to innovate and adapt to the ever-changing digital landscape. With its diverse range of products and services, the company has managed to maintain its position as a global leader.
Now, with the upcoming release of 3Q earnings, we have a golden opportunity to capitalize on Google's success. The positive financial outlook signifies that the company is not only thriving but also well-positioned for future growth. This is a clear indication that GOOG is a stock worth considering for a long position.
As traders, it's crucial to stay ahead of the curve and seize opportunities when they arise. By going long on GOOG, we can potentially benefit from the positive momentum generated by the anticipated earnings report. This is an exciting prospect, and I encourage all of you to seriously consider taking action and adding GOOG to your portfolios.
Google's unwavering commitment to innovation, coupled with its strong financial performance, makes it an attractive investment option. The company's diverse revenue streams, including advertising, cloud services, and hardware, provide a solid foundation for continued growth and profitability.
So, let's embrace this moment of positivity and take advantage of the potential gains that lie ahead. I urge you to conduct your due diligence, analyze the market trends, and consider the long-term prospects of GOOG. By doing so, we can position ourselves to ride the wave of success alongside Google.
Remember, timing is crucial in the world of trading, and this could be an opportune moment to go long on GOOG. So, let's seize this chance and make the most of it together.

GOOG Post earning Analysis|25th July 23I am pretty confident about price hitting $136 and then $138. Make sure to understand price action in depth.

$GOOGl Technical AnalysisNASDAQ:GOOGL has several bullish patterns forming. There is a Bull Flag consolidating, there is inverse head & shoulders pattern, and NASDAQ:GOOGL is above the 150 day moving average showing an uptrend.
Alphabet(Google) Long BullishTechnical Bullish
HHHL above 99
Trendomat BuySell pressure Bullish
Weekly average price above Monthly average price
145.32 is critical as Volume value is weak.
Incase volume would increase and abreak above 151
Alphabet will potentially walk to above 210
A break below 86 is bearish.
Return vs Industry: GOOGL underperformed the US Interactive Media and Services industry which returned 22.5% over the past year.
Return vs Market: GOOGL underperformed the US Market which returned 14.5% over the past year.
Stable Share Price: GOOGL is less volatile than 75% of US stocks over the past 3 months, typically moving +/- 4% a week.
Volatility Over Time: GOOGL's weekly volatility (4%) has been stable over the past year.
Price-To-Earnings vs Peers: GOOGL is good value based on its Price-To-Earnings Ratio (26.7x) compared to the peer average (51x).
Price-To-Earnings vs Industry: GOOGL is expensive based on its Price-To-Earnings Ratio (26.7x) compared to the US Interactive Media and Services industry average (19.9x)
What is the Fair Price of GOOGL when looking at its future cash flows? For this estimate we use a Discounted Cash Flow model.
Below Fair Value: GOOGL ($123.1) is trading below our estimate of fair value ($160.36)
Significantly Below Fair Value: GOOGL is trading below fair value by more than 20%.
Alphabet is forecasted to grow earnings and revenue by 13.1% and 9% per annum respectively. EPS is expected to grow by 14.6%. Return on equity is forecast to be 22.3% in 3 years.
Analyst Future Growth Forecasts
Earnings vs Savings Rate: GOOGL's forecast earnings growth (13.1% per year) is above the savings rate (2.1%).
Earnings vs Market: GOOGL's earnings (13.1% per year) are forecast to grow slower than the US market (15.7% per year).
High Growth Earnings: GOOGL's earnings are forecast to grow, but not significantly.
Revenue vs Market: GOOGL's revenue (9% per year) is forecast to grow faster than the US market (7.5% per year).
High Growth Revenue: GOOGL's revenue (9% per year) is forecast to grow slower than 20% per year.
Future ROE: GOOGL's Return on Equity is forecast to be high in 3 years time (22.3%)
Earnings and Revenue History
Quality Earnings: GOOGL has high quality earnings.
Growing Profit Margin: GOOGL's current net profit margins (20.6%) are lower than last year (27.6%).
Earnings Trend: GOOGL's earnings have grown significantly by 25.9% per year over the past 5 years.
Accelerating Growth: GOOGL's has had negative earnings growth over the past year, so it can't be compared to its 5-year average.
Earnings vs Industry: GOOGL had negative earnings growth (-21.4%) over the past year, making it difficult to compare to the Interactive Media and Services industry average (-16.9%).
High ROE: GOOGL's Return on Equity (22.5%) is considered high.
Financial Position Analysis
Short Term Liabilities: GOOGL's short term assets ($162.0B) exceed its short term liabilities ($68.9B).
Long Term Liabilities: GOOGL's short term assets ($162.0B) exceed its long term liabilities ($39.7B).
Debt to Equity History and Analysis
Debt Level: GOOGL has more cash than its total debt.
Reducing Debt: GOOGL's debt to equity ratio has increased from 3.3% to 4.5% over the past 5 years.
Debt Coverage: GOOGL's debt is well covered by operating cash flow (757.9%).
Interest Coverage: GOOGL earns more interest than it pays, so coverage of interest payments is not a concern.
CEO Compensation Analysis
Compensation vs Market: Sundar's total compensation ($USD225.99M) is above average for companies of similar size in the US market ($USD12.23M).
Compensation vs Earnings: Sundar's compensation has increased by more than 20% whilst company earnings have fallen more than 20% in the past year.
Insider Buying: Insufficient data to determine if insiders have bought more shares than they have sold in the past 3 months.

Google -> Pumping With The AI HypeHello Traders,
welcome to this free and educational multi-timeframe technical analysis .
On the weekly timeframe you can see that Google stock just retested and with a weekly bearish candle perfectly started to reject major previous structure at the $130 level.
You can also see that weekly market structure is still quite bullish, Alphabet is now retesting the 50% fibonacci retracement level and also previous weekly resistance which is now turned support at the $120 level so I simply do expect more continuation towards the upside from here.
On the daily timeframe you can see that Google stock just created and confirmed a daily head and shoulders reversal pattern so I am now just waiting for a break back above the neckline - then we would also have bullish market structure again - and then I simply do expect also a daily rally to retest the next resistance at the $130 level.
Thank you for watching and I will see you tomorrow!
You can also check out my previous analysis of this asset:

Massive Breakout with Google - Arrival of the Golden CrossA great opportunity to buy Google a free cash flow surplus company that is undervalued. The stock is now ready for a massive breakout with the arrival of the golden cross.

AI strategy drives NVDA MSFT GOOG METAAs we navigate through the ever-evolving world of technology, it is becoming increasingly evident that artificial intelligence (AI) is the driving force behind some of the biggest players in the market. Companies such as NVIDIA (NVDA), Microsoft (MSFT), Google (GOOG), and Meta Platforms (META) have all implemented AI strategies that have propelled them to the forefront of their respective industries. In this email, we will explore how these companies are utilizing AI to gain a competitive edge and what it means for their future growth potential. So, buckle up and let's dive into the world of AI and its impact on the stock market.
Additionally, it's crucial to have a long-term investment strategy and to not make emotional decisions based on short-term market fluctuations. It's also wise to diversify your portfolio across different industries and sectors to minimize risk. Seeking the advice of a financial advisor can also be helpful in making informed investment decisions.
Additionally, it's important to have a long-term investment strategy and not make emotional decisions based on short-term market fluctuations. It's also wise to consider factors such as the company's financial health, industry trends, and management team before investing in individual stocks. Diversification is key to managing risk, so it's advisable to have a mix of individual stocks and diversified portfolios in your investment portfolio. Finally, seeking the advice of a financial advisor can help you make informed investment decisions and manage your risk effectively.

GooGusd are you rdy for buy 🧨👌❤The big company Google has been using the downward trend of gold for days and for now it will have an upward trend for its shareholders.
Dear Americans who are Google shareholders, do not hold your shares until the price of $152.10.
The downward trend of Google will start from the price of $152.10, and for a long time, Google will sink into financial stagnation, and the expected decline for Bill Gates is $69.
These days, Bill Gates will sell Google shares as much as he can and will start buying when Google shares fall.

Google-> BreakoutHello Traders,
welcome to this free and educational multi-timeframe technical analysis .
On the weekly timeframe you can see that Google stock is finally breaking above a major previous weekly support/resistance level exactly at the $105 area.
You can also see that weekly market structure and moving averages are bullish, the next major resistance is sitting at the $120 level and it overall seems like the bottom is in for Google so I just do expect more continuation towards the upside.
On the daily timeframe you can see that with today's candle Google stock is up almost 5%, creating a massively bullish breakout and breaking all resistance towards the upside so I am now just waiting for a retest of the $105 level and then I do expect more continuation towards the upside.
Thank you for watching and I will see you tomorrow!
You can also check out my previous analysis of this asset:

Google -> Finally The BottomHello Traders,
welcome to this free and educational multi-timeframe technical analysis .
On the weekly timeframe you can see that Google stock just recently perfectly broke above and is now retesting a major previous weekly structure area which is now turned support at the HKEX:104 level.
You can also see that weekly market structure is now bullish, moving averages are also bullish and the recent price action on Alphabet stock just looks like a solid bottom formation so I simply do expect more continuation towards the upside from the current levels.
On the daily timeframe you can see that market structure is about to shift bearish so I am now just waiting for a clear bullish impulse and break above the daily HKEX:107 resistance before I then do expect more continuation towards the upside.
Thank you for watching and I will see you tomorrow!
You can also check out my previous analysis of this asset:

Google -> Ready For The RallyHello Traders,
welcome to this free and educational multi-timeframe technical analysis .
On the weekly timeframe you can see that Google stock just recently broke above a quite obvious bearish trendline, breaking out of a multi-month downtrend.
You can also see that weekly market structure is bullish again, we already broke above the $100 resistance area and retested and rejected the area so everything seems very bullish on the weekly timeframe.
On the daily timeframe you can see that Google stock is retesting previous daily resistance at the FWB:108 area so I am now just waiting for a simple break and retest before I then do expect more continuation towards the upside.
Thank you for watching and I will see you tomorrow!
You can also check out my previous analysis of this asset:

Google -> The Stock Is BackHello Traders,
welcome to this free and educational multi-timeframe technical analysis .
On the weekly timeframe you can see that Google stock has been trading in a range for quite some time now, you can also see that the upper resistance of this trading range is exactly at $105.
You can also see that we are currently again retesting this resistance area, from a weekly perspective the market seems definitely ready for a breakout so I think that this time Google stock will actually break above this key resistance area.
On the daily timeframe I am now just waiting for a breakout above this resistance area and if we then get a retest and bullish confirmation, it is quite likely that from there we will then see more continuation towards the upside.
Thank you for watching and I will see you tomorrow!
You can also check out my previous analysis of this asset:

MY THOUGHT FOR ALPHABET INC STOCKThis asset will drop [ some dollars to hit the FIB61.8 and the Ascending trendline it will start to rally up.
watch out these critical zones

AI forecast: Google goes UP to $129AI forecasts growing Google to $129 by the end of February, 2023.
We have bought this stock at $103
--
AI is based on Fundamental analysis , Technical analysis and Geopolitical analysis. It analyses more than 500GB data every minute.
Have a nice day!

GOOG Alphabet Options Ahead of Earnings | Last Quarter of GrowthAs you can see, the last chart was pretty accurate:
Now I think this year we will see Google losing ground in the advertising industry.
The Justice Department filed an antitrust lawsuit Tuesday against Google alleging the company of abusing its dominance over smaller rivals by operating like an illegal monopoly.
MSFT Microsoft bought a 49% stake in OpenAI, who owns CHatGPT, that ca really be a rival to Google in answering questions.
As a matter of fact i am using ChatGPT more than Google search right now.
So i believe this is the last quarter of growth for GOOG / GOOGL, as you can see in the chat, because Q4 was not impacted by ChatGPT so much.
Looking at the GOOG Alphabet options chain ahead of earnings , I would buy the $100 strike price Calls with
2023-2-10 expiration date for about
$2.66 premium.
If the options turn out to be profitable Before the earnings release, I would sell at least 50%.
Looking forward to read your opinion about it.

Google vs Apple; How Android will kill Apple.Fact;
- Apple (iPhone, etc.) is entirely (100%) sourced from China;
- Google (Android) is 100% sourced from S. Korea & Japan.
1) Considering the abject population collapse - and massive DE-industralization!! - of China, it will take YEARS for Apple to relocate it's entire supply chain. (To N. America?) E.g. Apple will be lucky to bring out a new iPhone every other year - even that being overly optimistic.
2) Barring an outright armed conflict between S. Korea and Japan (very unlikely) Google's supply chain should be just fine, mostly unaffected by the coming Chinese de-urbanization and de-industrialization. (... which China will be forced to endure in order to feed the *** 800 million Chinese ***, which is what will be left in that country, by 2035.)
When will this purported Chinese population collapse and total de-industrialization begin?? ... You are in it!
(It is well worth to pay attention to it because it will (continue to) be spectacular!!)
Simultaneously, the technical picture is also very favorable for the upside, in this spread.

Google in inverted head and shoulders.Alphabet - 30d expiry - We look to Buy at 95.11 (stop at 91.82)
A bullish reverse Head and Shoulders has formed.
Bespoke support is located at 94.20.
Levels below 95 continue to attract buyers.
The primary trend remains bullish.
Dips continue to attract buyers.
Early pessimism is likely to lead to losses although extended attempts lower are expected to fail.
Our profit targets will be 103.33 and 105.33
Resistance: 101.00 / 103.50 / 105.00
Support: 97.00 / 94.20 / 91.80
Disclaimer – Saxo Bank Group.
Please be reminded – you alone are responsible for your trading – both gains and losses. There is a very high degree of risk involved in trading. The technical analysis , like any and all indicators, strategies, columns, articles and other features accessible on/though this site (including those from Signal Centre) are for informational purposes only and should not be construed as investment advice by you. Such technical analysis are believed to be obtained from sources believed to be reliable, but not warrant their respective completeness or accuracy, or warrant any results from the use of the information. Your use of the technical analysis , as would also your use of any and all mentioned indicators, strategies, columns, articles and all other features, is entirely at your own risk and it is your sole responsibility to evaluate the accuracy, completeness and usefulness (including suitability) of the information. You should assess the risk of any trade with your financial adviser and make your own independent decision(s) regarding any tradable products which may be the subject matter of the technical analysis or any of the said indicators, strategies, columns, articles and all other features.
Please also be reminded that if despite the above, any of the said technical analysis (or any of the said indicators, strategies, columns, articles and other features accessible on/through this site) is found to be advisory or a recommendation; and not merely informational in nature, the same is in any event provided with the intention of being for general circulation and availability only. As such it is not intended to and does not form part of any offer or recommendation directed at you specifically, or have any regard to the investment objectives, financial situation or needs of yourself or any other specific person. Before committing to a trade or investment therefore, please seek advice from a financial or other professional adviser regarding the suitability of the product for you and (where available) read the relevant product offer/description documents, including the risk disclosures. If you do not wish to seek such financial advice, please still exercise your mind and consider carefully whether the product is suitable for you because you alone remain responsible for your trading – both gains and losses.

GOOG Alphabet Inc. Technical ReboundIf you haven`t sold GOOG at the top, when Ark Invest did:
Then you should know that a technical rebound refers to a recovery from a prior period of losses when technical signals indicate that the move was oversold.
In this case, the Relative Strength Index momentum indicator of GOOG is at 22.42.
Even though i am overall bearish on the economy, buying a strong financial instrument when the RSI is below 30, would make a case for a potential short term reversal.
Looking forward to read your opinion about it.

Google: Rise like a phoenixThe Google course is currently rising like a phoenix from the ashes and slowy climbing out of the green zone. Once Google leaves the resistance at $104.82 behind, it should be able to catch its breath and use its strong wings to ascent above the resistance at $113.61. For now, it's important to stay above the $76.22 mark in order to keep the upwards trend going, although Google should not get too comfortable above the clouds since there might be a storm coming that could push our Phoenix back to the ground.

Google supported by weekly bullish div.Alphabet - 30d expiry - We look to Buy a break of 103.66 (stop at 99.49)
Price action looks to be forming a bottom.
Bullish divergence can be seen on the weekly chart (the chart makes a lower low while the oscillator makes a higher low), often a signal of exhausted bearish momentum, or at least a correction higher.
The RSI is trending higher.
103.47 has been pivotal.
A break of the recent high at 103.47 should result in a further move higher.
With signals for sentiment at oversold extremes, the dip could not be extended.
Our profit targets will be 114.49 and 118.49
Resistance: 103 / 106 / 112
Support: 100 / 98 / 96
Disclaimer – Saxo Bank Group.
Please be reminded – you alone are responsible for your trading – both gains and losses. There is a very high degree of risk involved in trading. The technical analysis , like any and all indicators, strategies, columns, articles and other features accessible on/though this site (including those from Signal Centre) are for informational purposes only and should not be construed as investment advice by you. Such technical analysis are believed to be obtained from sources believed to be reliable, but not warrant their respective completeness or accuracy, or warrant any results from the use of the information. Your use of the technical analysis , as would also your use of any and all mentioned indicators, strategies, columns, articles and all other features, is entirely at your own risk and it is your sole responsibility to evaluate the accuracy, completeness and usefulness (including suitability) of the information. You should assess the risk of any trade with your financial adviser and make your own independent decision(s) regarding any tradable products which may be the subject matter of the technical analysis or any of the said indicators, strategies, columns, articles and all other features.
Please also be reminded that if despite the above, any of the said technical analysis (or any of the said indicators, strategies, columns, articles and other features accessible on/through this site) is found to be advisory or a recommendation; and not merely informational in nature, the same is in any event provided with the intention of being for general circulation and availability only. As such it is not intended to and does not form part of any offer or recommendation directed at you specifically, or have any regard to the investment objectives, financial situation or needs of yourself or any other specific person. Before committing to a trade or investment therefore, please seek advice from a financial or other professional adviser regarding the suitability of the product for you and (where available) read the relevant product offer/description documents, including the risk disclosures. If you do not wish to seek such financial advice, please still exercise your mind and consider carefully whether the product is suitable for you because you alone remain responsible for your trading – both gains and losses.

GOOG 2D bullish hammer in the end of ABC correctionOrder BUY GOOG NASDAQ.NMS Stop 97.33 LMT 97.33 will be automatically canceled at 20230401 01:00:00 EST
GOOG 2D bullish hammer in the end of ABC correction. That might be it for GOOG in terms of correction.
