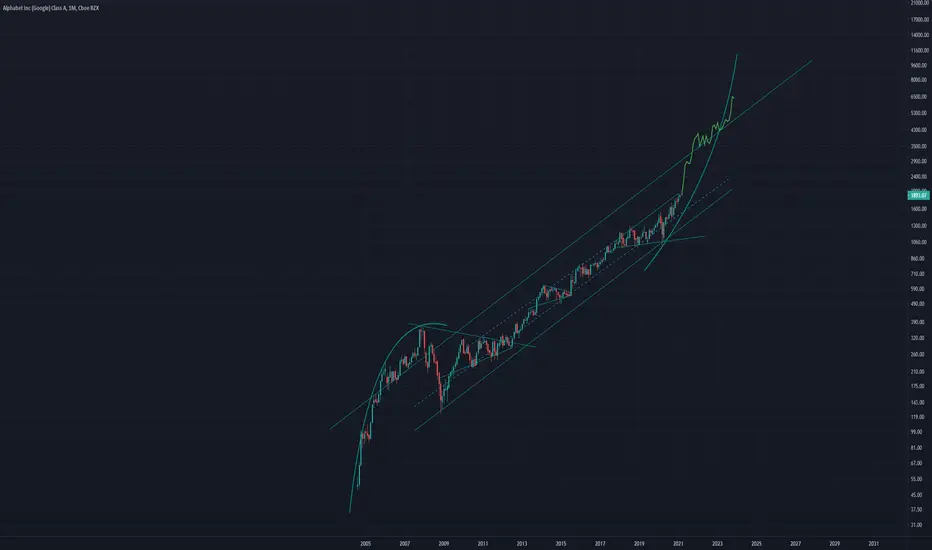
Google (GOOGL) |The best area to climb🔥Hello traders, Google in daily timeframe , this analysis has been prepared in daily timeframe but has been published for a better view in 2 day timeframe.
The waves that we counted are the main waves 1 and 2 and the rest of the waves are related to the microwaves of the main wave 3.
From these microwaves, waves 1 and 2 are over and now we are inside wave 3.
Wave 3 itself forms wave 4 at a lower level.
This wave 4 can be counted as triangles and flats, and both patterns are probably in their last microwave.
It is expected that after one descent, correction and another descent, an upward movement corresponding to a 5 out of 3 out of 3 wave will be formed, and this movement will be confirmed after breaking the upper side of the channel.
But if this channel is broken, the counting will be fielded downwards and an upward movement will take place in another area.
🙏If you have an idea that helps me provide a better analysis, I will be happy to write in the comments🙏
❤️Please, support this idea with a like and comment!❤️
Googlelong

Google (GOOGL) |The best area for correction♻️Hello traders, Google in daily timeframe , this analysis has been prepared in daily timeframe but has been published for a better view in 2 day timeframe.
The waves that we counted are the main waves 1 and 2 and the rest of the waves are related to the microwaves of the main wave 3.
From these microwaves, waves 1 and 2 are over and now we are inside wave 3.
Wave 3 itself forms Wave 4 at a lower level.
This wave has 4 triangular patterns, which is in its last wave, ie wave e, which has the ability to return from the same range and can even continue this downward movement up to Fibo 0.5.
To confirm further movement, it is necessary to break the current range (price 2660) downwards.
🙏If you have an idea that helps me provide a better analysis, I will be happy to write in the comments🙏
❤️Please, support this idea with a like and comment!❤️

Google (GOOGL) | The last target to climb🔥Hello traders, Google in daily timeframe , this analysis has been prepared in daily timeframe but has been published for a better view in 2 day timeframe.
The waves that we counted are the main waves 1 and 2 and the rest of the waves are related to the microwaves of the main wave 3.
From these microwaves, waves 1 and 2 are over and now we are inside wave 3.
Wave 3 itself forms Wave 4 at a lower level.
According to its current structure, this wave 4 has formed a complex pattern, ie double zigzag, and now the ascent is related to wave 5 from wave 3 to wave 3, and if it is confirmed that it will make another ascent, otherwise it is still inside wave 4 and the structure Wave 4 is a triangular structure that requires a half of the previous wave and a maximum of up to 0.50 Fibonacci to complete the minimum drop.
❤️Please, support this idea with a like and comment!❤️

GOOGL post earnings and stock split announcementAAPL and TSLA did a stock split in 2020. So I use those to get an idea of what GOOGL can do after it's announcement. AAPL from announcement to stock split went up about 35%, and TSLA went up 80%. I don't know how much GOOGL will go up but I am going to buy bull call verticals for the next several weeks.

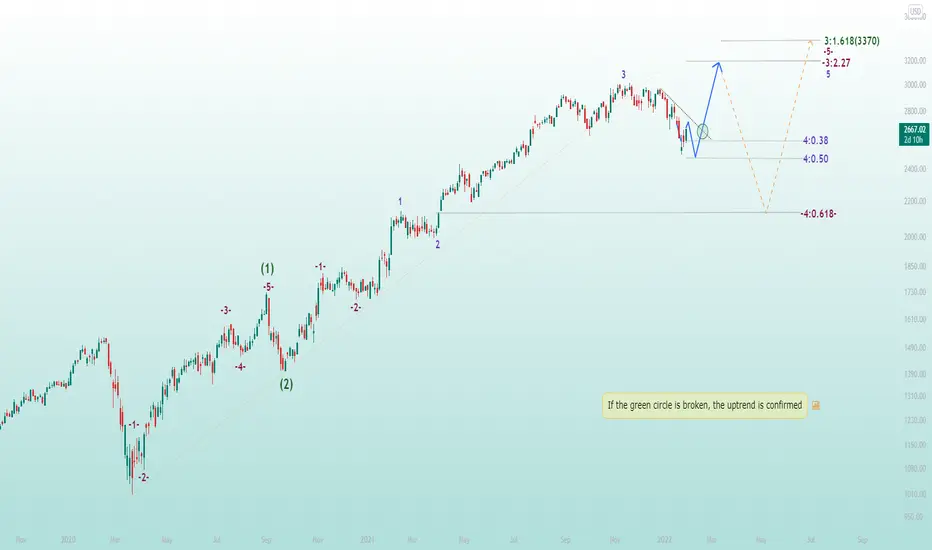
Google (GOOGL) | The best point to buy🔥Hello traders, Google in daily timeframe , this analysis has been prepared in daily timeframe but has been published for a better view in 2 day timeframe.
In the wave count we had, the first wave 1 and 2 were formed, and now we are inside the wave of the main 3 wave.
From this wave, waves 1 and 2 are formed and wave 3 of wave 3 is being formed.
This wave 3 is inside its wave 4 wave and the wave 4 pattern is not clear, but the probability we give is in its last wave wave and we expect it to climb to Fibo 2.27 after breaking the trend line and then a downward movement will be formed for wave 4 from wave 3. .
The basis of the ascent for us will be the breaking of the green circle and the trend line. Also, this ascent can be part of the correction, and it should be said that another descent to the previous price floor will probably take place before this ascent.
🙏If you have an idea that helps me provide a better analysis, I will be happy to write in the comments🙏
❤️Please, support this idea with a like and comment!❤️
Google (GOOGL) | The best area to buy📍Hello traders, Google in daily timeframe , this analysis has been prepared in daily timeframe but has been published for a better view in 2 day timeframe.
According to our count, this share consists of the main waves 1 and 2, and the trend is within the waves of wave 3.
1 and 2 microwaves are composed of this wave and 4 and 5 microwaves are being completed.
That is, we are now inside wave 4 of wave 3 of wave 3.
Wave 4 is probably zigzagged, and from this zigzag the a and b waves are over, and now wave c is forming.
Wave c is probably in the form of a leading triangle, and a drop is needed to complete this triangle, which we think will end around Fibo 0.38 for wave 4.
And then the ascent for wave 5 from wave 3 to the range of 3000 and here wave 3 from wave 3 is completed and a relatively deep correction for wave 4 will begin.
🙏If you have an idea that helps me provide a better analysis, I will be happy to write in the comments🙏
❤️Please, support this idea with a like and comment!❤️

GOOGL ALPHABET | Shows Potential Uptrend!When it comes to GOOG Alphabet , right now it is in a downtrend and it is likely to get support at S1; which is near 2850. Since it is showing the bearishness, you might see a gap down. If gap down doesn’t happen, I wouldn’t recommend you to take the short position unless you get a pull back. When price reaches S1, you may go long while using S1 as a support area . And if you do, make sure to place the stop below the S1. Once you are in, you first exit should be at T1, which might act as a resistance area since we seen two strong rejections there.
If you find this technical analysis useful, please like & share our ideas with the community.
What do you think is more likely to happen? Please share your thoughts in comment section. And also give a thumbs up if you find this idea helpful. Any feedback & suggestions would help in further improving the analysis.
Good Luck!
Disclaimer!
This post does not provide financial advice. It is for educational purposes only! You can use the information from the post to make your own trading plan for the market. But you must do your own research and use it as the priority. Trading is risky, and it is not suitable for everyone. Only you can be responsible for your trading.

Google (GOOGL) | The best area to buy🔥Hello traders, Google in daily timeframe , this analysis has been prepared in daily timeframe but has been published for a better view in 2 day timeframe.
Based on our investigations of this share, we found that the first wave 1 and 2 are over and the wave we counted is part of wave 3.
We assume that the counted wave was wave 5 of wave 3 or wave 5 of wave 3 of wave 3.
In the count we did, waves (1) and (2) are over and wave 3 microwaves are forming.
From wave 3, waves 1 and 2 are completed and now the structure of wave 3 is completed.
From this structure, a wave 4 is confirmed by the break of the trend line , which is likely to end on Fibo 0.38, and the climb for wave 5 from 3 to Fibo 2.27, ie the price of 3000, will start slightly above the current peak.
And then we have the descent for wave-4, we did not consider a field point in this analysis.
🙏If you have an idea that helps me provide a better analysis, I will be happy to write in the comments🙏
❤️Please, support this idea with a like and comment!❤️

GOOG - STOCKS - 18. OCT. 2021Welcome to our Weekly V2-Trade Setup ( GOOG ) !
-
4 HOUR
Great technical structure..
DAILY
Expecting more bullish price action.
WEEKLY
Market still underpriced!
-
STOCK SETUP
BUY GOOG
ENTRY LEVEL @ 2840.56
SL @ 2724.25
TP @ Open
Max Risk: 0.5% - 1%!
(Remember to add a few pips to all levels - different Brokers!)
Leave us a comment or like to keep our content for free and alive.
Have a great week everyone!
ALAN


10/31/21 GOOGLAlphabet Inc (Google) Class A ( NASDAQ:GOOGL )
Sector: Technology Services (Internet Software/Services)
Current Price: $2960.92
Breakout price trigger: $2925.00 (hold above)
Buy Zone (Top/Bottom Range): $2900.00-$2815.00
Price Target: $3100.00-$3122.00 (1st), $3390.00-$3425.00 (2nd)
Estimated Duration to Target: 10-11d (1st), 32-35d (2nd)
Contract of Interest: $GOOGL 11/12/21 3000c, $GOOGL 12/17/21 3200c
Trade price as of publish date: $33.50/contract, $24.90/contract

Told about it 3 weeks ago (GOOGL)Hello everyone , as we all know the market action discounts everything :)
_________________________________Make sure to Like and Follow if you like the idea_________________________________
3 weeks ago on july 6 i posted an idea about the Google stock and how its seems to be in a strong bullish movement and today we see that come to life , the price has risen up by almost 12% in the last few weeks alone reaching 2805.07 an all time high .
The price of the stock is at 2721.88 in an upward channel and the Stock bullish movement doesnt seems to be stopping yet as we could be seeing the price hitting the resistance lines at 2797.40 and 2926.80 which would be huge for the shareholders .
different indicators showing that where :
1) The market price trading way above the 50 MA and EMA .(bullish sign)
2) The RSI is at 82.51 showing great strength in the Stock and sitting in overbought zone with no noticeable divergences.(bullish sign)
3)The MACD histogram showing good momentum with a positive crossover happening (bullish sign)
The alternative scenario would be if the price dropped down and hit the support line at 2531.00 which could determine the outcome for this stock but the possibility of this happening is around 5% to 9%. note that we did see a shooting star pattern on jul 12 which is a bearish sign but it was proven false when the market jumped up.
After all the long and short term trends are both positive. and Volume is considerably higher in the last couple of days, which is what you like to see during a strong movement up.
Support & Resistance points :
support Resistance
1) 2531.0 1) 2728.9
2) 2401.6 2) 2797.4
3) 2333.1 3) 2926.8
This is my personal opinion , not financial advice.
If you have any questions please ask and have a great day !!
Thank you for reading.

GOOGLE / GOOGThe Google stock will start in a downtrend from the area shown on the chart
first target 2394
second target 2122


will google broke the highest resistance or return marketGoogle records the highest since inseption we have resistance if he broke it we must to records new highest but if not the market up down

$GOOGL ATH!All time highs today after that morning shake-out. Looked a little bit weak at first but came back strong and held the EMAs. A close above 2430 was the queue for a larger move towards 2450 as it cleared the 1.618 Fib level and confirms the continuation of the impulsive move upwards. The open tomorrow should tell us if this was just a test of the highs or if it will continue running. Early morning flows and market close flows are telling of the bullish bias that whales have on GOOGL. Those sweeps targeted the 2430 weeklies at open and the 2435 towards close.

GOOGLE / GOOGIt is moving in an upward direction
it will correct a little
Going to the support areas shown on the chart
and then returning to complete the upward trend to the target

US Stock In Play: $GOOGL (Alphabet Inc)$GOOGL broke out of its trendline resistance this week, with an accumulated gain of +8.03% in 3 days. The breakout of $GOOGL comes after a full month of whipsaw that is witnessed on its 20DMA, along with a congested price action that is displayed within a Symmetrical Triangle chart pattern.
$GOOGL currently closed at $2239.03, with a display of a bullish flag formation targeting towards $2,350 level.
$GOOGL provides online advertising services in the United States, Europe, the Middle East, Africa, the Asia-Pacific, Canada, and Latin America. The company offers performance and brand advertising services. It operates through Google Services, Google Cloud, and Other Bets segments.


GOOGLE -- It keeps getting stuckAs can be seen in the chart, there is a great squeeze in both prices and RSI. This is a bit scary of course ...
This tightness can continue up to the level of 2200$ or even 2400 $, but then we think it is very likely that we will see a big selling pressure for both the relaxation of the indicators and the completion of the technical formation formed by the prices.
We are not at the beginning of April anymore. It has been almost a year and the Nasdaq have an unstoppable rising. We wonder where will he stand ???
It contains only personal views and opinions. Does not contain legal investment advice ...

Google - buy setupGood morning ladies and gentlemen, here is my trade plan for Google.
If current projection holds, Google could see min. $2296.
If we break below $1995.49, the projection will be invalidated.
Give me a follow and I will post more charts.
Good luck and trade safe.

GOOGLE target to $2119 +22% Google $GOOGL has activated a second impulse to $2119, +22% from current price.

GOOGL Clear uptrendBreakout idea
GOOGLE is going to be a major influencer in the next generation of computing and people, as it is today
Hence the large breakout from the upward channel, and seemingly symmetry with the earlier days of google