Alphabet (GOOGL) Stock Chart Analysis Following Earnings ReleaseAlphabet (GOOGL) Stock Chart Analysis Following Earnings Release
Earlier this week, we highlighted the prevailing bullish sentiment in the market ahead of Alphabet’s (GOOGL) earnings report, noting that:
→ an ascending channel had formed;
→ the psychological resistance level at $200 was of particular importance.
The earnings release confirmed the market’s optimism, as the company reported better-than-expected profits, driven by strong performance in both its advertising and cloud segments.
In his statement, CEO Sundar Pichai noted that AI is positively impacting all areas of the business, delivering strong momentum.
The company is expected to allocate $75 billion this year to expand its AI capabilities.
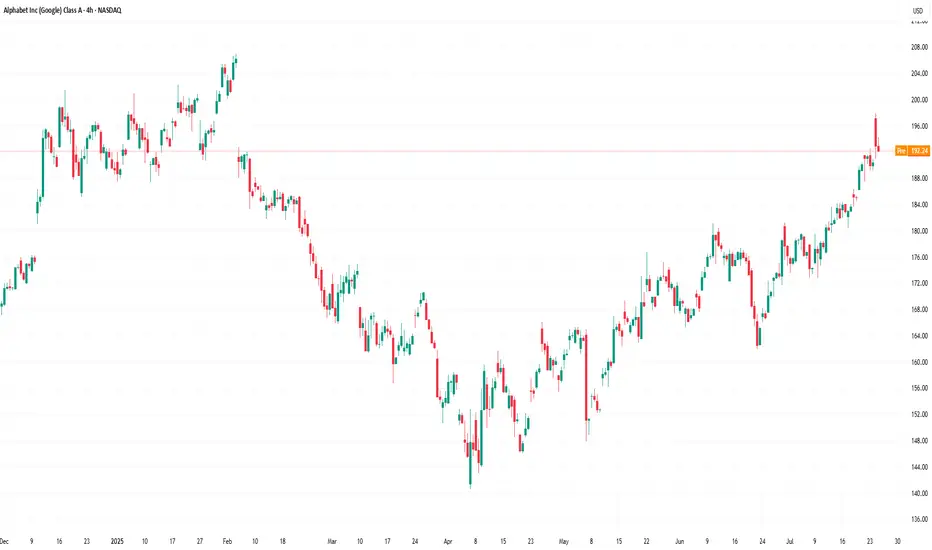
As a result, Alphabet (GOOGL) opened yesterday’s trading session with a bullish gap (as indicated by the arrow). However, as the session progressed, the price declined significantly, fully closing the gap.
This suggests that:
→ the bulls failed to consolidate their gains, allowing the bears to seize the initiative;
→ the ascending channel remains valid, with yesterday’s peak testing its upper boundary;
→ such price action near the $200 level reinforces expectations that this psychological mark will continue to act as resistance.
It is possible that the positive sentiment following the earnings report may weaken in the near term. Accordingly, traders may consider a scenario in which Alphabet’s (GOOGL) share price retraces deeper into the existing ascending channel. In this case, the former resistance levels at $180 and $184 may serve as a support zone.
This article represents the opinion of the Companies operating under the FXOpen brand only. It is not to be construed as an offer, solicitation, or recommendation with respect to products and services provided by the Companies operating under the FXOpen brand, nor is it to be considered financial advice.
Googlestocks
Alphabet (GOOGL) Stock Approaches $200 Ahead of Earnings ReleaseAlphabet (GOOGL) Stock Approaches $200 Ahead of Earnings Release
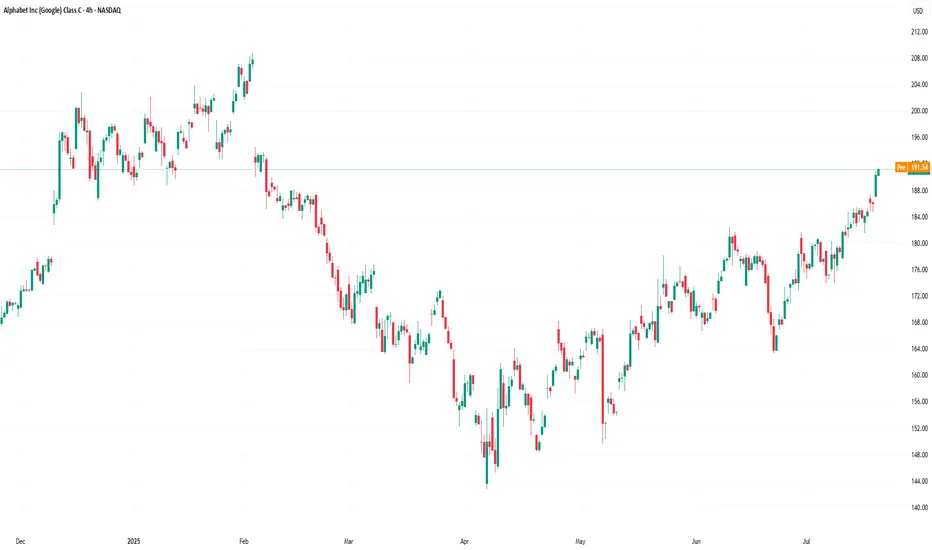
According to the Alphabet (GOOGL) stock chart, the share price rose by more than 2.5% yesterday. Notably:
→ the price reached its highest level since early February 2025;
→ the stock ranked among the top 10 performers in the S&P 500 by the end of the day.
The positive sentiment is driven by expectations surrounding the upcoming quarterly earnings report, scheduled for release tomorrow, 23 July.
What to Know Ahead of Alphabet’s (GOOGL) Earnings Release
According to media reports, Wall Street analysts forecast Alphabet’s Q2 revenue to grow by approximately 11% year-on-year, with expected earnings per share (EPS) of around $2.17 — up from $1.89 a year earlier. Notably, the company has consistently outperformed estimates for nine consecutive quarters, setting a positive tone ahead of the announcement.
Despite the optimism, investors are closely monitoring two key areas:
→ Cloud computing competition , where Google Cloud contends with Microsoft Azure and Amazon AWS;
→ Growing competition in the search sector , linked to the rise of AI-based platforms such as ChatGPT.
In response, Alphabet is significantly increasing its capital expenditure on AI infrastructure, planning to spend around $75 billion in 2025. These investments are aimed at both defending its core search business and advancing the Gemini AI model, while also strengthening Google Cloud’s market position.
Technical Analysis of Alphabet (GOOGL) Stock
Since April, GOOGL price fluctuations have formed an ascending channel (marked in blue).
From a bullish perspective:
→ the June resistance level at $180 has been breached and may soon act as support;
→ previous bearish reversals (marked with red arrows) failed to gain momentum, suggesting sustained demand is pushing the price higher.
From a bearish standpoint, the price is approaching:
→ the psychological level of $200, which has acted as a major resistance since late 2024;
→ this barrier may be reinforced by a bearish gap formed in early February.
Strong results from the previous quarter, combined with optimistic forward guidance from Alphabet’s management, could provide bulls with the confidence needed to challenge the $200 level.
This article represents the opinion of the Companies operating under the FXOpen brand only. It is not to be construed as an offer, solicitation, or recommendation with respect to products and services provided by the Companies operating under the FXOpen brand, nor is it to be considered financial advice.
$GOOG $GOOGL IS A GIFT RIGHT NOW. YOU WILL SEE! NASDAQ:GOOG NASDAQ:GOOGL
IS A GIFT. YOU WILL SEE!👀
1.) High Five Setup
2.) Inverse H&S Breakout/will retest and fill earnings GAP then head to the Measure Move (MM) of $193.
3.) They just demolished earnings and everyone was bullish until the market decided to pull back. Everyone just forgot about the ones who reported first out the MAG7.
What do you think? Is this the easiest trade you've ever seen? IMO it's definitely one of them haha
"BE GREEDY WHEN OTHERS ARE FEARFUL"-WB
NFA

GOOGL with a strong upward breakthrough this weekGOOGL with a strong upward breakthrough this week
This chart shows the weekly candle chart of Google stock over the past year. The graph overlays the bottom to top golden section at the end of 2022. As shown in the figure, Google stock tested the bottom of the chart against the 2.618 position of the golden section three times in July and last week, with a strong upward breakthrough this week! The recent pressure level of Google stock is the 3.000 level at the bottom of the graph above the golden section, which is likely to suppress the market's rise! Google stock is likely to significantly retreat in the future, at least testing the 2.000 position of the golden section in the chart!

Google Alphabet Movement Prediction In this idea I show Google's movement as I see it playing out. I have been moving into different types of charts to challenge myself as I grow my skills. I have to say I think I will like charting stocks as they each are pretty unique and are in their own right a puzzle to solve. I see this movement as Google's struggle to figure out where they belong in an ever changing digital world as some of their products grow stagnant and are being outshined by such things as Amazon Web Services. If you agree throw me a like and follow me for more unique concepts and ideas that keep you in the gains.

Trade Setup For Google stockGoogle stock is likely to keep dropping for now.
Going back to 2020 Covid19 zone.

GoogSince I think Fair Price to Intrinsic Value of GOOG is so high I believe we must be careful in case of entering a long position.
I'll update this analysis. We may buy a little more expensive, but we will be more confident in making a profit.


Alphabet inc price ForecastMassive head and shoulders visible on the weekly and daily chart, targets and approximate dates on the chart.
