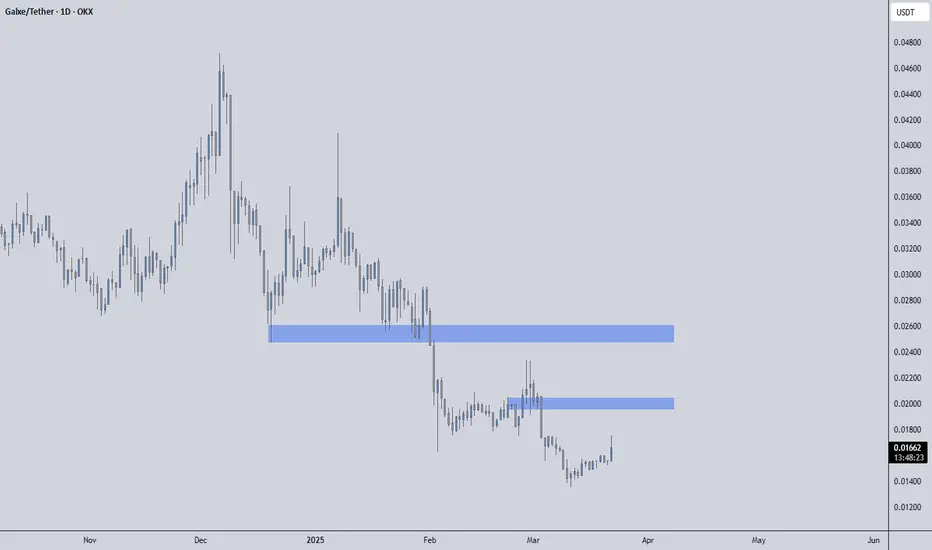
GUSDT – Blue Boxes Mark the Resistance Zones! “We're at a critical level—can buyers push through or will resistance hold?”
🔥 Key Insights:
✅ Blue Boxes = Resistance Zones – Expect strong reactions here.
✅ Rejection = Short Setup – But only with LTF breakdown confirmation.
💡 The Smart Plan:
Watch Lower Time Frames (15M & 1H) – Look for breakouts or rejections.
CDV & Volume Profile Must Align – Smart traders wait for confirmation.
React, Don’t Predict – Trade based on what the market shows.
“Patience and confirmation are key—let’s see what the blue boxes tell us!” 📈🔥
A tiny part of my runners:
🎯 ZENUSDT.P: Patience & Profitability | %230 Reaction from the Sniper Entry
🐶 DOGEUSDT.P: Next Move
🎨 RENDERUSDT.P: Opportunity of the Month
💎 ETHUSDT.P: Where to Retrace
🟢 BNBUSDT.P: Potential Surge
📊 BTC Dominance: Reaction Zone
🌊 WAVESUSDT.P: Demand Zone Potential
🟣 UNIUSDT.P: Long-Term Trade
🔵 XRPUSDT.P: Entry Zones
🔗 LINKUSDT.P: Follow The River
📈 BTCUSDT.P: Two Key Demand Zones
🟩 POLUSDT: Bullish Momentum
🌟 PENDLEUSDT.P: Where Opportunity Meets Precision
🔥 BTCUSDT.P: Liquidation of Highly Leveraged Longs
🌊 SOLUSDT.P: SOL's Dip - Your Opportunity
🐸 1000PEPEUSDT.P: Prime Bounce Zone Unlocked
🚀 ETHUSDT.P: Set to Explode - Don't Miss This Game Changer
🤖 IQUSDT: Smart Plan
⚡️ PONDUSDT: A Trade Not Taken Is Better Than a Losing One
💼 STMXUSDT: 2 Buying Areas
🐢 TURBOUSDT: Buy Zones and Buyer Presence
🌍 ICPUSDT.P: Massive Upside Potential | Check the Trade Update For Seeing Results
🟠 IDEXUSDT: Spot Buy Area | %26 Profit if You Trade with MSB
📌 USUALUSDT: Buyers Are Active + %70 Profit in Total
🌟 FORTHUSDT: Sniper Entry +%26 Reaction
🐳 QKCUSDT: Sniper Entry +%57 Reaction
📊 BTC.D: Retest of Key Area Highly Likely
Gravity
Is LCID Ready to Defy Gravity?!Here I have NASDAQ:LCID on the Daily Chart.
Price has been wrestling with the ( $2.55 - $2.30 ) area all 2024, but with the new Gravity SUV finally in production:
www.tradingview.com
along with tension easing from speculation on what the Trump Administration plans to do with the EV Sector:
www.tradingview.com
We could see Price on NASDAQ:LCID take off!
Since the August High's @ ( $4.43 - $4.25 ), Price has been following a Falling Resistance but we see on Dec. 6th, Price not only became extremely Bullish testing the Falling Resistance from underneath but also:
-Built Massive Bullish Volume
-RSI Pushed Above 50
-Followed by a Bullish Candle Close outside of the Falling Resistance to start the week on Dec. 9th.
*Suggesting Market Sentiment is changing and Bulls could be getting ready to take over!
Today on the 11th we see Price has made a Pullback to the Falling Resistance to Retest the Break @ $2.28 and is currently trading up to $2.35 showing a good Bullish reaction to the Lower Prices now!
We must continue to see RSI stay Above 50 and Bullish Volume remain dominant upon Prices rise along with good output from the new product line and the company continuing to gain investing support!

BTC at weak resistanceThe absence of Cosmic Markers while the price is hovering below Cosmic Gravity Major Resistance is a bullish signal. If the price breaks through on up the next level to watch will be Cosmic Gravity Top Resistance

Cosmic Gravity near term resistanceOn the 1H timeframe the price is holding above Bottom Support and on the 15 minute the price has gone back up above Bottom Support while the Basis Line has turned bullish, suggesting a bullish movement is next.
The next common resistance for these timeframes intersects at 1H Major Support and 15 minute Basis Line .

ETH 1D bullish signals and target1D ETHUSD has broken above the Cosmic Gravity support channel and found new resistance at the bottom of the inner channel. Should it also break above this resistance the next minor ceiling is where the target is placed.

SPX at overlapping resistanceSPX price has risen to high-maximum resistance on multiple timeframes while showing few bullish signs, suggesting a drop is likely. The short target is set at the extrapolated 1W Cosmic Gravity resistance channel top.

EURAUD reversal with short targetThe 2h chart points show that if the price fails the current test of the Cosmic Channel Lite basis line from below, the next major support will be the top of the Cosmic Gravity support channel, where the short target is placed. Since the price is right below a major resistance level, the stop is placed only slightly above it.

1W EURUSD at point of inflectionWhile on the long-term upswing EURUSD has arrived at the Cosmic Gravity basis line, a major resistance level. If this level should be broken sudden positive volatility may be expected. If the test fails a retest can be expected.

UK 10 Year Bonds 3D short targetThe chart points show mostly bearish signals as the price peaks and starts breaking down through several major levels across 3 timeframes. The short target is set at a level where the next largest support levels overlap on all 3 timeframes and the short is set at the extrapolated max 3D resistance.

Alibaba high TF reversalAlibaba stock has reached 3 major Cosmic Gravity resistance levels on each of the 1D, 6h, and 1h timeframes. Since the upswing has been going on for some time it is possible to assume that a reversal is likely.

Real Estate sector ST bullish forecastAlthough the general momentum is now downwards, as outlined in the chart the 3 indicators give several bullish signs which can be taken into consideration in the short-term. The Cosmic Gravity basis line can be the next resistance target.

Mitsubishi Heavy Ind cosmic predictionThe points outlined in the chart give off a bearish vibe for MITSUBISHI HEAVY INDUSTRIES, at least until the next support level (dashed line).

Gravity ready to drop? Gravity
Short Term
We look to Sell at 52.99 (stop at 55.66)
Bespoke resistance is located at 55.00. Choppy price action seen. Our outlook is bearish. Selling spikes offers good risk/reward. The rally was sold and the dip bought resulting in mild net losses yesterday.
Our profit targets will be 43.20 and 41.20
Resistance: 53.00 / 60.00 / 65.00
Support: 43.00 / 40.00 / 30.00
Disclaimer – Saxo Bank Group. Please be reminded – you alone are responsible for your trading – both gains and losses. There is a very high degree of risk involved in trading. The technical analysis, like any and all indicators, strategies, columns, articles and other features accessible on/though this site (including those from Signal Centre) are for informational purposes only and should not be construed as investment advice by you. Such technical analysis are believed to be obtained from sources believed to be reliable, but not warrant their respective completeness or accuracy, or warrant any results from the use of the information. Your use of the technical analysis, as would also your use of any and all mentioned indicators, strategies, columns, articles and all other features, is entirely at your own risk and it is your sole responsibility to evaluate the accuracy, completeness and usefulness (including suitability) of the information. You should assess the risk of any trade with your financial adviser and make your own independent decision(s) regarding any tradable products which may be the subject matter of the technical analysis or any of the said indicators, strategies, columns, articles and all other features.
Please also be reminded that if despite the above, any of the said technical analysis (or any of the said indicators, strategies, columns, articles and other features accessible on/through this site) is found to be advisory or a recommendation; and not merely informational in nature, the same is in any event provided with the intention of being for general circulation and availability only. As such it is not intended to and does not form part of any offer or recommendation directed at you specifically, or have any regard to the investment objectives, financial situation or needs of yourself or any other specific person. Before committing to a trade or investment therefore, please seek advice from a financial or other professional adviser regarding the suitability of the product for you and (where available) read the relevant product offer/description documents, including the risk disclosures. If you do not wish to seek such financial advice, please still exercise your mind and consider carefully whether the product is suitable for you because you alone remain responsible for your trading – both gains and losses.

Gravity...to the moon? Gravity
Short Term - We look to Buy at 54.02 (stop at 48.54)
Further upside is expected although we prefer to buy into dips close to the 54.02 level. Posted a Double Bottom formation. The formation has a measured move target of 71.31. Although selling has been posted overnight, the selloff has been limited.
Our profit targets will be 71.31 and 79.10
Resistance: 55.00 / 64.00 / 115.00
Support: 43.00 / 34.00 / 22.00
Disclaimer – Saxo Bank Group. Please be reminded – you alone are responsible for your trading – both gains and losses. There is a very high degree of risk involved in trading. The technical analysis, like any and all indicators, strategies, columns, articles and other features accessible on/though this site (including those from Signal Centre) are for informational purposes only and should not be construed as investment advice by you. Such technical analysis are believed to be obtained from sources believed to be reliable, but not warrant their respective completeness or accuracy, or warrant any results from the use of the information. Your use of the technical analysis, as would also your use of any and all mentioned indicators, strategies, columns, articles and all other features, is entirely at your own risk and it is your sole responsibility to evaluate the accuracy, completeness and usefulness (including suitability) of the information. You should assess the risk of any trade with your financial adviser and make your own independent decision(s) regarding any tradable products which may be the subject matter of the technical analysis or any of the said indicators, strategies, columns, articles and all other features.
Please also be reminded that if despite the above, any of the said technical analysis (or any of the said indicators, strategies, columns, articles and other features accessible on/through this site) is found to be advisory or a recommendation; and not merely informational in nature, the same is in any event provided with the intention of being for general circulation and availability only. As such it is not intended to and does not form part of any offer or recommendation directed at you specifically, or have any regard to the investment objectives, financial situation or needs of yourself or any other specific person. Before committing to a trade or investment therefore, please seek advice from a financial or other professional adviser regarding the suitability of the product for you and (where available) read the relevant product offer/description documents, including the risk disclosures. If you do not wish to seek such financial advice, please still exercise your mind and consider carefully whether the product is suitable for you because you alone remain responsible for your trading – both gains and losses.

Proof that Gravity exists! Gravity
Short Term - We look to Sell at 55.14 (stop at 59.41)
Bespoke resistance is located at 55.00. A Doji style candle has been posted from the high. Our outlook is bearish. Selling spikes offers good risk/reward. The rally was sold and the dip bought resulting in mild net losses yesterday.
Our profit targets will be 43.09 and 41.20
Resistance: 55.00 / 60.00 / 65.00
Support: 43.00 / 40.00 / 30.00
Disclaimer – Saxo Bank Group. Please be reminded – you alone are responsible for your trading – both gains and losses. There is a very high degree of risk involved in trading. The technical analysis, like any and all indicators, strategies, columns, articles and other features accessible on/though this site (including those from Signal Centre) are for informational purposes only and should not be construed as investment advice by you. Such technical analysis are believed to be obtained from sources believed to be reliable, but not warrant their respective completeness or accuracy, or warrant any results from the use of the information. Your use of the technical analysis, as would also your use of any and all mentioned indicators, strategies, columns, articles and all other features, is entirely at your own risk and it is your sole responsibility to evaluate the accuracy, completeness and usefulness (including suitability) of the information. You should assess the risk of any trade with your financial adviser and make your own independent decision(s) regarding any tradable products which may be the subject matter of the technical analysis or any of the said indicators, strategies, columns, articles and all other features.
Please also be reminded that if despite the above, any of the said technical analysis (or any of the said indicators, strategies, columns, articles and other features accessible on/through this site) is found to be advisory or a recommendation; and not merely informational in nature, the same is in any event provided with the intention of being for general circulation and availability only. As such it is not intended to and does not form part of any offer or recommendation directed at you specifically, or have any regard to the investment objectives, financial situation or needs of yourself or any other specific person. Before committing to a trade or investment therefore, please seek advice from a financial or other professional adviser regarding the suitability of the product for you and (where available) read the relevant product offer/description documents, including the risk disclosures. If you do not wish to seek such financial advice, please still exercise your mind and consider carefully whether the product is suitable for you because you alone remain responsible for your trading – both gains and losses.

GRVY bullish wave 3 startedGravity seems bullish, working towards finalizing wave (3) same as Nasdaq

Aesthetic Analysis Reveals More Work for GravityThe implied center of gravity (shown in the graph) is still the effecting force as BTC didn't complete the bearish pattern. Previously, I expected a fall to the 30K line (where we are right now, more or less), followed by a flattening and then an eventual rise. Falling to 20K was the worst case scenario I estimated. Now, however, the price and volume changes of the past few days are on the fainter direction, and another slip seems imminent giving the momentum of the free fall of the past 2 weeks. The support level is clear at 20K through the POC and the horizontal range. I expect a quicker slip rather than a delayed one because the harmonic patterns are indicating so. If the price falls to 20K in the coming days, as I expect, it should be followed by a period of flattening for the RSI to cool off before the next bull. This should take a few months.
We already missed the springing point of 40K as the lower support, so the people who are dreaming about 300K very soon are just delusional.

Is Etherium leaving the nest?Currently and since a few days, Etherium (even the classic one) is up, while Bitcoin and co are unprecedentedly down. The gap between the two movements is the widest in favor of the former since long time, and is definitely the most telling given the recent moves. Technical indicators are even showing that BTC could find support as low as 45K. Of course, this is bad news for an industry largely hanging on the reputation of the father of crypto, and one which was a few days ago celebrating the IPO of Coinbase. Amid this downward storm, ETH was breaking the highest mark in, what it looks like, a breakaway from the tradition following its parent.
The maturity of ETH as an independent entity was long in the making, in reality rather than on the charts. Etherium is the basis of the infrastructure of most other coins, the home of many decentralized blockchain apps, and the underlying technology fuelling the recent NFT bubble. It has the other benefit of not being in the attacking zone as BTC, being considered at times as the black horse, even if it is actually the second in the race from the beginning. This aura of being "alternative" rises from the extreme popularity of BTC, the latter of which is becoming extremely volatile due to its extreme success.
Nothing keeps going up indefinitely as corrections will always happen. If the BTC graph was that of a srtock, we would consider it an extreme success, but since almost everyone has unrealistic expectations of it, a slight correction is considered a disaster. Keeping this in mind, I would be careful investing too much in BTC because it is overloaded, targeted, and, arguably unlike Etherium, unsupported by a utility ecosystem. My long term view is that as confidence in BTC starts to fade due to its volatility, Etherium would start to emerge more as an adult rather than an adolescent. That is until they meet somewhere in the middle.
In short, I expect the gap between BTC and ETH to diminish on the long term.

Volatility - Supersymmetric ConvergenceIdea for VIX:
Momentum, Value, and Earth strings are once again about to meet, creating Volatility.
The Black Swan's supergravity is inevitable...
Soon the loop will be closed.
GLHF,
DPT
Disclaimer:
We absolutely do not provide financial advice in any shape or form. We do not recommend investing based on our opinions and strongly cautions that securities trading and investment involves high risk and that you can lose a lot of money. Loss of principal is possible. We do not recommend risking money you cannot afford to lose. We do not guarantee future performance nor accuracy in historical analyses. We are not registered investment advisors. Our ideas, opinions and statements are not a substitute for professional investment advice. We provide ideas containing impersonal market observations and our opinions. Our speculations may be used in preparation to form your own ideas.

GravityFundamental: South Korean game company who has just entered the gigantic chinese market with a new game making it interesting to follow.
Technically: the stock has broken the long term line of resistance and continues to grow into higher placed trend lines as market on the graph. I believe that both the RSI and MacD indicators show a newly found momentum to bring this stock even closer to the skt, combined with the trade deal with the chinese market.

Gravity's force will bring the BTCUSD down from the 12300 price!The force of gravity will bring the BTCUSD down on the 12300 price !!
After doing an exhaustive analysis, about trends, harmonic patterns, Elliot's waves, continuation and reversal patterns, I have come to the conclusion that the BTCUSD will probably be falling from the sky due to the force of gravity of the price, and we will probably see it in floor.
AT 12300
SL: 14290
Final TP: 6351


$SPY Bearish GravityLooking at this weekly SPY, if you consider that the inner channel is a "fair value" rate increase in value and that the blue channel is the extreme away from fair value signifying "over-excitement", then perhaps we can conclude there may be more downside to correct and balance out this "over-excitement" with an equal and opposite reaction.
#260 ???
