A BNPL Bubble Is Actually Why I'm Bullish, For NowBNPL is growing and inflating at an increasing rate. From concert tickets to burritos, everyone is using buy now pay later. The global market is projected to hit 560 billion dollars in 2025, up from around 492 billion in 2024, and climb to 912 billion by 2030 at a compounding growth rate of 10.2%. Just in the U.S. alone, demand is expected to reach 122 billion next year and scale to 184 billion by the end of the decade. The trajectory is steep, with the structural weaknesses already showing.
Block is positioned at the center of BNPL. In Q1 2025 they reported:
2.29 billion in gross profit, up 9 percent YoY
466 million in adjusted operating income, up 28%
10.3 billion in GMV through Afterpay, with 298 million in BNPL gross profit, up 23% YoY
The stock took a hit. It dropped 9 percent in February and another 21 percent after missing Q1 earnings, but this is seen as typical early bubble behavior. There is short term fear but continuing growth and acceleration. Klarna’s credit losses, IPO delays, and regulatory friction are not problems, they are actually signals that the sector is growing faster than the market, or quite frankly, anyone can control.
BNPL is becoming the default credit system for younger consumers. It is overused and expanding too fast. That is the formula for both upside and implosion. However with that, timing will be everything here, and knowing when to close will be crucial if BNPL can't stabilize.
Baseline expectation: SQ trades in the 80 to 90 range in the short term
Midterm upside: 120 by 2027
Long-term target: 180 to 220 if BNPL stabilizes and Block captures its runway
Growth

Bitcoin- 175-200k by year's endEvery major Bitcoin move over the last decade — whether a jaw-dropping bull run or a brutal crash — has shared one silent macro trigger.
It’s not the halving.
It’s not ETF hype.
It’s not Twitter sentiment or TikTok FOMO.
👉 It’s global liquidity.
And right now, this powerful force is expanding fast — the same setup that previously drove Bitcoin from $5K to $70K in under a year.
But here’s the twist: as of today, Bitcoin is already trading near $120,000, not $20K or 30k.
That means the engine is already roaring — and if this macro thesis holds, the next stop might just be $175,000-200.000 by year's end.
________________________________________
🧠 What Is Global Liquidity, Really?
Global liquidity = the total money sloshing around the financial system.
It’s often measured through M2 money supply, combining:
• Cash
• Checking/savings deposits
• Easily accessible liquid assets
The most comprehensive view comes from Global M2, which aggregates liquidity from 20 of the world’s largest central banks.
Right now, Global M2 is not just rising — it’s breaking to all-time highs.
And if history repeats itself, Bitcoin tends to follow this wave closely.
________________________________________
📅 Past Performance: Bitcoin and Liquidity Walk Hand in Hand
Let’s break it down:
• 2016–2017: Liquidity surges → BTC +5,000%
• 2020–2021: Post-COVID easing → BTC $5K to $69K
• 2018 & 2022: Liquidity dries up → BTC crashes ~70%
It’s a recurring pattern:
Liquidity drives the crypto cycle.
________________________________________
💡 Why Liquidity Moves: Interest Rates and Central Banks
Central banks control the tap.
• 🟢 Cut rates → Easier credit → More lending → More liquidity
• 🔴 Raise rates → Tighter credit → Less spending → Liquidity contraction
In 2022, the Fed tightened hard.
🧊 U.S. money supply shrank.
📉 Bitcoin fell from $70K to $15K.
But starting August 2023, the Fed paused, then pivoted.
Since then:
• 🟢 The U.S. M2 supply rebounded
• 🟢 Global M2 began expanding again
• 🟢 Over 64 global rate cuts were made in just six months — one of the fastest global easing cycles in history
The last time we saw this much cutting? 2020.
And we all know what happened to Bitcoin then.
U.S M2
________________________________________
🟢 Today’s Setup: The Engine Is Already Running
Fast forward to mid-July 2025:
Bitcoin is no longer at $30K — it’s already testing $120K.
Intraday highs have touched $123K, with a current consolidation zone between $117K–$120K.
This isn’t a "recovery rally" — we’re already in price discovery territory.
The question now becomes:
Is $150K and above next… or are we topping out?
________________________________________
📈 Charting the Path: Bitcoin vs Global M2
When we overlay Bitcoin price over global liquidity trends, one thing becomes crystal clear:
📊 Bitcoin tracks liquidity direction.
• When money supply expands, Bitcoin rallies.
• When money dries up, Bitcoin tanks.
Given that global M2 is at record highs, and liquidity conditions are easing globally, the chart suggests there’s still plenty of fuel in the tank.
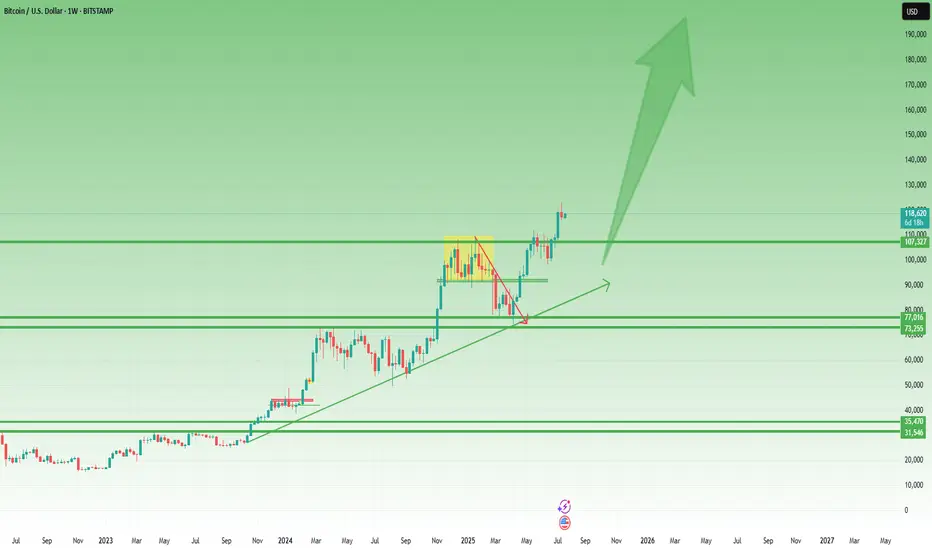
And if we follow the same growth, Bitcoin could realistically reach $175,000 before 2026 kicks in.
________________________________________
Technically:
As we can clearly see from the posted weekly chart, you don’t need to be an expert to recognize the strength of the current uptrend.
While last week printed a small bearish Pin Bar, this alone shouldn’t raise major concerns — especially considering the presence of multiple key support levels, starting from the 110K zone.
In the context of a strong and well-established trend, such candles often reflect normal short-term profit-taking, not a reversal.
🎯 Conclusion – Don’t Fight the Tide
This isn’t about hopium.
It’s not moon talk.
It’s about macro flows and monetary velocity.
Ignore the noise.
Watch what the central banks are doing.
Because Bitcoin moves not on wishful thinking, but on waves of liquidity — and the tide right now is rising fast.
Whether $175K comes by year-end, one thing is clear:
We are in the middle of a liquidity-driven expansion phase, and Bitcoin is already responding.
Stay focused, manage your risk, and don’t chase — ride the wave. 🌊
Target will hit my Targets. They are beloved by the people!Target has been re structuring there entire business after DEI was taken away.
I think they realized that going down that path is not profitable and would bankrupt them quickly if they continued.
They boosted security measures and also strengthened there online store a lot.
Target #1: $116
Target #2: $120

$PLUG long waiting for price to reclaim the base supportAfter base support i'll long after confirmation and change of character, the rsi on weely has crossed the eq and all indicators confirm a reversal and uptrend.
WIF/USDT.p Short term potentialWIF is positioned to explode! It is currently testing the neckline of a perfect cup & handle.

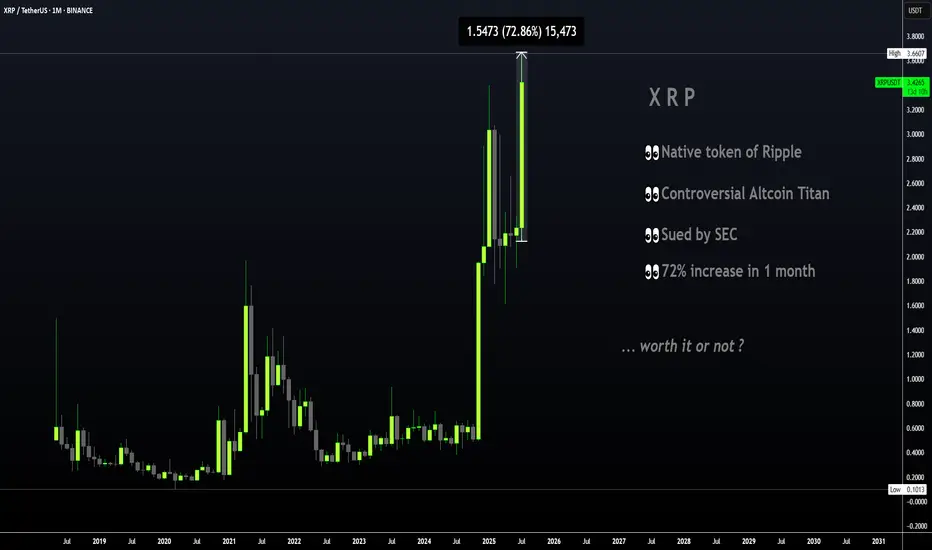
XRP | Great TP Zone is HERE for HODLERSXRP has seen a 62% increase since breaking out above the moving averages in the daily timeframe.
The previous time XRP broke out above the moving averages in the daily, the price increased around 440%:
However, with XRP being the ultimate pumper and dumper, I'll take my chances at 62%! Because this bull run has been anything but ordinary and it's best to avoid being too greedy. The price of XRP falls extremely quick, just as quick as it rises.. ( Maybe not overnight but you know, it has happened before ).
If you're one of few who bought around $1, or heck even later at $2, this is a solid increase and it should not be taken for granted. XRP has gone LONG periods without increases and often stayed behind making new ATH's when other cycles have come and gone (twice), as other alts make new ATH's. Over the years, I've made extensive posts on XRP; documented its use case, followed the SEC case closely and yet, XRP still remains one of the strangest and most unpredictable alts I have ever tried to analyze. Long term followers will remember that a I was bullish in 2018/2019 and then slowly became uninterested up until the point of negative towards XRP for probably the past 3-4 years.
This is not only because of the lagging price compared to other older alts that soared like ETH and even Litecoin. Sure we did not see the growth and the taco stand ( who remembers ) just kept dumping on the market... But the entire "scandal" of the actors marketing/pimping, the dumping behind the scenes by executives to fund Ripple in early days, the lawsuit etc. was just such a colossal mess that I even wonder how XRP is still alive and kicking today.
All I'm saying is that this is truly a spectacular moment - it's hard to even imagine cripple crossed $3 after years and years of waiting on XRP when other alts x1000% and beyond. Point being - Don't miss it! Trading only works when you take profits.
________________________
BINANCE:XRPUSDT
Capital Doesnt Lie - The Energy ProblemPart 1: THE ENERGY PROBLEM
Everything we do produces energy, even prayer. If you have ever felt tired after praying for someone, that's because you spent energy and made an effort; let's call that energy 'capital' . Capital begins with effort, whether you see it or not.
The problem is: how do we use it or store it?
Imagine that energy as an invisible ball growing in front of your head. Every time you work and think, you're growing that invisible energy ball of capital. So, how do you get it in your hands? You can plant a cucumber, craft a chair, or clean your house. It's your order, attention, time- all energy made visible in the house, stored in the cucumber or the chair.
Genesis 3:19
'By the sweat of your face you shall eat bread…'
Verse Comment: It doesn't say 'by luck' or 'by inheritance.' It says by sweat. That's energy. That's effort. That's the value produced.
Proverbs 14:23
'All hard work brings a profit, but mere talk leads only to poverty.'
Verse Comment: Effort always creates something. Even spiritual labor, such as intercession, leadership, and parenting, is a form of value creation.
But here's the issue. That cucumber plant? It goes bad. That chair? It breaks. That clean house? Dirty again in 24 hours."
Everything we do has a cost; it's not free. Energy fades unless you can find a way to store it longer than the life of the thing you created.
So if everything fades, the big question becomes: How do you store the surplus of your energy, (the part you don't need today) so it doesn't fade by tomorrow?"
That's the foundation of all capital. Of all value. And of all wealth. And it starts with understanding where your energy is going, and what it's pouring into.

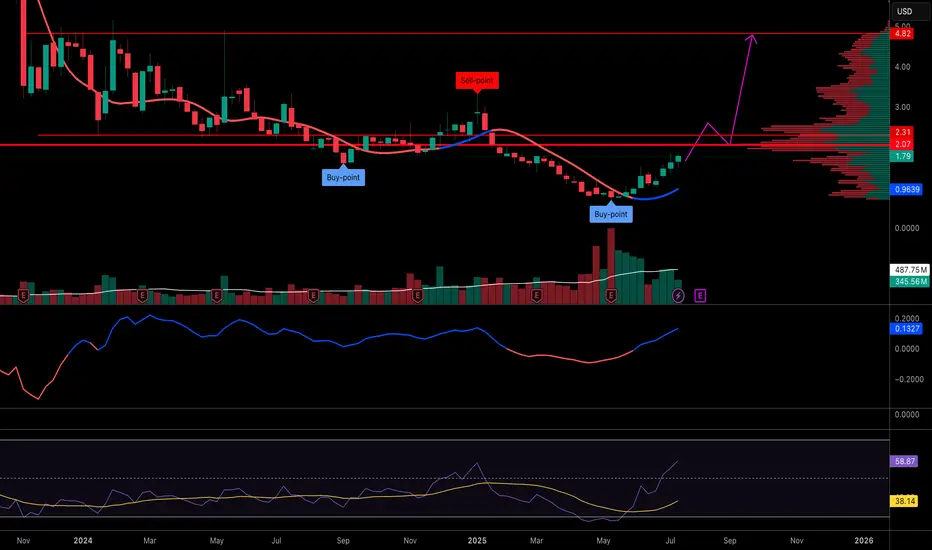
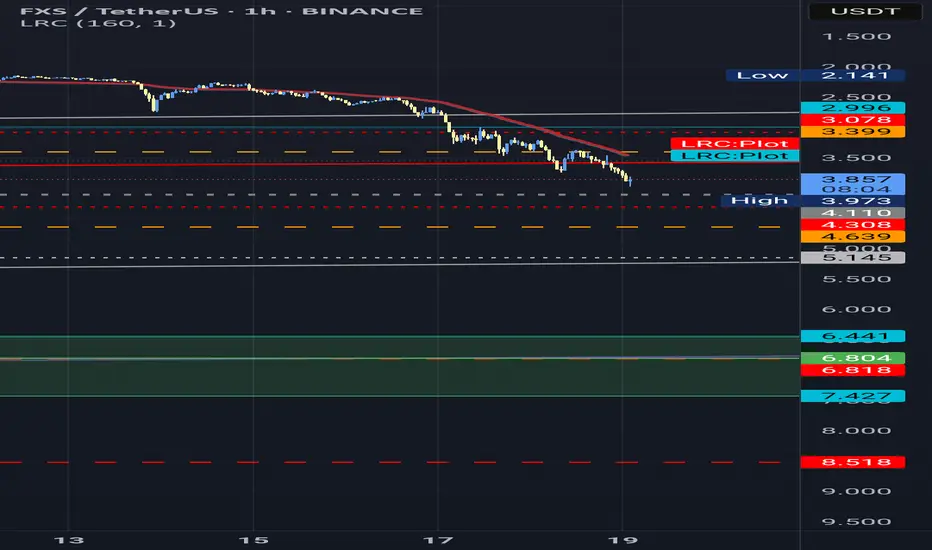
Bumpy road to 13$ (4$ - 5$ - 6$ - 7$)According to the information available about #fxs and, market's overall situation which experienced knows about; the real worth for FXS is higher than these prices.
The value increase for FXS will happen one way or another; but, the real question is... if it will be able to hold on to that price level or not? And, the answer to that lies on it's developers and, wether they'll be able to constantly improve this project and resolve future and remaining challenges and obstacles in this project and, develope it's potential to attract more investment, and keep their current investors.
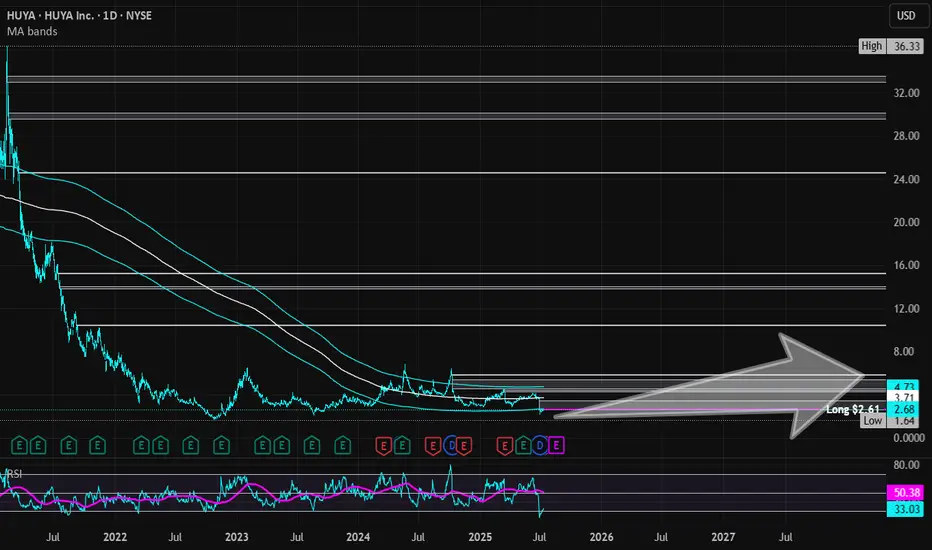
HUYA | HUYA | Long at $2.61HUYA NYSE:HUYA operates game live streaming platforms in China. This stock got my attention based on the reported fundamentals and price position, but moderate "Chinese delisting" risks exist given the US's new political administration.
Book Value = $3.23 (Undervalued)
Forward P/E = 4.1x (Growth)
Debt-to-equity = 0x (Healthy)
Quick Ratio = 1.56x (Healthy)
Altman's Z Score = <1.8 (Bankruptcy risk is relatively high)
From a technical analysis perspective, the stock price momentum has shifted upward based on the historical simple moving average. The price often consolidates within and slightly outside of this simple moving average band before progressing higher (after a long period of selling). While near term-declines are a risk, a longer-term hold (if the fundamentals do not change and delisting doesn't occur) may pay off given the value, growth, and overall health of the company.
Thus, at $2.61, NYSE:HUYA is in a personal buy zone.
Targets into 2028:
$3.45 (+32.2%)
$5.80 (+122.2%)
Elevance Health | ELV | Long at $286.00What are seeing in the healthcare and health insurance provider industry right now is destruction before a once-in-a-lifetime boom. The baby boomer generation is between 60 and 79 right now and the amount of healthcare service that will be needed to serve that population is staggering. Institutions are crushing them to get in - it's just near-term noise, in my opinion. My personal strategy is buy and hold every healthcare opportunity (i.e. NYSE:CNC , NYSE:UNH , NYSE:HUM etc).
Elevance Health NYSE:ELV just dropped heavily due to lower-than-expected Q2 2025 earnings, a cut in full-year profit guidance from $34.15-$34.85 to ~$30 EPS, and elevated medical costs in Medicaid and ACA plans. It's near-term pain (may last 1-2 years) which will highly likely lead to long-term growth. The price has touched my historical simple moving average "crash" band. I would not be shocked to see the price drop further into the $260s before a rise. However, the near-term doom could go further into the year. I am anticipating another drop to the "major crash" simple moving average band into the $190s and $220s to close out the remaining price gaps on the daily chart that occurred during the COVID crash. Not to say it will absolutely reach that area, but it's locations on the chart I have for additional buys.
Thus, at $286.00, NYSE:ELV is in a personal buy zone (starter position) with more opportunities to gather shares likely near $260 before a bounce. However, if the market or healthcare industry really turns, additional buys planned for $245 and $212 for a long-term hold.
Targets into 2028:
$335.00 (+17.1%)
$386.00 (+35.0%)

Long Term Investment cum Trading Idea ( FnO Stock)ASHOKLEY LTP 217
Tgt:242/264/295🤞🏻
Long-term: 328/399/432🤞🏻🤞🏻
May add more on dips till 206-191
For investors with a long-term perspective and the ability to add on dips or hold calmly.
Time Frame: 4 to 12 months 🤞🏻
Trade as per your risk management and investment plan.
#luv4stockmarket
#scammersfreetrading
#atmanirbharinvesting

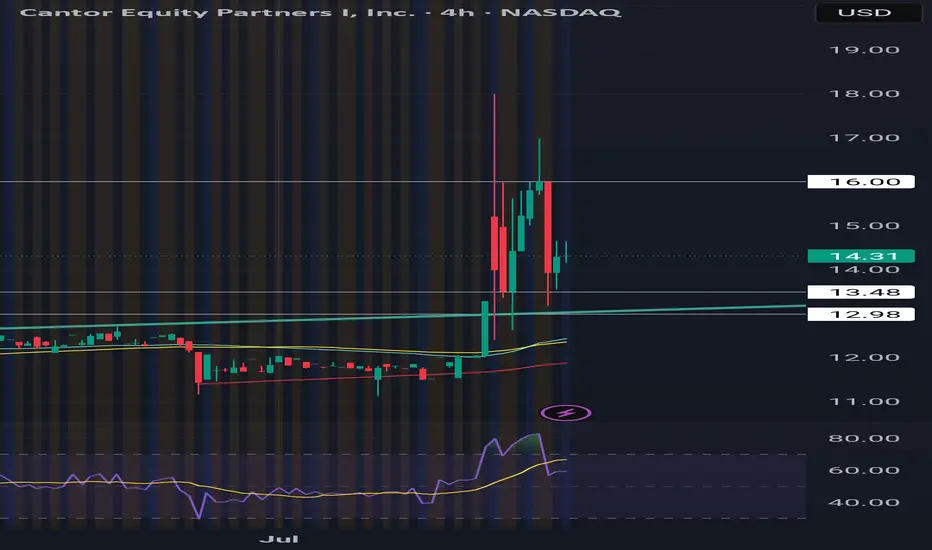
BTC TREASURY Adam Back, a satoshi era OG, is launching Bitcoin Standard Treasury Company (BSTR), which plans to go public through a merger with Cantor Equity Partners I (CEPO), a special-purpose acquisition company. BSTR will debut with 30,021 BTC, valued at approximately $3.5 billion, making it the fourth-largest public Bitcoin treasury. The company has secured $1.5 billion in private investment in public equity (PIPE) financing, the largest for a Bitcoin treasury SPAC merger, with CEPO contributing up to $200 million, subject to shareholder redemptions. The merger, expected to close in Q4 2025, aims to maximize Bitcoin ownership per share and accelerate adoption through Bitcoin-native financial products and advisory services. Ill be loading shares tommorrow and continuing to dca. Btc price swings will influence this heavily wind direction is currently North!
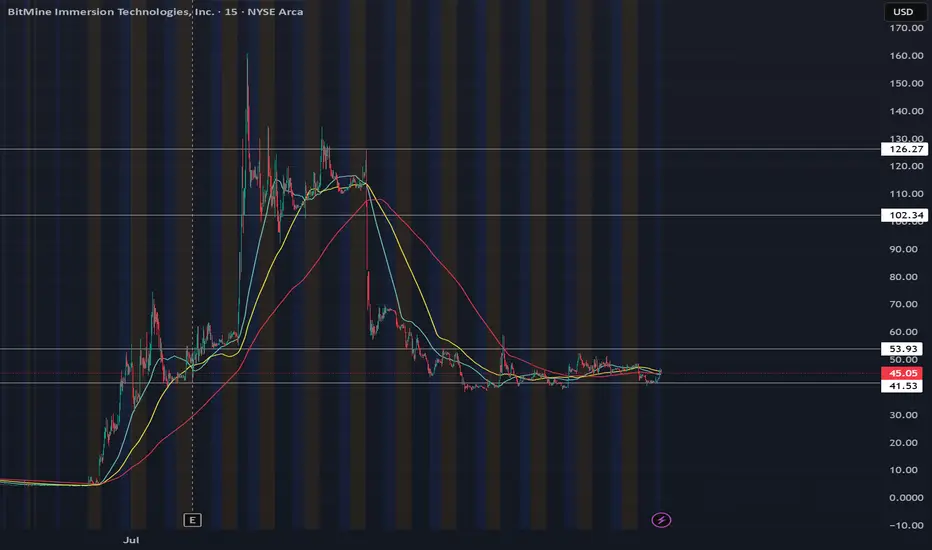
BACK TO 100Bought shares today at close new legislation is going to send this sky high. BMNR just may actually be the MSTR of ETH with the players they have. SBET BTBT COIN all will do great, but BMNR currently holds the lead for largest ETH treasury. Maybe more chop to average shares but this will be going SOON. As long as the daily RSI is above 50, we should be holding local support until breakout of this is accumulation zone.
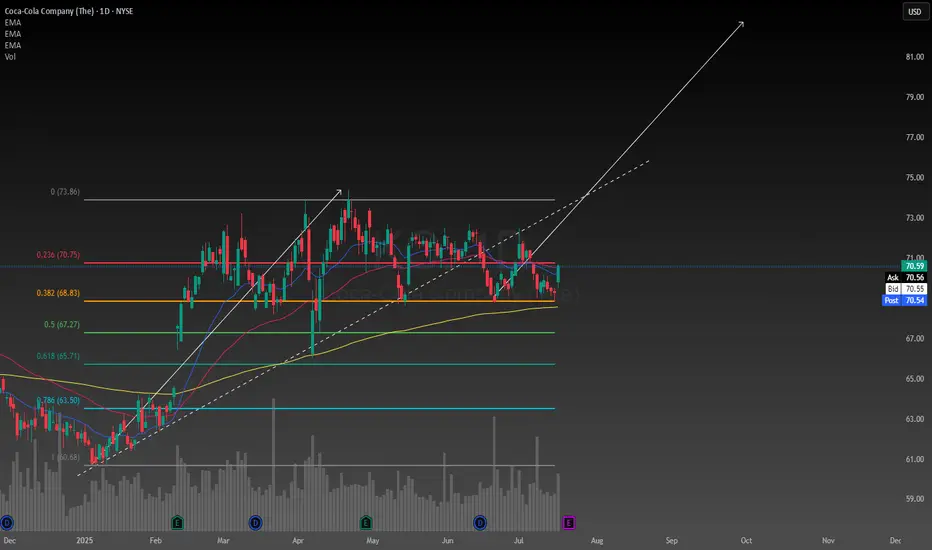
Coca Cola to protect my portfolio and help it growOne of the most important things we must try to determine as investors is what company is the best at what they do in their field. In my opinion Coca Cola is and has always been the number one soft drink manufacturer, always finding new yet subtle ways to stay ahead of their competition.
The reason I have allocated a decent amount of my portfolio to Coca Cola is a combination between their reliable track record of creating value, and paying dividends. People love junk food so it gives me high conviction to hold the stock long term. The company also demonstrates consistent, and reliable methods of generating organic revenue, and constantly finding new ways to cut costs and improve their profit margins.
Despite what some other critics may claim about the stock being over valued, the intrinsic value of the stock happens to be $77 with a range between $48-$180. According to technical analysis it is over valued. I have too much respect for Coca Cola to trust technical analysis in my decision to hold the stock, I am rely solely on fundamentals. According to my perspective on the company it is in fact undervalued.
Another positive catalyst I have noticed was when President Trump said he thinks Coca Cola should be made with cane sugar in the US, I think that would be a great idea, not only would it be healthier the soda would also taste better. Coca Cola looks like its going to stay ahead of the game for the foreseeable future.
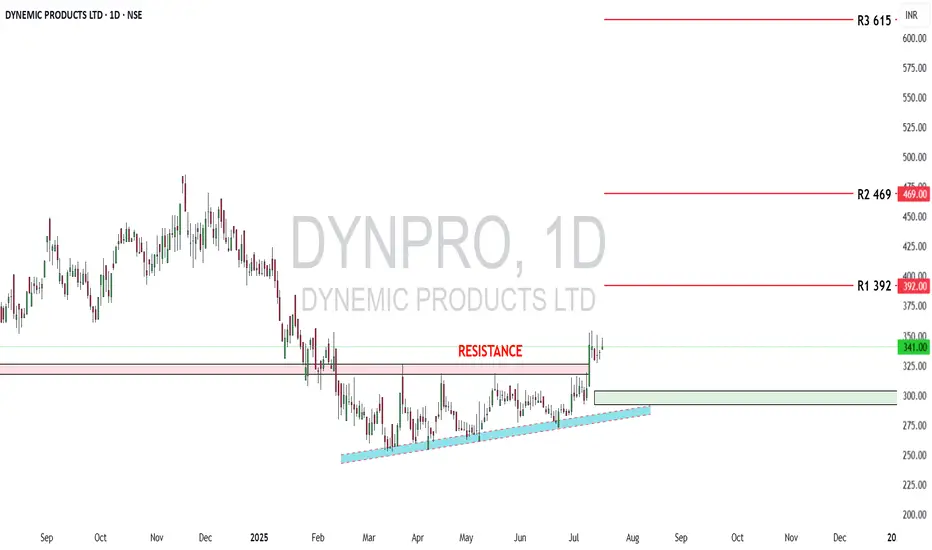
Dynemic Ltd: Bullish Setup UnfoldingDynemic Products Ltd (NSE: DYNPRO) is a well-established exporter and manufacturer of synthetic food-grade dyes, lake colors, and D&C colors, catering to global markets. As of July 16, 2025, the stock trades at ₹341 and has recently broken out of a prolonged consolidation zone, indicating renewed investor interest.
From a fundamental perspective, the company’s financials show notable improvements:
🔸 Revenue (FY25): ₹214 crore, up 29% YoY
🔸 Net Profit (FY25): ₹15 crore, up 269% YoY
🔸 EPS (TTM): ₹3.65
🔸 P/E Ratio: ~23× – moderately valued
🔸 P/B Ratio: ~1.56× – near fair book value
🔸 ROE: ~7%, showing improving return to shareholders
🔸 ROCE: ~12.7%, indicating decent operational efficiency
🔸 Debt-to-Equity: ~0.43× – financially stable
🔸 Current Ratio: ~0.95× – slightly below ideal liquidity levels
🔸 Operating Cash Flow: ₹28 crore – healthy cash generation
While the company has a stable balance sheet and growing profitability, investors should note that liquidity remains slightly tight, requiring careful monitoring of working capital and short-term obligations. Nonetheless, the financial turnaround and earnings consistency signal strength.
On the technical front, the stock has shown strong bullish action after breaking above a multi-month resistance:
🔹 Breakout Zone Cleared: ₹325–₹330 (previous resistance)
🔹 Current Price: ₹341
🔹 Reversal Zone (Strong Support): ₹292 to ₹304
🔹 R1: ₹392 – short-term resistance
🔹 R2: ₹469 – medium-term target
🔹 R3: ₹615 – long-term upside if momentum sustains
The breakout is confirmed with increased volume and a clear higher-high, higher-low structure, validating bullish sentiment. The price now rides above a rising trendline, suggesting trend continuation unless a breakdown occurs below ₹292.
In summary, Dynemic Products Ltd currently offers a compelling techno-fundamental setup. The financials have improved significantly, valuations remain reasonable, and the technical breakout suggests potential for further upside. Investors can consider accumulating on dips above ₹304, while swing traders may target ₹392 and ₹469 in the short-to-medium term. A close watch on liquidity and cash flows is advised, but the stock presents a strong growth case in the specialty chemicals space.
Disclaimer: lnkd.in

HUGE BULL FLAG BREAKOUT with Stifel Coverage initiation at $5.Been preaching this for a couple years, but just pour through this chart with amazing fundamentals, Govt contracts, and $200M Indonesian contract... just lovely...

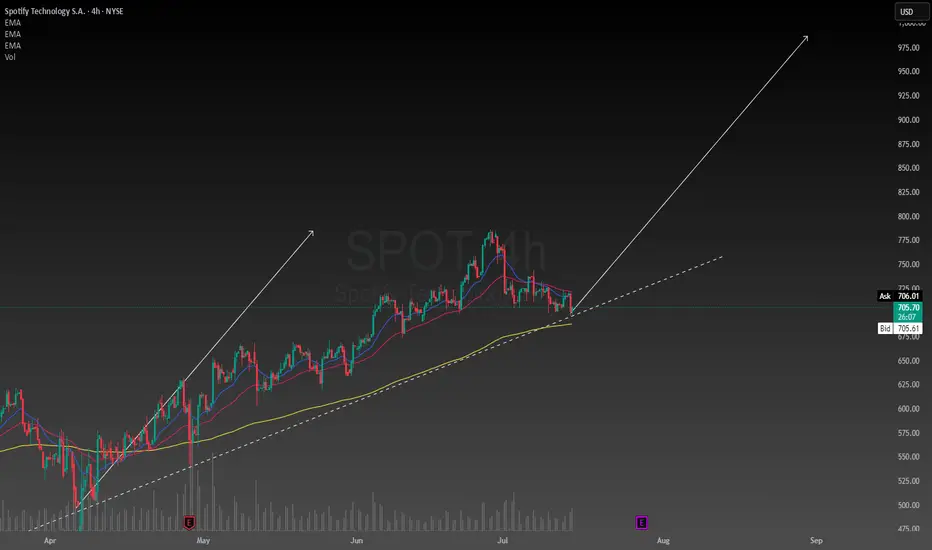
Raising the bar for SpotifySpotify has been my favorite stock so far this year. Primarily because resilience in uncertain economies. Subscription-based services, especially freemium models, are seen as defensive. Spotify is the number one music streaming service in the world and unless that changes people will keep using it every single day in their lives.
They will generate revenues based on advertisements and subscriptions which are in my opinion reasonable and conducive of a strong business model. I am raising my price target to $985. This is not unreasonable considering the intrinsic value of the stock is between $400 and $2900. I am confident Spotify will find ways to stay ahead of its competitors and dominate the music streaming industry. While keeping its customers happy and loyal.
KALV FDA approval rallyKALV received FDA approval this week for a new drug, has $220mln in cash, and just bounced off the daily 21EMA (overlayed on this 4H chart).
Recently rejected off the monthly 100ema two times (overlayed on this 4H chart). Breakout beyond the monthly 100ema and first target is $20. Numerous price target increases, most notably, one at $27 and another increased from $32 to $40.


barrick, run it hotfiscal dominance adding downward pressure on dollar. long term chart look favourable with key fib levels being touched. added copper exposure in usa, abx has some legs

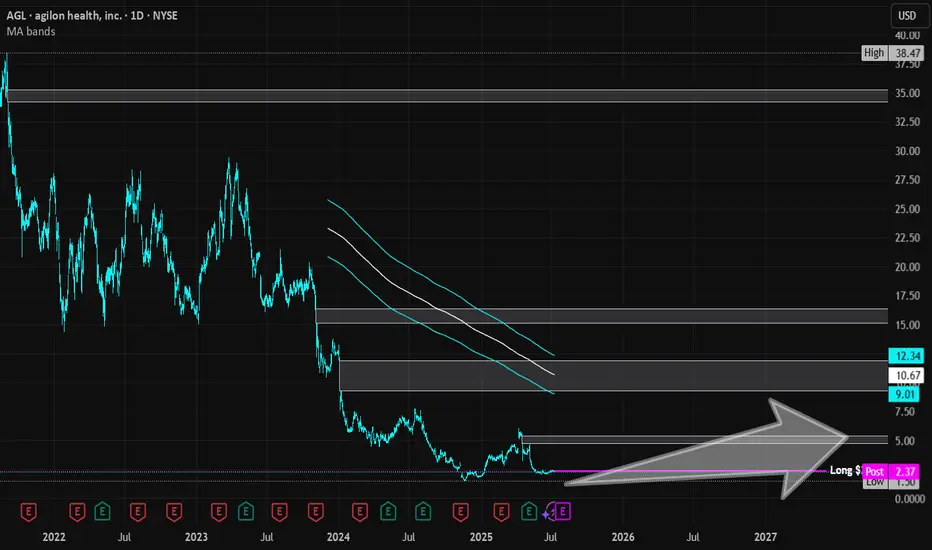
Agilon Health | AGL | Long at $2.36Reentering this trade (original: )
Agilon Health NYSE:AGL
Pros:
Revenue consistently grew from 2019 ($794 million) to 2024 ($6.06 billion). Expected to reach $9.16 billion by 2028.
Current debt-to-equity ratio 0.07 (very low)
Sufficient cash reserves to fund operations and strategic initiatives
Strong membership growth (659,000 in 2024, a 38% year-over-year increase)
Recent insider buying ($2 - $3) and awarding of options
Cons:
Rising medical costs - currently unprofitable and not forecast to become profitable over the next 3 years
Medicare Advantage Membership issues with the new political administration
No dividend
It's a gamble and I think it's a possibility this could drop near $1 in the near-term due to the Medicaid changes/fear... regardless, long-term, personal buy-zone at $2.36.
Targets in 2027
$3.70 (+56.8%)
$5.25 (+122.5%)
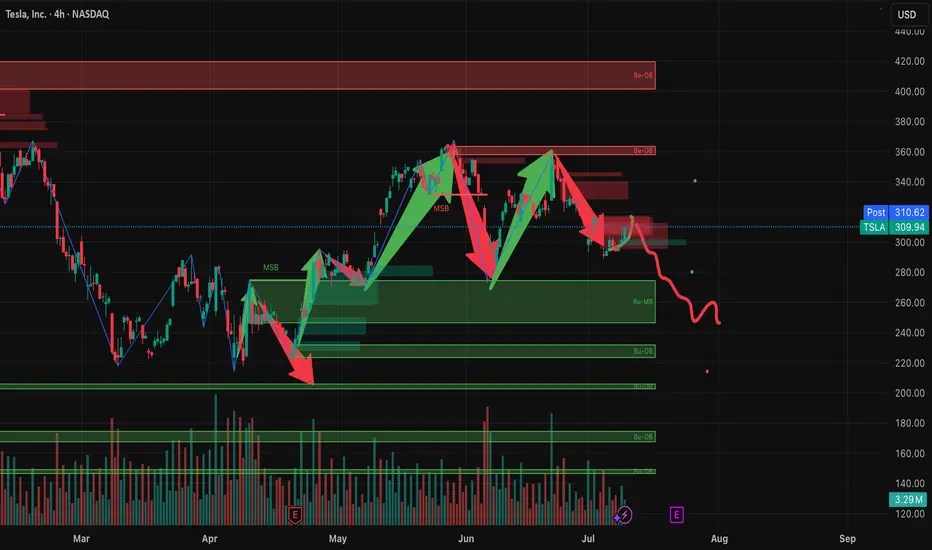
Why TSLA will Crash based On Copper TarrifsHere’s why that bearish outlook is gaining traction:
Copper costs are surging: Tesla uses over 180 pounds of copper per vehicle. With prices spiking 13% in a single day and a 50% tariff looming, production costs are rising fast.
Analysts are cutting price targets: UBS, JPMorgan, and Bank of America have all lowered their forecasts for Tesla, citing margin pressure and weakening demand3.
Brand sentiment is shaky: Tesla’s recent delivery miss and political controversies around Elon Musk have added to investor unease.
Tariff ripple effects: The broader trade war is expected to disrupt supply chains and inflate costs across the EV sector5.
That said, some analysts still see long-term upside if Tesla can pivot quickly—especially with its AI and autonomous driving ambitions. But for now, the market is reacting to the immediate risks.
Overall Enter Short for Gains of 3-5 percent.