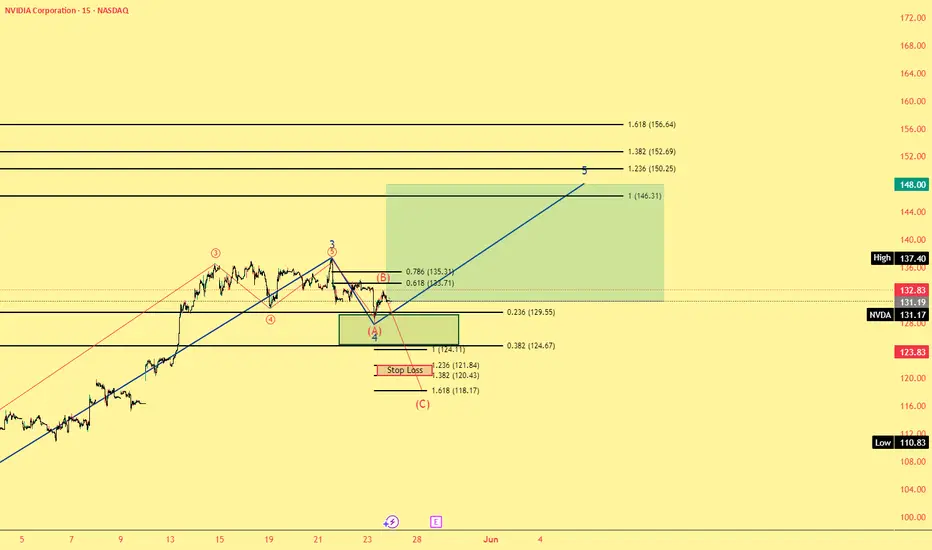
NVDA Possible PlaysCurrently looking to see if NVDA can manage to get through next week and bounce up or the alternate route where we see a correction. Thoughts and comments appreciated.
Growth
$UUUUTrump’s executive orders to ease Nuclear reactor regulations and improve fuel supply chains, boosting nuclear energy demand.
Before 2025 started, once Trump won the election I was certain he would eventually pass executive order(s) and/or make political deals to ease nuclear reactor regulations and improve fuel supply chains, naturally boosting nuclear energy demand. This does not just affect AMEX:UUUU it also affects most of the Nuclear Energy stocks and Uranium-related stocks, like AMEX:UEC , NASDAQ:CEG , NASDAQ:NNE , NYSE:OKLO etc.
We should see most of these stocks continue to grow in value throughout 2025 at the very least. I don't know yet how they will fair in 2026 though 2025 should continue to be a good year for nuclear energy and uranium stocks :)

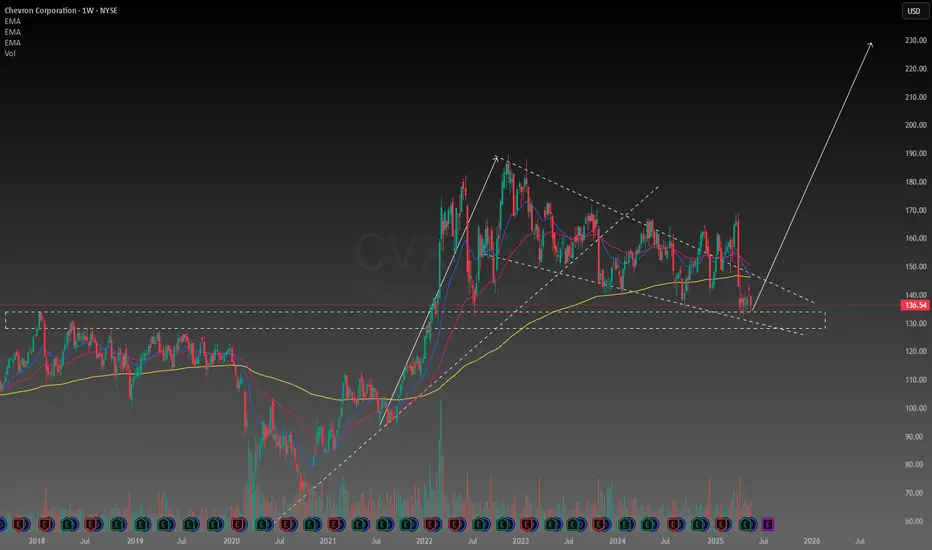
Chevron wedge bull flagChevron stock is well below its intrinsic value, I found a decent setup based on technical analysis for my entry, because of the attractive dividend payouts I will buy and hold CVX for awhile and see what happens.
Bitcoin Income: STRK vs IBIT – Dividends, Covered CallsThis video provides a performance breakdown between two Bitcoin-related financial instruments—STRK (Strike) and IBIT—through the lens of passive income generation. I compare traditional buy-and-hold strategies with more active income tactics such as covered calls. Key insights include:
STRK provided the best return YTD (26%) and yielded approximately 1.54% in passive dividends, requiring minimal effort—just buy, hold, and collect.
IBIT, while slightly trailing in growth (13%), is optimized for a covered call strategy, offering an impressive 6% income yield through active options trading.
The analysis highlights the trade-off between simplicity and engagement—STRK is more passive-friendly, while IBIT offers higher yields for those willing to manage options.
This is ideal for tech-savvy investors exploring Bitcoin ETFs and derivative income strategies, weighing convenience versus return potential.

Hello again to USDJPY(1H)I got profit two times in 24 hours ago from 1H USDJPY.How?!..I had put one of its analyses last day clearly.It was a hunt opportunity.OK still now we're waiting for a breakout.After a breakout we can show a new route to down or up

Descending channel continues(BNB,4H)According to last analysis the price moves through a descending channel.It has to break one border to find a new route.

TMGH Trend Line Rebound AnalysisTMG Holding trend is still in a downward zone, but rebounded at the support line 52.019. In case of a rise, it is expected to breach the resistance line 52.472 and reach the resistance line at 52.805 points. In case of falling, it's expected to break the 1st support line at 51.535 points, then the second support line at 51.475, then the third line at 50.779, which is fundamentally not a preferable expectation because of the Omani Ministry of Housing and Urban Planning signing a $4.7 Bln real estate deal with TMGH. For developing two real estate projects spanning 4.9 million square meters, to deliver around 12.9 thousand residential units. In addition, the combined sale value of units is projected at $4.7 billion.

100B Wiped Out From Crypto MarketLooking at the total market size, we just lost $100B in market cap across top cypto assets.
And, the USA got downgraded.
And, CoinBase got hacked.
What do you think is going to happen tomorrow?

TSM great potential before earnings call? Value to be collected!Hi guys we would be taking a look into our analysis for TSM!TSMC (TSM) Stock: Positioned for
Strong Growth Despite Tariff Pressures -
Taiwan Semiconductor Manufacturing Company (TSMC), the world’s leading contract chipmaker, continues to shine as a long-term winner in the semiconductor space, even amid renewed trade tensions and potential tariffs.
1. Resilience Amid Tariffs and Trade Tensions
While the U.S. has recently introduced or hinted at higher tariffs on tech-related imports from China, TSMC stands out due to its strategic positioning. As a Taiwan-based company with increasing investments in the U.S., including a major Arizona facility, TSMC is well-insulated from the harshest tariff implications. In fact, the shift toward U.S. domestic chip production could boost TSMC's presence and government support, solidifying its role in global supply chains.
2. Unmatched Technological Leadership
TSMC is years ahead of competitors in cutting-edge semiconductor manufacturing, particularly in advanced nodes like 3nm and 2nm chips. This technology edge secures high-value contracts with top-tier clients like Apple, NVIDIA, and AMD, ensuring a steady and growing revenue stream.
3. Surging Demand for AI and High-Performance Computing
With the global explosion of demand for AI infrastructure, data centers, and high-performance computing, TSMC is perfectly positioned. It is the go-to foundry for the most advanced AI chips, giving it a critical role in powering the next generation of tech innovation.
4. Strategic Global Expansion
TSMC’s global expansion—including new plants in the U.S., Japan, and Germany—reduces geopolitical risks and enhances its ability to serve major markets locally. These moves also align with government incentives and support from the CHIPS Act and similar programs.
Outlook:
TSMC is not only weathering the global trade climate—it’s thriving. Its dominant market share, world-class technology, and expanding global footprint give it a strong competitive moat. With rising AI demand and the shift toward local production, TSM is set to benefit on multiple fronts.
TSM stock remains a high-conviction play for investors looking to capture the future of tech.
TSMC has consistently delivered impressive financial results, with the company surpassing analyst expectations in the past 12 consecutive quarters. For instance, in the fourth quarter of 2024, TSMC reported earnings per share (EPS) of $2.24, exceeding the consensus estimate of $2.16. This track record underscores the company's robust operational efficiency and market demand for its advanced semiconductor solutions.
Upcoming Earnings Call
Investors are anticipating TSMC's next earnings call scheduled for Thursday, April 17, 2025, before the market opens. Analysts expect the company to report an EPS of $2.02 for the first quarter of 2025. Given TSMC's history of exceeding expectations, there is optimism that the company will continue its trend of strong financial performance.
EPS beat estimates 16 times in 17 quarters!!!!!
We are targeting approximetly 18% increase!!!
📌 Trade Plan
📈 Entry: 152
✅ Target 183
❌ SL: 128

City Group this weeks best choice from the earnings calendar!Hi guys we would take a look into our perspective for Citygroup, which out of this weeks earnings stocks gives us the best potential, we are targeting a whoping 20% increase for our end goal.
Citigroup (NYSE: C) is demonstrating strong growth potential in 2025, driven by robust earnings, strategic initiatives, and favorable market conditions. Here's our comprehensive analysis focusing on Citigroup's growth prospects:
📈 Recent Performance Highlights
Q1 2025 Earnings: Citigroup reported a 21% year-over-year increase in net income, reaching $4.1 billion ($1.96 per share), surpassing analyst expectations of $1.85 per share. Revenue rose 3% to $21.6 billion, exceeding forecasts. The growth was primarily driven by a 23% surge in stock trading revenues amid market volatility and increased client activity.
Return on Tangible Common Equity (RoTCE): The bank's RoTCE improved to 9.1%, nearing its target range of 10–11%, indicating enhanced profitability and efficient capital utilization.
📊 Growth Metrics & Analyst Outlook
Earnings Per Share (EPS) Growth: Analysts project a 15.3% annual EPS growth for Citigroup over the next five years, outpacing peers like Bank of America (9.0%) and JPMorgan Chase (3.9%).
Revenue and Earnings Growth: Citigroup is forecasted to achieve a 9.8% annual earnings growth and a 7.9% revenue growth over the next three years.
Share Repurchase Program: The bank has initiated a $20 billion share buyback program, reflecting confidence in its financial strength and commitment to returning capital to shareholders.
🚀 Strategic Initiatives & Market Position
Operational Efficiency: Citigroup is investing in technology and streamlining operations, including reducing reliance on external IT contractors and enhancing data management systems. These efforts aim to improve efficiency and regulatory compliance.
Market Leadership: The bank's diversified business model, encompassing trading, wealth management, and banking services, positions it well to capitalize on various market opportunities.
⚠️ Market Considerations
Economic Uncertainty: While Citigroup's performance is strong, broader economic uncertainties, including potential recessions and regulatory changes, could impact future growth. Analysts are monitoring these factors closely.
✅ Our Conclusion
Citigroup's robust earnings growth, strategic initiatives, and strong market position make it a compelling candidate for investors seeking growth opportunities in the financial sector. The bank's focus on operational efficiency and capital return strategies further enhances its growth prospects!
The entry would go as following -
Entry point : 63.80
Target 1 : 71.69 - just above the GAP which was previously formulated, when we pass it this would cement our uptrend formation.
Target 2 : 75.30 - finalizing almost 20% growth of the stock which would be around the strong resistance area.
Stop Loss : 55.50 - around the bottom zone , which there was a lot of volume supported by the buyers.

META - Another great earnings, allowing us to collect value?Hi guys ,we would be looking into our analysis for META stock.
Meta Platforms Inc. has demonstrated robust financial performance, underscoring its strategic investments in artificial intelligence (AI) and digital advertising.
Strong Financial Performance
In Q4 2024, Meta reported revenue of $48.39 billion, marking a 21% increase year-over-year. Net income surged by 49% to $20.84 billion, with diluted earnings per share (EPS) rising 50% to $8.02. The company's operating margin improved to 48%, up from 41% the previous year, reflecting enhanced operational efficiency.
AI-Driven Advertising Growth
Meta's advancements in AI have significantly bolstered its advertising capabilities. In Q3 2024, advertising revenue grew by 18.6% year-over-year, reaching $39.89 billion. The integration of AI technologies has enhanced ad targeting and delivery, contributing to this growth.
Our Confidence
Overall analysis maintains a bullish outlook on Meta's stock, with an average price target of approximately $634, suggesting a potential upside of around 17% from current levels. The company's strategic focus on AI and its strong financial results support this positive sentiment.
In summary, Meta's strong earnings report, driven by AI advancements and advertising growth, positions the company favorably for continued success in the evolving digital landscape.
📌 Trade Plan
📈 Entry: 550
✅ Target: 630 - below the ATH to give an achievable destination
❌ SL: 480 - below the support zone to protect the trade

First step towards ATH BULIISH FLAG on DOGE
In several time frames DOGE has formed a Bullish Flag from around $0.16 going to $0.32.
This is the first dog step to the ATH!

Tesla is AI, Robotics company. Here is data for $6000 by 2032Hey, what's up, traders, investors and Elon Haters.
I know a $6000 will might sound controversial, and it will be hard to agree with Elon Haters. But before you put your hate on here, read the data. My goal is not to convince you or prove to you that you should invest. All these predictions can go wrong. Investing has happened many times in history, and big companies have gone bankrupt. Although many are calling this for Tesla. I don't think it's gonna happen.
📍Let's start with the fact that Tesla is not a Car company anymore, as many still value it this way.
If you look at their products and the revenue, it's broadly changing. In 2026, less than 50% income will be from the Auto business.
🧪Tesla represents a multifaceted technology powerhouse extending well beyond EVs. Its leadership in AI, Robotics and integrated hardware-software systems, alongside its unmatched margins. They are a long-term innovator in clean energy and autonomy.
🧪The business model integrates 4 colliding S-curves, which will revolutionise transportation safety and efficiency and transform industrial automation.
1) Electric Vehicles
2) Energy Storage Solutions
3) FSD / Robotaxi
4) Robotics - Humanoids
📍The first 2 in the list above are pretty much becoming the same as their Auto business and it will overextend in the next years.
📍Now let's add potential revenue from the Robotaxi. It will enormously overtake all of those
You might be wondering how? Or thinking about competitors. In fact, there is no competitor; every other company which is in this business need suppliers for servicing the cars. Tesla creates everything by itself autonomously. Their cost per mile will be the cheapest on the market in comparison with Waymo, Uber some calculations show that it can be even cheaper than driving your own car.
📍Now let's add potential revenue from Optimus.
You can see its multiple times bigger than everything. Humanoids are a 50 trillion dollar business. Why? The world is short of workers and declining birth rate. The world needs workers. The first use case for humanoids will be manufacturing, they are the best way to supplement all of that.
📍What if that doesn't play out?
All of this is still just predictions, and anything can happen. In the chart below, Cern Basher (find him on X) shows how the probability of potential business affects stock prices.
Watch the top lines. Autos, Energy, and Storage are playing out. But what if Tesla makes only 10% of the Robotaxi and Optimus, and completely fails in AI? What would be the stock price?
If Tesla completely fails in Robotaxi and Optimus and delivers only 10% of the projected stock price still can reach $3590. Which is still not bad, right?
📍But if everything plays out as projected, here is the potential revenue from Optimus.
📍Optimums will not only replace workers but also save a lot of costs for the companies
Elon Musk: This year, we will hopefully be able to make about $5000 in Optimus Robots. We are technically aiming for enough parts to make 10,000 to 12,000. But since it's a totally new product, everything is totally new, I'll say we're succeeding if we get to half of the 10,000.
Here is what it could mean for the stock price. Because I'm mainly a technical trader, not a fundamental and data expert, I like to use data from analysts and experts on Tesla.
Note: it's price projections, not predictions.
🎯 Cern Basher approx 7K by 2032
🎯 James - InvestAnswer - $6500 by 2032
🎯 When to buy?
First of all, you need to decide if you want to trade or if you are an investor. For a trade, there was a perfect technical setup at $200 which I posted around a month ago and was hated for that. Because many people are influenced by the media.
As an investor with a long-term horizon, you don't need to find a perfect entry or timing. You don't use leverage and have your long-term vision. I have been buying at $150, I bought at $450, and I bought big time again around $215, and I will buy on Monday at $350 and in future I will buy at $1000 again.
My strategy is to split profits from short-term trading into long-term investments - BTC and Tesla.
The Robotics, Autonomous Driving, and AI are disruptive technologies and S curves playing at the same time. The biggest revolution in human history is going on now. Tesla could potentially be part of it, and if all works as projected. Tesla will be bigger than the top 5 companies on the Nasdaq Combined.
David Perk
Looking for constructive discussions and opinions.

"MASTER OF SOCIAL REALMS, META" How Does Meta Make Money?The long-term outlook for META stock looks pretty promising. Thanks to heavy investments in AI and the metaverse, along with steady growth in its advertising business, analysts predict the stock price could climb from its current level (around $640) to anywhere between $700 and even $2,000 by 2030. AI-driven improvements in ad efficiency and growing user engagement on platforms like Facebook and Instagram are major drivers. Plus, the company’s solid financials give it plenty of room to keep investing in the future.
That said, there are risks to watch out for, like tougher regulations in Europe, increasing competition, and uncertainty around the metaverse’s success. Overall, though, META’s strong position in tech and the market makes it a solid pick for long-term investors. Just make sure to weigh those risks before jumping in.

Wood Raw Material Price Outlook & Its Impact on Pellet Prices🔍 Chart Highlights:
Historical pellet price references:
2000: €200/ton
2014: €273/ton
2016: €217/ton
Recent upward trend since COVID-19 dip, known as the “Coronadip”, reflects increasing demand and market correction.
Forecasted pellet price levels based on raw material trends:
Minimum projection: €291/ton
Expected projection: €328/ton
Maximum projection: €352/ton
Producer Price Index (PPI) data suggests a return to long-term growth after a temporary peak and correction in 2021–2023.
📈 Outlook:
Pellet prices have shown a consistent upward trend over the past four years. However, this pace is likely unsustainable. A further price increase is expected in the short term, driven by raw material costs and market sentiment.
Depending on market conditions, an average increase between 10% and 42% is projected — a range typically anticipated by institutional investors in commodity sectors.
📌 Note: This chart reflects raw material price trends. Final product prices may differ due to manufacturing, logistics, and retail markups.

trend and corrections(1H)As I said multiple hours ago , we saw that gold declined both in the four-hour and the one-hour charts.Now I'm gonna mention that in 1 hour chart again so if we follow the trend and correction strategy we will find an another possible correction that says and shows a sell opportunity after happened.Good luck

Defining SWDY's TrendSWDY stock in the short run is still defining its trend. The most recommended case is rising, it's expected to reach the 1st resistance line 80.081, then the 2nd resistance line 80.183, and the 3rd resistance line 80.448 points. In case of falling, it's expected to reach the 1st support line 79.89, the 2nd support line 79.51, and the 3rd support line at 79.001, which is fundamentally not highly expected due to its latest acquisition.

TMGH Neutral Zone AnalysisTMG Holding trend is currently in a neutral zone, which supports the EGX30 zone analysis, reflecting the investors' wait for updates to orient them on which trend to prepare for, whether buy or sell. In case of rising, it's expected to reach the resistance line 54.044, breaching it depends on the future news. In case of falling, it is expected to reach the support line 52.573, but fundamentally it's a far-off expectation according to its current state among the upcoming summer season and its widening ads.

simple and natural :-!Dears the gold has decreased and broken the lines and has corrected now in my opinion.It's the time to get sell position.It's easy *^_^*

Ticket to Trump's dinnerI really don't know and even care what is this. They just said who get enough of $TRUMP those may have a chance to be invited at the President Trump Annual Holders Dinner at White House or whatever

$ORCA +#1 DEX on Solana in terms of efficiency and security
Wave 4 appears complete at .5 retracement $2.17 estimated ($2.12 actual)
Wave 5 Targets:
1.0 $10.47
1.618 $15.62
2.618 $23.95

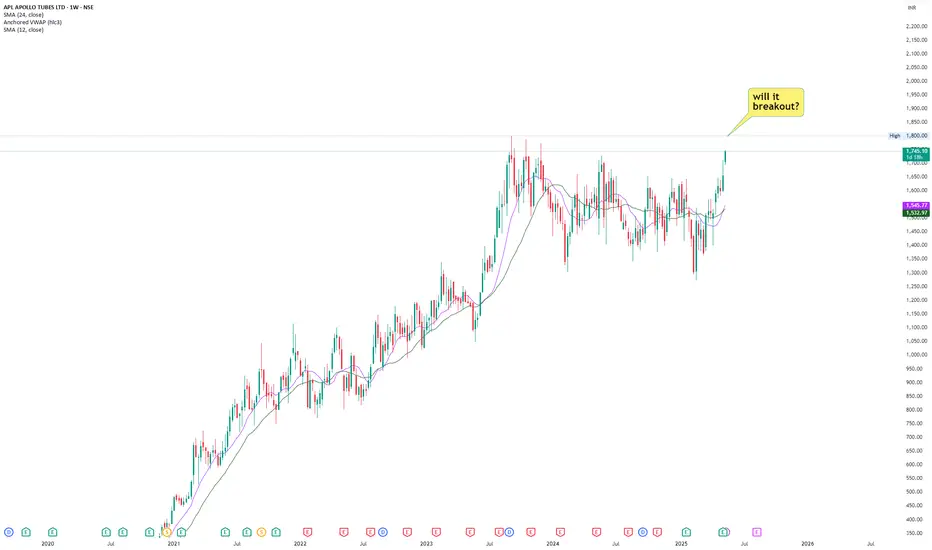
APLAPOLLO- All time high possible!!!APLAPOLLO is nearing its all time high level. Stock is nearing this level with relatively higher volume.
Stock has recorded double digit growth in last consecutive 2 quarters.
Margins have also expanded by roughly 40%.
Company has also expanded its CAPEX budget in coming years.
Overall it's a good technofunda stock to watch. Add to watchlist.
"King of Cards" How Does Visa Make Money?NYSE:V
To be honest, VISA stock is the kind of investment that really feels solid and reliable. I bought a bit of VISA a few years ago, and before I knew it, the price had climbed past $300 and I started getting those occasional dividend notifications. The dividends aren’t huge, but it’s nice to see that money coming in automatically. I can see why so many dividend investors like VISA.
VISA is, of course, the same “VISA” you see on your credit cards. Globally, they dominate the credit card market, with nearly half of the market share, and they’re among the top 10 biggest companies in the US by market cap.
These days, cashless payments have become the norm, and that trend really works in VISA’s favor. Most analysts expect VISA to keep growing steadily, with annual revenue and profit increases of around 10%. VISA has also raised its dividend every year for over 16 years, making it a classic “dividend growth” stock. The yield itself is under 1%, but the key is that the dividend keeps getting bigger.
Recently, VISA’s been expanding into new businesses too-like Visa Direct for money transfers-so they’re evolving from just a credit card company into a global payments platform. Maybe that’s why even Warren Buffett has invested in VISA.
Of course, there are risks. There’s always talk of antitrust regulation, and new fintech companies like PayPal are trying to take market share. In fact, VISA’s stock has underperformed the market a bit in the last few years. But VISA’s economic moat (the barriers that keep competitors out) is still very strong.
Looking at the current price, VISA’s P/E ratio is actually a bit lower than its five-year average, so some people think it’s undervalued right now. That’s why I think VISA is a stock you can hold in your portfolio for the long term and feel pretty comfortable about.
- VISA is the clear leader in global payments, and as we move toward a cashless society, its growth prospects look strong.
- The dividend is small but growing every year, and the stock price has trended upward over the long term.
- There are risks like regulation and fintech competition, but most still see VISA as a solid investment.
Maybe you like this Video deal with VISA
below comment!
