GRT Triangle bigger than originally thought.After several candle close outside of the original yellow triangle, it is clear that the more valid triangle is now this bigger tan triangle. We can see the top trendline of the tan triangles trajectory angle also matches the angle of the purple descending channels as well for added confluence. While that means we haven’t yet actually broken up out of the triangle just yet, the good news is when we do the breakout target will be higher than original expected. I arbitrarily placed the breakout measured move target line here for a rough estimate. opefully it breaks out of the triangle somewhere close to this region. *not financial advice*
GRT
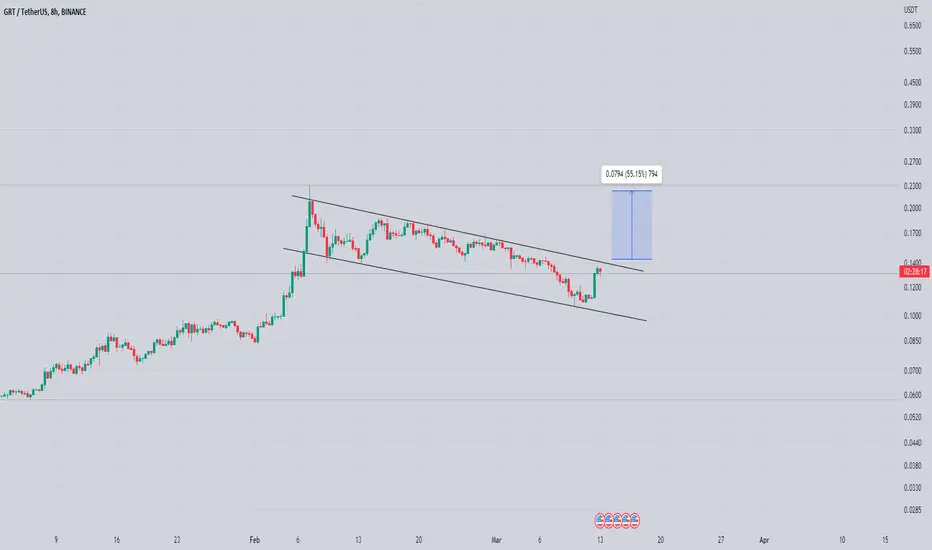
GRT/USDTAfter the squeeze last week, GRT formed a LH and is starting to break down again on LTF.
Currently trading at MO and just above Mid Range, expecting Range Lows in due time.
Will a short after a break below MO and add to my shorts after it breaks below Mid Range.
This is a swing short for me and I will have 2 Targets as shown on the chart.
Follow, like the idea and feel free to leave a comment.
Check out other ideas if you like this one.

GRT bullish/bearish scenarioMy two possible outcomes in GRT :
So far, we have lost the support and could be heading to the lower support if we do not reclaim support on top in time. If we do reclaim we could be heading to 0.4.


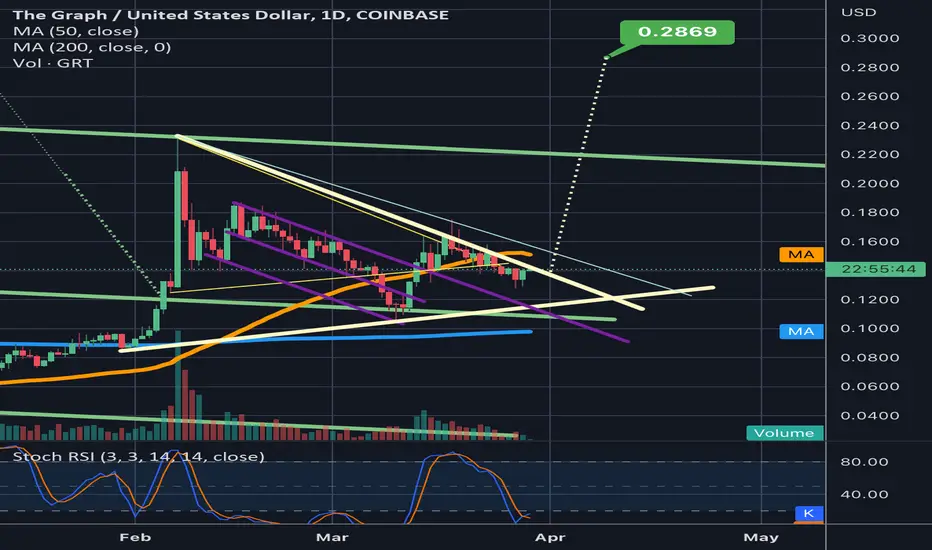
GRTUSD breaking up from symmetrical triangleShown here in yellow. If price action holds the 1 day 50ma (in orange) as solid support. The triangle should break up and take us above the horizontal green channel trendline. *not financial advice*

GRTUSD long (76 % gains) NEWGRTUSD has been correcting after making 320 % gains and currently the price remains under the downsloping reistance line.
Spot trading - Long setup:
entry: 0,1189 $
Target: 0,21 $
Good luck

$GRT 1ST LOOKgraph breaking out and heading to .50 IMO
tested the downtrend line
currently using 18 week high/low channel as support

The Graph Tether building up for breakout. looking at fib extension levels on a daily timeframe for price targets.
$0.28
$0.39
$0.56

GRTUSDT Inverse Head & ShoulderGRTUSDT Inverse Head & Shoulder & confirmed break out occurs. I suggest long from here. Also average your position in case of slight down.

GRT/USDTGRT losing steam and starting to show first signs of trend shift.
If it loses this support it will go down hard imo.
Currently trading at Mid Range, expecting Range Lows in due time.
This is a swing short for me and I will have 2 Targets as shown on the chart.
Follow, like the idea and feel free to leave a comment.
Check out other ideas if you like this one.

Grt Getting ready For Another breakout Building Up For Massive breakout
Formed Bullish Flag In h4 Timeframe incase of breakout expecting 35 to 40% Bullish Move
GRT - Approaching A Demand 🔎 Analysis #7/50Hello TradingView Family / Fellow Traders. This is Richard, also known as theSignalyst.
As per my last analysis, GRT activated the wedge pattern and traded higher.
Last month, GRT rejected the 0.2 round number and traded lower. Now it is approaching a strong demand zone.
Moreover, the zone 0.09 - 0.1 is a strong support and round number.
🏹 So the highlighted blue circle is a strong area to look for buy setups as it is the intersection of the blue 0.1 round number and demand zone.
As per my trading style:
As GRT approaches the lower blue circle zone, I will be looking for bullish reversal setups (like a double bottom pattern, trendline break , and so on...)
📚 Always follow your trading plan regarding entry, risk management, and trade management.
Good luck!
All Strategies Are Good; If Managed Properly!
~Rich

GRTUSDT - Overbought on 3D timeframePosting for own future reference
RSI is "sell" zone
Price above BB
If today closes red (5.5h remaining), then idea is confirmed.
Same for 3D BTC pair:
Targets: 0.13, 0.11, 0.09 - 0.08. I really don't see it going any lower.
The indicators say "short" but minimize leverage, as this coin has proven to be highly volatile.

GRTUSDT Long Scalp SetupBasically, GRT is currently moving in a bearish channel,
As for now, Downtrend has not be broken, and signal bar has been seen.
Targets and SL are marked on chart,
Lets c

The Graph move following tomorrow news announcement.follow the rabbit! #GRT. falling wedge is a chart pattern formed by drawing two descending trend lines , one representing highs and one representing lows.
It is categorized as a bullish reversal chart pattern.

GRT two waysWhat's more likely? I believe these are two scenario's we need to be looking at in the coming days.


GRT/USDTIn the four-hour time frame, it loses the support of 100 ma.
The upcoming support is the range of 0.14 to 0.1420, which if it cannot maintain, it will correct to 0.13.
If bitcoin falls to 21-20 thousand dollars, this currency can correct up to the range of 0.10 dollars.
In general, it is in a very good condition. In the daily time, it can rise to $0.3, provided that Bitcoin either Range or rises.


Growthpoint wants to come down but this 1 thing is stopping itH&S formed on Growthpoint.
The price broke below the neckline.
But the price still has one major barrier to attack.
the 200MA... As soon as price breaks below, the trade will be more likely to work out.
Right now the price is retesting the neckline giving a potential conservative entry point for shorters.
21>7 - Bearish
Price> 200 - Bullish
RSI<50 - Bearish
Target R11.88
Low probability trade
ABOUT THE COMPANY
Growthpoint Properties Limited (Est. 1987m headquartered in Sandton JHB) is the largest South African primary listed Real Estate Investment Trust (REIT).
Growthpoint has a diversified portfolio of properties, including office, retail, industrial, and residential properties, with a total value of over R150 billion.
Some buildings that Growthpoint owns that you might know are:
Sandton City Office Tower - a 32-story office tower located in Sandton, Johannesburg, South Africa.
Cape Town International Convention Centre - a world-class convention centre located in Cape Town, South Africa.
Alice Lane Towers - a multi-award-winning office complex located in Sandton, Johannesburg, South Africa.
Canal Walk Shopping Centre - one of the largest shopping centres in Africa located in Cape Town, South Africa.
Victoria & Alfred Waterfront - a mixed-use development in Cape Town, South Africa, consisting of commercial, residential, and retail spaces.
Growthpoint has a presence in South Africa, Australia, and the UK, with a combined property portfolio of over 500 properties.


Graph gains 30%GRT is preparing for breakout short-term trend line.
After breakout it can reach $0.23.
It can rise to $0.5 in second step.

VOXEL looks like FIL at $5 and like GRT at 8c- FIL reclaimed the June-Oct '22 range, then pumped above it.
- VOXEL just reclaimed the June-Oct '22 range, and looks poised to pump.
VOXEL now looks like FIL looked at $5 or like GRT looked at 8c. Alts will play only as long as BTC hangs in there. If BTC crashes, then all this goes out the window.
