GRTUSD

GRT to $4. Keep and eye and Don't Miss this great Opportunity!Looking at GRT, the potential to the upside could definitely be very soon. Don't miss this opportunity guys. I will add more info soon. Cheers!
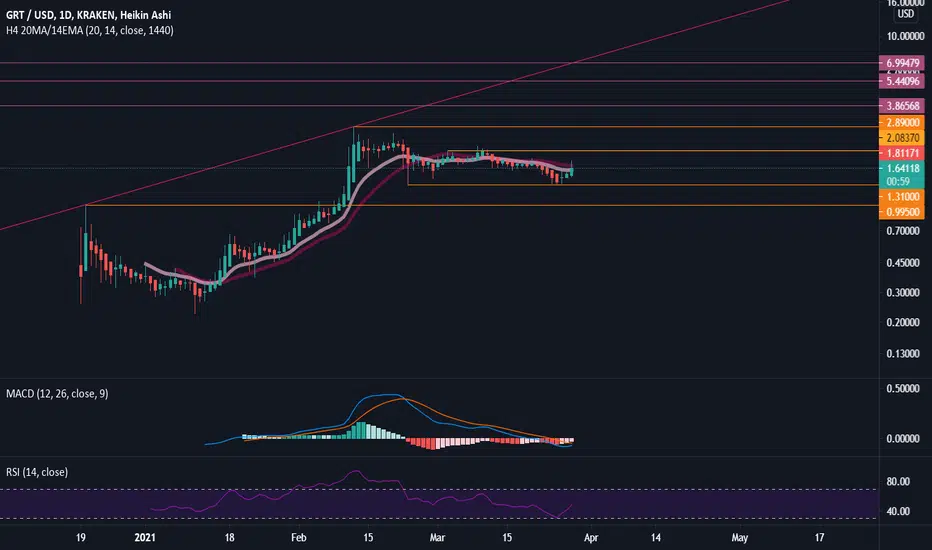
GRT: Alternating corrective waves 2 and 4. Wave 5 up startingOne of the guidelines for waves 2 and 4 of Elliott Waves is that they are often alternating in form. If one is sharp, the other is often flat. You can can see wave 2 for GRT was a sharp zigzag. Wave 4 has been flat and lasted longer than I expected. The consolidation looks to be over with an impulse wave to kick off wave 5. The crypto market looks healthy with altcoin leader ETH recently breaking resistance. Buckle up!

GRT looks bullish on the daily log chartGRTUSD already broke out of the corrective structure and retested the upper boundary. It looks like we’re ready for another strong impulse up.

GRT/USDT : Breakout Confirmed BINANCE:GRTUSDT
Hello everyone 😃
GRT had a breakout on Daily timeframe.
Also now volatility is being bullish..
On last breakout GRT had 230K units bounce and now it's going to happen again !
Major target will be 4$ but it's better to have safe targets for it..
Attention: this isn't financial advice we are just trying to help people on their own vision.
Have a good day!
@Helical_Trades

GRTUSDTWith the break of the resistance range 1.75 -1.85, it is able to grow up to its resistance range PRZ

GRT LONG IDEAIt's alt season, so expect fundamentally strong alts to perform exceptionally well.
GRT is one of those and will be integrated in the entire crypto ecosystem just as much as chainlink is
Dubbed the Google for blockchain, it's already processing billions of transactions. This is my swing trade setup
Buy zones are outlined as below
SL: $1.68
TP zones as outlined
I'm excited for this one, let's see

GRT The Graph - Target close to $8I like this coin for its fundamentals.
The above idea shows a possible breakout over the next month.
Not investment advice.

GRT wants to moon!GRT has been rallying tremendously since its launch in Dec 2020 and has been consolidating since its ATH on Feb 12.
The correction and consolidation has been ongoing for almost 2 (!) months now and since GRT shows these bullish signs:
- MACD cross
- MA cross
- Just set lowest low on RSI (similar to DOT before its recent run-up)
- Cup and handle with neckline in the golden pocket and (still early) seems like a solid bounce from the neckline!
Other factors to take in mind:
- trending on Coingecko
- immensely popular with retail, especially in the USA; with holidays this weekend, I expect the popular coins to surge
- did I say alt season? alt season!
Short term target (next 3 - 7 days): +30%
Mid term target (by mid June): +90%
I expect GRT to outperform BTC in the coming weeks / months, ofcourse; its alt season. :)
Check the links below for more alt coins with huge potential, happy days!
Long term: Given its use case will be increasingly important in the new blockchain based economy, I see huge potential long term for GRT.
But of course you dont care because we are all here for the short term gains; so trade the breakout, if you agree, good luck!
IMPORTANT: this is not financial advice, trade or invest at your own risk and research.

We could see a break out to the upside on GRT.Looking at the graph, the potential to the upside could definitely be very soon.

It's a GRT breakout... Heading out of the long term triangleGRT has just broken through a very long term triangle.... Running parallel for now, but poised to retest next resistance level.

quick GRT chart update/correction of POTENTIAL BUYZONE
hey guys just was taking a quick look at GRT
its starting to confirm alot of trends , this will be about the 4th false pump i have seen . normally with GRT since the launch it has normally stuck to the trend , confirming each on chart until rise . but now i have seen multiple false pumps , one can say that it is confirming a downward trend , but on a larger scale , it looks like it preparing for something BIG , with these drops of $0.20 becoming common , we can expect it to start moving 0.40 on a stroke to confirm a high rise in price
looking at the 1hr chart shows a little insight on how i got to this .

GRT/USD Analyshere we a head and shoulder pattern that is saying us the bearish trend is going to be end here
so if the price can break the neckline we can complete our long orders
but if we had 4h or D1 close candle below the SL line we should close our orders.
i will be happy to know your ideas about this. COINBASE:GRTUSD

Scalp trade long on $GRTPERP in anticipation on e2eThis is a scalp trade and is very risky
The idea is whether it does an e2e and then goes for ATH
target ATH
Sl around $1.5360
Will the Super algorithm indicator bullish sign give more here?

GRTUSDT, new opportunity to growth, THE GRAPHHello my friends, like always everything is clear on the chart for you. Here we have two patterns, the triangle and the head and shoulders. So keep your eyes on the circle, If the price completes the pattern, first target will be activated and then the second target which is 3.8 $. Good luck.
If you like the idea, do not forget to support with a like and follow me for next analysis :)
Write your comment and opinion below for me

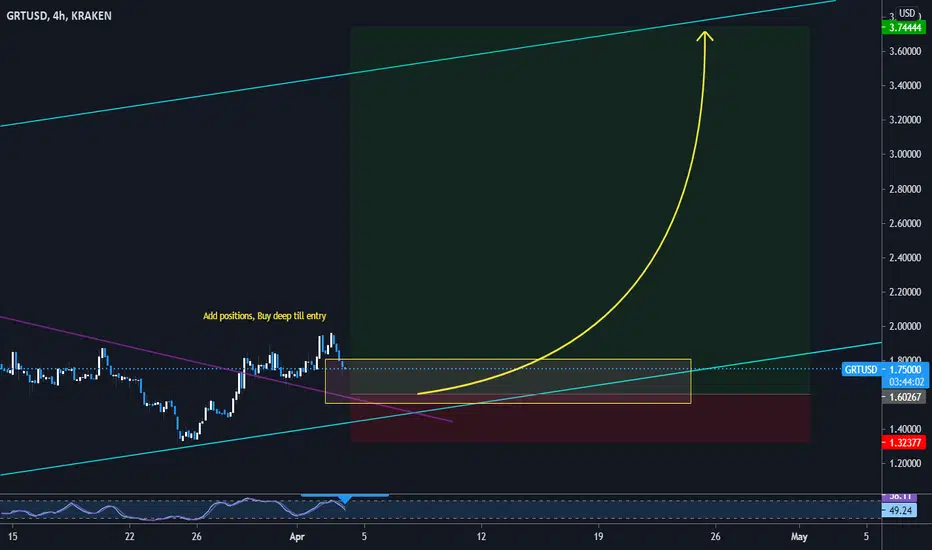
GRT looking to breakout of channel.GRT is currently sitting nicely at the top of this channel.
If it breaks up, entry will be at retest of approx $1.85. with a SL underneath the upper channel limit.
My indicators are starting to look bullish again on the daily and 4H timeframes, so potentially a breakup here.
Happy Trading.

The graph grand master deep insight by matin taherzadeh-Hello everyone
GRT (the graph) looks pretty through its consolidation. So let’s make an deep insight on it.
Between March 23th-28th grt/usdt pair made inverse head and shoulder pattern on 4H time frame not shown on analysis sheet but is obvious, the token completed and confirmed the pattern with the long thick 28th March daily candle. Moreover, in confluence with this, grt broke above the moving average showing us it’s possible too make it bullish.
RSI trendline has broked and the money flow index create bullish scene on Daily time frame.
Another interesting factor about the token is a HVN zone followed by decreasing bar length shown in the analysis sheet.
If the bulls can hold the price above moving average, they will plan an powerful attack to the red zone and then to the last line of defense of bears in 2.2877$ and if can break it, the price of this token retest the high of the swing in 2.89$ and rally to the 3.82$ Will be in the instruction.
Please do your own research before any trade and just believe in your decision for risk management requirements.
The recommended stop loss for this analysis is a rectangle with the high of 1.39$ And the low of 1.35$ and if price broke below the stop loss’s zone low, the analysis become invalid.
Hope you joy from this analysis and with that: happy trading ;)

GRTUSDT To The Moon!GRTUSDT (4H CHART) Technical Analysis Update
GRT /USDT currently trading at $1.70
Buy-level: $1.68 - $1.70
Stop loss: Below $1.45
Target 1: $2.00
Target 2: $2.45
Target 3: $2.85
Target 4: $3.00
Max Leverage: 3X
ALWAYS KEEP STOP LOSS...
Follow Our Tradingview Account for More Technical Analysis Updates, | Like, Share and Comment Your thoughts.

GRT Crossed Up the Dynamic Resistance LineGRT broke the dynamic resistance line. Two short-term profit levels have been shown in the chart.
*No financial advice

GRT-12h. Ambiguous situation and the likelihood of growth to 3.5For almost a month and a half, the GRT market is undergoing a correction of the previous powerful growth wave. In the range of $1.3-1.35 , buyers organized a liquid zone, from which the GRT price has already bounced twice. However, starting from February 24, trading volumes fell sharply and we cannot say with certainty that there is a strong buyer in this price zone.
At the moment, buyers are trying to break through the local downward trend. The price is at the upper trendline, from which it has rebounded twice already.
Now the situation is not very predictable and it is worth waiting for either a confident breakdown of $1.86 , or a rebound in the GRT price from the upper trend line of the channel.
If buyers manage to test $2.15 and then hold the range of $ 1.65-1.7, we will expect a renewal of the historical maximum and a test of the mark of $ 3.5.
However, do not forget about the alternative scenario . If buyers within this attack fail to break through the upper trend line of the falling channel, a triangle with a flat bottom will form on the chart:
In this case, we will expect a breakdown of this triangle downward with a probable final target of $0.8. If this scenario starts to be implemented, we will make a new idea, since $ 0.8 is the most negative goal that can be within this scenario.
___________________________
We create both short-term ideas (for a local understanding of the market situation) and medium-term forecasts of price movements.
Subscribe to us and get daily concise analytics!

GRT what I see 4h ChartI just wanted to share my idea for GRTUSDT base on my BTC Bitcoin forecast
This is just my personal opinion, I don't have any market background, this is just based on the facts i know about the market for now and what i see in the chart.
I'm doing this kind of charts for 2 weeks now, keep this in mind too.