GRT gonna Fly Very Soon | Don't Miss it this time !!!Hey guys welcome for a fresh update on GRT
--------------------------------------------------------
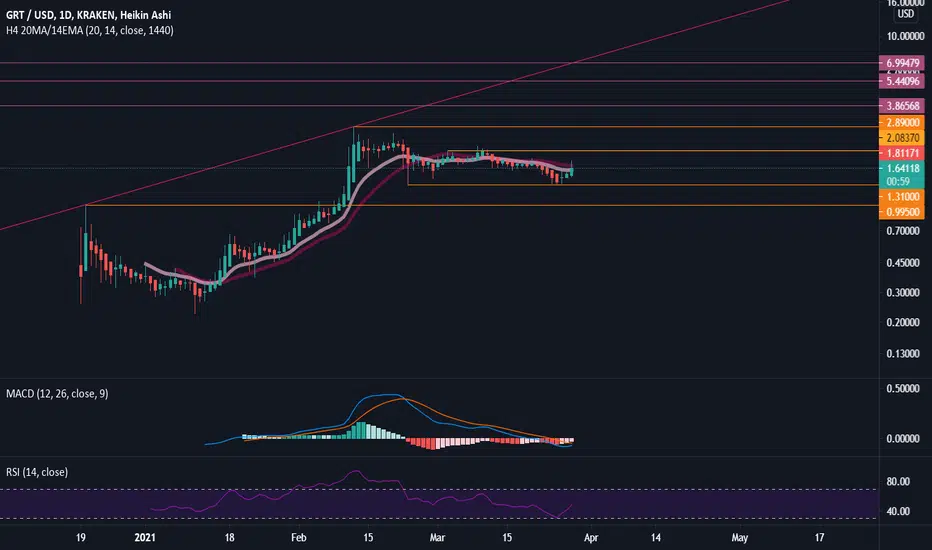
GRTIs getting Ready for another leg up !!
--------------------------------------------------------
GRT has been forming right triangle pattern like before...
And Its Almost done with it..
If You can Hold For a month than GRT must be the first choize for you
Easy 2x coin
Have a Look in the chart
Don't Miss Out on it....
Give a thought to it and manage your risk carefully...
Let me know whats your target and suggestion In Comment Section
Will Be back with another Premium Trades in the mean time..
--------------------------------------------------------
Thanks for reading... Give us a THUMBS UP if you like it...
--------------------------------------------------------
this is Husain Zabir, signing out
Thankyou...
Grtusdt


GRTUSDT First TARGET $2.10BINANCE:GRTUSDT
GRT Broke Descending Trendline with a very Good Volume and Fundamentals are Good
So I'm Entering Here
Targets: $2.10 / $2.40 / $2.80
Stoploss: if You taking a leverage Position Closing Below Support Box ($1.57) on 4h or Daily Candle, if Not Let it be and I will Update For Exit Points


GRT Looking great keeping an eye for key daily close!The graph is showing lots of life the past couple days and currently is looking great sitting in the 0.3 FIB level. Im looking for a very key daily close in aprx. 1 hour from now above the 0.3 we are currently at. In my mind this shows lots of strength and momentum to keep going up.The stoch RSI and the RSI are both looking great pointing up and the MACD is actually showing some real signs off flipping to bullish! GRT has been among the top market leaders the past couple days and i think we definitely can keep it up. Remember if BTC keeps showing some strength and heading up almost all the market will aswell. NFA just my opinion!

GRTUSDT look bullish!GRTUSDT (4H CHART) Technical Analysis Update
Waiting for the resistance line breakout
GRT/USDT currently trading at $1.70
Buy-level: Only buy after the resistance line breakout (Above $1.75)
Stop loss: Below $1.45
Target 1: $2.00
Target 2: $2.45
Target 3: $2.85
Target 4: $3.00
Max Leverage: 2X
ALWAYS KEEP STOP LOSS...
Follow Our Tradingview Account for More Technical Analysis Updates, | Like, Share and Comment Your thoughts.

The Graph [GRT] support & directionHi everyone,
Looking at the 4H timeframe, after a strong bearish move when hitting its ATH $2.88 in Mid. February, GRT seems to found support at its 0.618 Fib. retracement (~$1.25).
In case we can hold the grey trend line as support, other important levels can be tested as highlighted in the chart.
As these corrections are normal market cycles, I am still bullish on The Graph in the long run!
Strong fundamentals:
> Migration path to Mainnet starting in April 2021
> Team expansion
> Integration Clover Finance
In case we fall below the lower grey trendline that acts as support, above set-up will be invald
🌜 Please like and leave a comment 🌜
This is not financial advice

GRT 4HGRTUSDT , moving up is expected in case of break out and retest .
NOT AN INVESTMENT OR TRADE ADVISE, DO YOUR OWN ANALYSIS.

GRT usdt - Pullback from resistance levelsThe Graph saw a push the past few days.
But the resistance levels proved too much.
Interesting formation right now.
Pricing below slight falling EMA.

GRT Close to Breakout?
The Graph $GRT looks bullish and could breakout anytime soon with a short-term target of $2.40 area.
Please like and follow if you found this idea helpful, and as always this is a prediction and not financial advice. Thanks! 🤑

$GRT The GraphThis one had a astonishing launch and directly became listed on all the major exchanges (binance/coinbase etc) on the day after release, so the fundamentals have to be good. If you are interested in altcoins, I suppose this one is one of the quality coins to have a look at.
Price has now be ranging after a quality pump, will be holding this one throughout the year and eventually add on dips if they come


Crucial Level For GRT to hold!GRT has been dumping for awhile now but i do believe some of this is due to market conditions as of right now, we are looking to hold the 0 FIB for the second day in a row and i think we definitely can. we have lots of room for a runup to the 0.2 FIB ultimately creating new support on the way up. If we do breakthrough the zero fib and drop we are looking at weak supports at the 1.06$ mark and 0.87$ (USD) i think we are going to really count on BTC reversing in the short term to start seeing some upwards action. we see our Stoch Rsi is just going sideways in the oversold zone. I expect April is going to be a lot better for the markets as March is one of the most "bearish" months. Not financial advice just my opinion!


$GRTUSDT Buy the breakout$GRT Falling wedge on the daily. Currently sitting at 3 day support level. Buy the breakout of of the pattern

When will GRT reach the old peak?I used the Fibonacci Time Zone and the Fibonacci Retracement to measure the top and bottom of the GRT as shown below.

BULLISH DESCENDING TRIANGLE Descending triangles are mainly considered continuation patterns but they also can be used as reversals. This pattern starts with an initial impulse move followed by a point of consolidation. As price consolidates it makes lower highs and equal lows forming the descending triangle. The momentum builds up and usually breaks out back into the direction of the trend. If price does break back into the direction of the trend then look for a continuation and the target is the Distance Between The Mouth Of The Triangle Added To The Breakout but preferably I use a 100% extension of the first impulse move.


GRT/USDT BINANCEGRT/USDT BINANCE
4H hollow candles.
Price breakout will occur at the end of the asymmetric triangle.
Nice entry point right here.
Steady volume.
The Graph Price (GRT) = $1.69 -1.12%
0.00002914 BTC3.62%
0.0009386 ETH2.34%
Good Luck
CryptoHellas Team

GRT getting ready for a big move!GRT has been trying to regain our long term resistance level but has been getting rejected multiple times, but i think grt is loading up for a big move we see the bollinger bands starting to squeeze and the stoch RSI has flipped as of right now to bullish and looking to explode out of the oversold zone. Aswell our wave trend oscillator is looking like we could see a reversal soon! definitely going to watching this one! we could see a really nice breakout here after recent downside and accumulation! NFA just my opinion
