GOLDMAN SACHS - Sell Opportunity - Target Remains @ $190Today we managed to break and hold below the 200 MA on the daily time-frame.
Target remains at $190
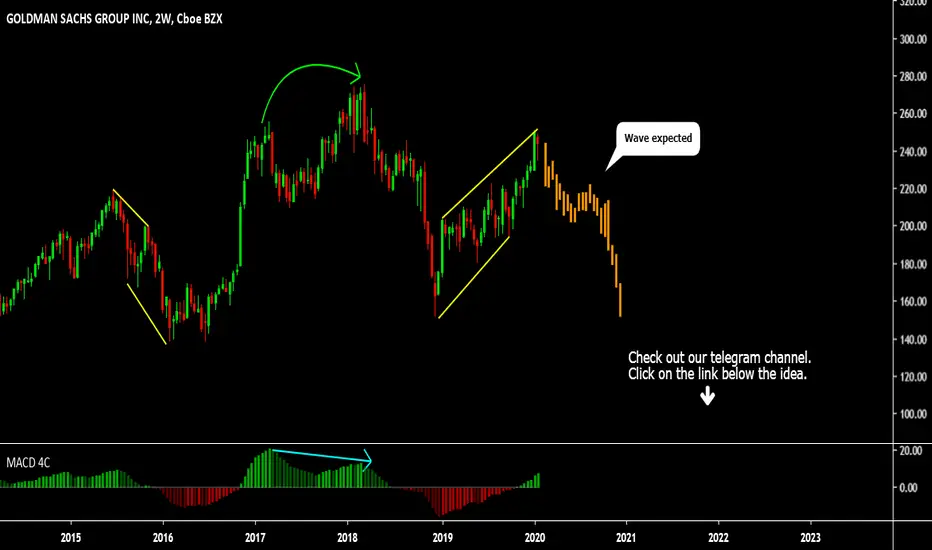
GS

Goldman Sachs $GS SELLTechnically bearish
Q2 Earnings very short lived
Struggles to hold above 200 SMA
Stock pared its gains since the report
Weekly candle made lower low.
Further downside is warranted.
Near-term Short Target $190


GS BUY HERE , TARGET UP TO $250GS has confirmed the target " Flag " pattern is the resistance of the old peak of $ 250, the current price is above the MA200 moving average.
- The Macd shows support for the new uptrend.
- Market sentiment also shows optimism.
GS buy : $212-$214
GS target : $250
Stop loss : $195 ($195 is the price range showing strength, determination to grow, the volume here is large, once it is reduced below $195, all efforts to increase prices will be canceled) .
Wish you good deals!

BanksLike the airline stocks, big banks have all formed similar patterns leading into Monday. Funding seems to have shifted to the banks and airlines. Many banks will be reporting earnings this coming week, including JPM, WFC, Citi (not shown) on Tues. 7/14, USB and GS Wed. 7/15, and BAC, MS, and First National Bank (not shown) Thurs. 7/16.


Goldman Sachs Maybe On The Selling Mode On CorrectionsGoldman Sachs stock price now on corrections on the daily timeframe & may face another phase of bear if the price is rejected at the bearish order candle at 193.44.
N.B
- Let emotions and sentiments work for you
-ALWAYS Use Proper Risk Management In Your Trades

Dare Catch A Knife? Wells Fargo.Wells is now off more than 50% since the start of the Coronavirus pandemic. However, Wells suffers from much more than a pandemic:
Over the last two years, scandals around nefarious sales practices, some unfortunate executive departures, and an inability to grow top line has hit them hard, and the crisis has hit them especially hard in revenue terms.
We're now looking at 2012 levels, not too far from where we were during the financial crisis.
Peak to trough in 2009 we saw a 69% decline in $ NYSE:WFC ... more to go here?

Lower rates = worse bank profitability.Hey.
I'd like to talk about the effect of lower interest rates on something called 'net interest margin'...
In other words, how banks make money.
The chart attached shows US commercial banks' net interest margin (blue) versus the target Fed Funds range (white).
Net interest margin (NIM) is a measure of the difference between the interest income generated by banks or other financial institutions and the amount of interest paid out to their lenders (for example, deposits), relative to the amount of their (interest-earning) assets.
What can we see from the chart?
As the Fed Funds target range decreases, bank net interest margin does as well.
Currently, there is talk of going negative, and just last week, Fed Funds futures priced in negative rates for the first time ever for the Dec 2020 meeting and the Jan 2021 meeting.
This is important.
See, if people are of the opinion that lower interest rates will lead to less bank profitability, then they are likely to short financial stocks.
And if people are shorting financial stocks, it can lead to a decline in lending and liquidity in the economy - which leads to dampened demand.
Over the last few years, a type of bond known as an AT1 (Co-convertible) has been used to try to sure up bank common equity tier 1 (CET1).
This gives regulators a gauge of strength of the financial institution in question.
It works like this...
The investor buys the bond, and if the share price of the bank falls to a certain level, the bond is converted into equity to prop up the CET1 of the bank.
The problem is that these investors (mainly hedgefunds and sophisticated investors), are alpha seeking...
In other words, they will hedge the delta of the decline in their bond by shorting the bank stock.
This creates a bit of a doom loop on two fronts, firstly by removing the validity of the AT1 instrument, but secondly, the decline in net interest margin leading to the shorting of bank stock and the incapability to adequately lend.
Markets and economies function on liquidity, and without it, we are in serious trouble - which explains the lengths to which governments and central banks have gone to liquify *everything*...
And why equities just keep going up...
See lower rates and more QE lead to equity risk premium compression - that is, the premium paid to take the risk of investing into higher risk assets versus simply staying invested in riskless assets (such as government bonds) - and ends up with investors piling money into equity markets.
If the perceived risk of investing into equities is a tiny bit greater than staying invested in risk-free assets, then you will get into equities.
This is exactly what has happened over the last 10 years - and it's why the market threw a fit when the Fed tried to raise back in '18.
Passive long strategies have become the norm - buying ETFs such as $SPY and simply holding - and this also affects bank profitability; less trading = less commissions paid to the dealer.
This is one reason why so many banks have moved into high frequency market making activities - Volcker prevented them from prop trading, but allows for market making (which in the high frequency trading area is largely still prop trading, although trying to prove that is tough).
Jerome Powell is expected to push back against negative rates tomorrow, and the rhetoric leading into this from Fed members has been that they do not like negative rates.
It remains to be seen, but real yields across the curve from 1y-30y are currently priced negative...
So what's the difference, really? (tongue in cheek).

FAS looks to possibly be setting up for a few week bull runMy custom-coded indicators are pointing to a small bull run in financials over the next few weeks. I'm waiting for the green bar to turn grey, but my indicators are saying it's gonna happen

GS inside day after ER!One of my most favorite trade!
JPM's breakdown previously had worked so well to hit the TP2,
I'll also be interested in this GS trade today and be willing to take both sided!
Let's see how it goes yo!


GOLDMAN SACHS GROUP INC (GS) DailyDates in the future with the greatest probability for a price high or price low

GOLDMAN SACHS GROUP INC (GS) WeeklyDates in the future with the greatest probability for a price high or price low

GOLDMAN SACHS GROUP INC (GS) MonthlyDates in the future with the greatest probability for a price high or price low


Goldman Sachs ominously below 200IF you follow me, you’d know that earlier this week, I already saw the S&P500 revisiting and exceeding the last low. While the earlier part of this week saw a rebound, it is wide ranged and volatile. It is about time for a revisit to the lows, and did you know that Goldman Sachs (financials) are leading the way?
Technically bearish, GS is leading the reversal down...

GS LongGS testing channel support and previous breakout . oversold conditions where a bounce was imminent. Good area to go long here

GS Shifting to a Sideways Price PatternResistance thwarted GS price action, causing the stock to retrace. It is now shifting to a sideways price action with common gaps.

GS SELL (GOLDMAN SACHS GROUP INC)Hi there. Price is forming a continuation pattern to the downside. Watch strong price action at the current price for sell.