GS Long SetupPrevious resistance acting as support and closed above 100 EMA . Target 244
XLF telling a different story. Stay cautious.
GS

XLF Has Its Pre Financial Crisis High In SightsThe popular ETF, XLF follows the financial sector and after weeks of selling, it looks to have found support and be gearing up for a big move indicated by the Weekly Squeeze coiling for the past 8 weeks, with the momentum shifting to bullish this week. If you take a look at C (Citigroup), it too has a Weekly Squeeze. If you take a look at it on a Daily it also has a Squeeze which looks like it will fire long. If this move for the financial sector plays out long, I would expect a retest of its high back from January (30.33) then a retest of it's high of 30.84. This high (30.84 - May 28, 2007 - 11+ year ago) is an important one because this was the peak of the financial sector ETF ( XLF ) before the financial crisis of 2008.

Sellers Reward A Weak Stock Market Bounce With A Bearish FadeAfter a gap down to start the week, the S&P 500 (SPY) pivoted around its 50DMA. The week ended further confirming a bearish market turn.
Sellers Reward A Weak Stock Market Bounce With A Bearish Fade drduru.com $SPY $QQQ #T2108 #AT40 #VIX $UVXY $AAPL $AMZN $AXON $GS $CCS $PHM $TOL $KBH $MDB $PZZA $SNAP $TLT $ULTA $USO


Buy the Banks, Suckers!Every time I turn on CNBC, FBN, or the like, I hear a pundit or analyst pounding the table to "buy the banks." The go on to ramble a spiel about low valuation rations (P/B, P/E, P/FCF, etc), rising rate environments, yield curve inversions, and other reasons that they should outperform the markets going forward. But who's biting?
A quick glance at the SPDR financial ETF - XLF - and you will likely arrive at the conclusion that this is a sell, not a buy. We've broken short term trends (red dotted lines), intermediate term trend (orange dotted line) from 2016 lows, and are approaching a trend line (green dotted line) from the recession lows nearly a decade ago. Even worse, it looks to have formed a double top at the $30 level, the first peak coming in 2007.
Until there's a bid to reverse trend, this is a hard sell. Support looks to come in around $25. If that fails, the next support is around $21, but that's crash-level support.
Of course, one must ponder... if the banks are rolling over, how well can the broader markets hold up? Is this the warning shots of a larger correction in the markets? Hmm...

GOLDMAN SACHSOn GOLDMAN SACHS Daily chart, was formed a bullish divergence, price/CCI. However, the signal for opening a long position only after the breakout of the blue trendline.


Análsis 11 de Mayo Swing GSAnálisis de Swing en GS para el 11 de mayo Alto riesgo sin vela confirmatoria. Juego a pura institucional.

Actualización Análisis GS Hace una semana trabajamos un Swing Call GS pero en los últimos 3 días ha hecho un cambio de patrón dando formación de triángulo descendente. Por lo que decidimos reversar las posiciones buscando el rompimiento de triángulo hacia la baja. Posiciones de alto riesgo.


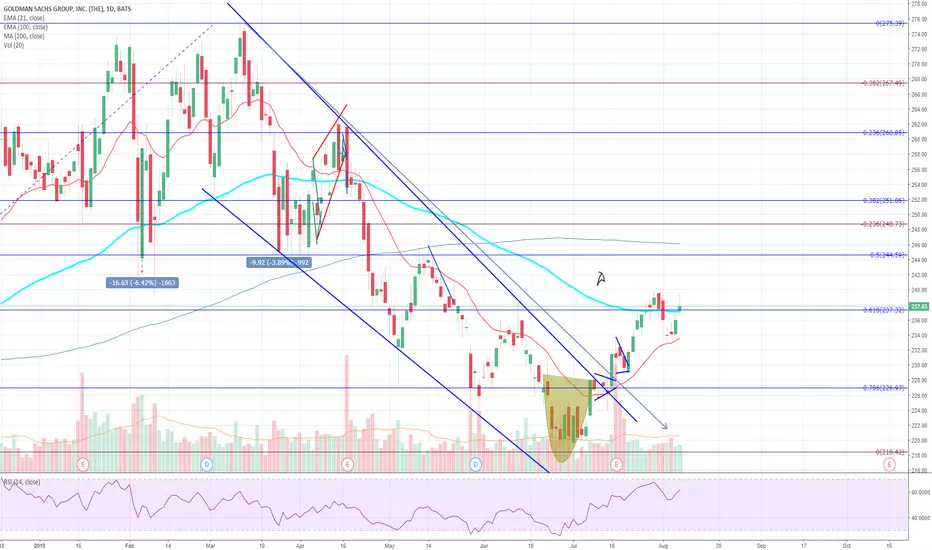
GS - HS& formation short from $236.83 to $19.13 GS seems forming a possible downward neckline H&S formation. Twiggs money flow deep in the negative side. Now if it can break its neckline around 236, it can decline down to 220 area.
* Trade Criteria *
Date First Found- April 26, 2018
Pattern/Why- H&S formation
Entry Criteria- $236.83
Exit Criteria- $219.13
Stop Loss Criteria- $246.77
Indicator Notes- Twiggs money flow deep in the negative.
Special Note- $225 July Puts which are currently reported to be $4.80
Please check back for Trade updates. (Note: Trade update is little delayed here.)

$GS Looking Oversold$GS Expecting a bounce in the near term. Stock is looking oversold approaching trend line and 200 day ema.

Bearish SignalsFirst off, I'm not the best @ TA, so I would appreciate it if a mistake is seen - please tell.
Multiple bearish signals on Ichimoku cloud, RSI, MACD. Very similar pattern is evident on GS & MS.
Default rates on student loans, retail, & personal are climbing. Combined with a mediocre jobs report, this spells out trouble for banks. However, to me, the most important thing is that big banks have continued to do sub-prime loans. They are the loaners of the loaners of the loaners. Many 2nd & 3rd tier subprime loaners have defaulted and declared bankruptcy. This is not good news for big banks, who, in my opinion, have got greedy, again. On top of this, banks did not do exceptionally well in earnings considering the tax cuts of President Trump.
Nearly $200B in likely exposure, at minimum, for the top 6 big banks alone.
wolfstreet.com
wolfstreet.com (I quite like wolfstreet, very well researched analysis, reasonable article, in my opinion)
www.forbes.com

Bearish pattern on the financialsYou can see here that financials have put in a series of lower low's. Often in such cases, we see retracement back into the original range. If you are looking for a short opportunity entering at the 50% level with a downside target at the 1.6 extension level would offer a reasonable risk/reward ratio. With the midterms coming up, I would expect a low prior to election day.


GS Goldman Sachs - Ascending Triangle, Fib clearanceQuick long opportunity in play here...
ascending triangle, Fibonacci clearance. Chart tells the story. Opportunity for 10+ pt move in a high prob. setup.
Target 278-281.


monitoring bearish Head & Shoulders set upXLF needs to get over $29.50 to invalidate the bearish head and shoulders pattern present. Focusing on the right shoulder Red Box . Head and shoulders pattern is not confirmed nor completed yet. Disclosure i'm short $bac Bank of America


Overview in US Economy 1996 - TodayThe closer you look the less you see.
Goldman Sachs four stages of economic growth
1)Despair
Outperformed : verified
Utilities and Health care
2)Hope
Outperformed : verified
Car Manuf
Chemicals
3)Growth
Outperformed : verified
Real Estate
Travel Sector
4)Optimism
Outperformed :
Latest themes such as : verified
Electric cars
Latest tech such as : verified
Cryptocurrency
